SN 1986J VLBI. III. The Central Component Becomes Dominant
Abstract
We present a new 5-GHz global-VLBI image of supernova 1986J, observed in 2014 at yr after the explosion, and compare it to previous images to show the evolution of the supernova. Our new image has a dynamic range of 100 and a background rms noise level of 5.9 Jy beam-1. There is no significant linear polarization, with the image peak being % polarized. The latest image is dominated by the compact central component, whose flux density is now comparable to that of the extended supernova shell. This central component is marginally resolved with a FWHM width of as, corresponding to a radius of cm for a distance of 10 Mpc. Using VLBI observations between 2002 and 2014, we measured the proper motions of both the central component and a hot-spot to the NE in the shell relative to the quasar 3C 66A. The central component is stationary to within the uncertainty of 12 as yr-1, corresponding to 570 km s-1. Our observations argue in favor of the central component being located near the physical center of SN 1986J. The shell hot-spot had a mean velocity of km s-1 to the NE, which is consistent with it taking part in the homologous expansion of the shell seen earlier. The shell emission is evolving in a non-selfsimilar fashion, with the brightest emission shifting inwards within the structure, and with only relatively faint emission being seen near the outer edge and presumed forward shock. An animation is available in the electronic edition.
Subject headings:
supernovae: individual (SN 1986J) — radio continuum: supernovae1. Introduction
SN 1986J (catalog ) was one of the most radio luminous supernovae ever observed. Its unusually long-lasting and strong radio emission and its relative nearness makes it one of the few supernovae for which it is possible to produce detailed images with very-long-baseline interferometry (VLBI). It is also one of the few supernovae still detectable more than years after the explosion, thus we have been able to follow its evolution for longer than for any other SN for which there are resolved VLBI images except for SN 1979C (Bartel & Bietenholz, 2008; Marcaide et al., 2009). It is one of the few SNe which we have been able to follow observationally as it evolves towards a supernova remnant, and it thus helps to build a connection between supernovae and their remnants (see Milisavljevic & Fesen, 2017). We continue here our series of papers on VLBI observations of SN 1986J: Bietenholz et al. (2002, 2010b), which we will refer to as Papers I and II respectively, as well as Bietenholz et al. (2004).
SN 1986J was first discovered in the radio, some time after the explosion (van Gorkom et al., 1986; Rupen et al., 1987). The best estimate of the explosion epoch is (Paper I, see also Rupen et al., 1987; Chevalier, 1987; Weiler et al., 1990), which we take as . It occurred in the nearby galaxy NGC 891, for whose distance the NASA/IPAC Extragalactic Database (NED) lists 19 measurements with a mean of Mpc, which value we adopt throughout this paper.
Optical spectra, taken soon after the discovery, showed a somewhat unusual spectrum with narrow linewidths, but the prominent H lines led to a classification as a Type IIn supernova (Rupen et al., 1987). Due to its relatively high radio flux density, it was one of the first SNe to be observed with VLBI (Bartel et al., 1987). A VLBI image, the first of any optically identified supernova, was obtained by Bartel et al. (1991). VLBI observations at subsequent epochs up to 2008 led to a series of images. The source morphology was complex, showing an expanding, albeit somewhat distorted shell with a prominent hot-spot in the shell visible once the resolution was sufficient.
Other than the relatively slow turn-on, and its high radio luminosity, the evolution of SN 1986J’s spectral energy distribution (SED) was unremarkable till 1998. In Paper I, we showed that at that time, an inversion appeared in the spectrum, with the brightness increasing with increasing frequency above 10 GHz, up to a high-frequency turnover at 20 GHz.
In Bietenholz et al. (2004), we showed by means of phase-referenced multi-frequency VLBI imaging that this spectral inversion was associated with a bright, compact component in the projected center of the expanding shell. Such a central component has so far not been seen in any other supernova111We note that central emission at mm wavelengths has been seen in SN 1987A, which is attributed to dust. No central synchrotron emission has been seen in SN 1987A at cm wavelengths (Zanardo et al., 2014). (see e.g., Bietenholz, 2014; Bartel & Bietenholz, 2014). At that time, in late 2002, the central component was clearly present in the 15 GHz image, but not discernible in the 5 GHz one.
In Paper II we showed that from 2005 on, the central component had become bright also at 5 GHz. We also showed that, though the morphology was complex, the radio emission region was still expanding but also decelerating, with the average outer radius .
2. Observations and Data Reduction
2.1. VLBI Observations
We obtained VLBI observations of SN 1986J on 2014 Oct. 22, using a global VLBI array which consisted of the following 21 antennas. From the National Radio Astronomy Observatory (NRAO)222The National Radio Astronomy Observatory, NRAO, is a facility of the National Science Foundation operated under cooperative agreement by Associated Universities, Inc.: the VLBA ( m diameter, Mauna Kea did not observe), the Jansky Very Large Array (in phased mode, equivalent diameter 130 m); from the European VLBI Network: Badary (32 m), Effelsberg (100 m diameter), Hartebeesthoek (26 m), Jodrell Bank Lovell (70 m), Noto (32 m), Onsala (25 m), Svetloe (32 m), Torun (32 m), Westerbork (phased mode, equivalent diameter 94m), Yebes (40 m) and Zelenchukskaya (32 m).
The observations of SN 1986J were interleaved with ones of the quasar 3C 66A (catalog ), only 40′ away on the sky, which we used as a phase-reference source. SN 1986J’s declination of +42° enabled us to obtain dense and only moderately elliptical - coverage. As usual, a hydrogen maser was used as a time and frequency standard at each telescope. We recorded both senses of circular polarization with the RDBE/Mark5C wide-band system at a sample-rate of 1 Gbps, and correlated the data with NRAO’s VLBA DiFX correlator (Deller et al., 2011). We used a bandwidth of 128 MHz centered on 4.996 GHz. The data reduction was carried out with NRAO’s Astronomical Image Processing System (AIPS). The initial flux density calibration was done through measurements of the system temperature at each telescope, and improved through self-calibration of the 3C 66A data.
We used a cycle time of 3.2 minutes to phase-reference to 3C 66A, with about 1.8 minutes spent on SN 1986J. Our positions in this paper are given relative to an assumed position of the brightness peak of 3C 66A of RA = , decl. = taken from the International Celestial Reference Frame, ICRF1333We note that a slightly revised position for 3C 66A is given in the ICRF2 (Fey et al., 2009), which is different from the one we used by as in RA and decl. respectively (Ma et al., 1998). However, for consistency, we use in this paper the same ICRF1 reference position for 3C 66A as we used in Paper II, which has no effect on the differential positions or any of our conclusions..
We determined the instrumental polarization leakage from our observations of 3C 66A, which is almost unpolarized, using a linear approximation (AIPS task LPCAL). We did not calibrate absolute position angle, so our polarization measurements resulted in correct magnitudes but unknown position angles.
2.2. VLBI Imaging Considerations
Imaging and deconvolving interferometer data can be difficult, particularly in the case of a non-uniform and relatively sparse array like that used for VLBI. We use the multi-scale extension of the original CLEAN algorithm, MS-CLEAN (Wakker & Schwarz, 1988), for the deconvolution. MS-CLEAN works similarly to the traditional CLEAN algorithm (see, e.g., Cornwell et al., 1999), but instead of just using a single basis function based on the central lobe of the dirty beam, that is one based on the “native” or highest resolution possible in the data, MS-CLEAN simultaneously deconvolves images at that native resolution and several larger ones, and then combines the different resolutions into a final image. MS-CLEAN has generally been shown to produce superior results for the deconvolution of extended sources (see, e.g., Hunter et al., 2012; Rich et al., 2008; Bietenholz et al., 2010a).
Greisen et al. (2009) and Cornwell (2008) discuss the properties of MS-CLEAN as implemented in AIPS. Aside from the selection of resolutions, the main parameters for tuning the MS-CLEAN algorithm are the order in which the different resolutions are treated, and the depth to which they are CLEANed (Greisen et al., 2009). We made two different simulated visibility data sets for testing, both designed to be relatively similar to the brightness distribution of SN 1986J. The first one was a geometrical model consisting of an almost circular disk of diameter 8 mas and a slightly off-center marginally-resolved Gaussian source with full-width at half-maximum (FWHM) 0.4 mas. The second model consisted of the CLEAN components derived from a deconvolution of the real data. We replaced the observed visibility values with the relevant Fourier transforms of these models and then added noise at a level comparable to that in the observed visibilities. We deconvolved the resulting simulated visibilities, and compared the resulting CLEAN images to the model images after convolving the latter with the CLEAN beam.
We found that the most accurate reconstruction was achieved for both models when the CLEAN iterations were stopped when the flux density of the CLEAN components had reached the rms image background level. We also found that a multi-scale CLEAN with three resolutions, with FWHM beam areas of 2.2, 10.5 and 36.1 mas2 gave good results. Using this imaging strategy, the rms error within the CLEAN window, i.e., the difference between the CLEANed image and the original model, was only 3% and 16% larger than the rms image background for the two models respectively, with the worst-case errors being the image background rms.
3. VLBI Images
We show the 5-GHz VLBI image of SN 1986J in Figure 1. The image was made in AIPS, using complex weighting with the robustness parameter chosen so as to attain close to natural weighting (AIPS ROBUST = 2.2). Furthermore, we used multi-scale CLEAN deconvolution with the strategy discussed in § 2.2 above. The total CLEANed flux density was 1622 Jy, the peak brightness 617 Jy beam-1, and the background rms brightness was 5.9 Jy beam-1, for an image dynamic range of 100. We estimate that the on-source brightness uncertainty is 7 Jy beam-1, only slightly larger than the off-source rms.
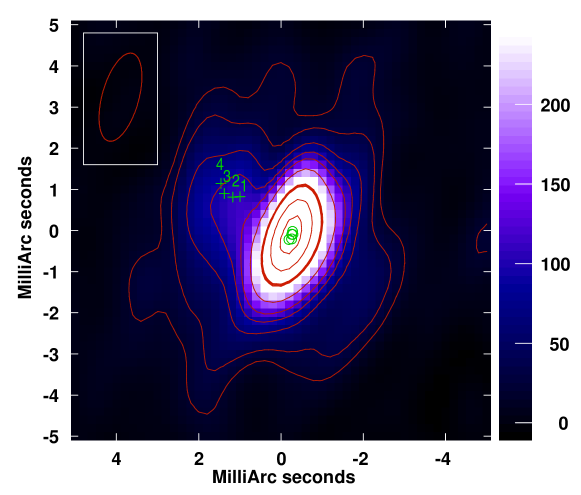
The image is dominated by the central component. In contrast, the highest brightness in the more extended emission is only Jy beam-1, or 15% of the peak brightness of the central component (we estimate the brightness ratio between the central component and the remainder below in § 3.2.1).
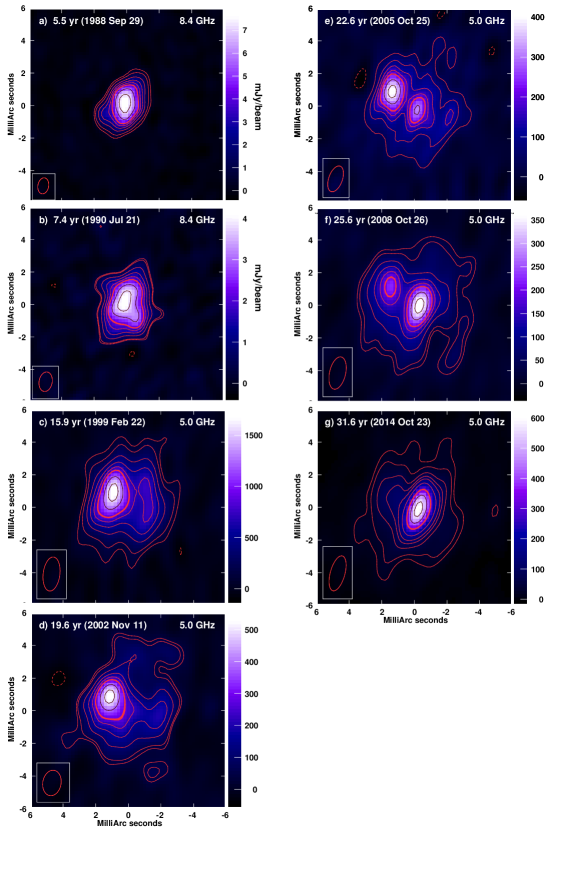
To highlight the evolution of SN 1986J, we show in Figure 2 our earlier images at 8.4 GHZ, reproduced from Paper I, and at 5.0 GHz, reproduced from Paper II. In the first image, at yr and 8.4 GHz, the source is still rather compact but with the protrusions already visible. By yr the protrusions had expanded indicating a complex brightness distribution. At yr and at 5 GHz, the shell hot-spot is visible to the NE of the center. By yr, the central component is starting to appear, and by yr, the central component has become brighter than the shell hot-spot, which is fading. By the present epoch, at yr, the central component dominates and the shell hot-spot is no longer clearly visible.
3.1. Polarization
We also made images in Stokes Q, U, and V. As mentioned in section 2.1 above, we did not calibrate the absolute polarization p.a., but we did calibrate the leakage terms. Therefore, our measurements of the linearly polarized intensity are accurate, but that of the p.a. are completely uncertain. The lack of p.a. calibration turns out to be immaterial, since no significant polarized emission is seen in either linear or circular polarization. We combined the Q and U images into an image of the linearly polarized intensity, , corrected for the Ricean noise bias444 where and are the measured Stokes parameters. By definition, is positive, and in the presence of noise is therefore biased. This bias has been calculated and a bias correction has been implemented in the AIPS task COMB, which we used to calculate our linearly polarized flux densities. This procedure produces the correct mean value of , at the expense of occasionally producing unphysical negative values.. The rms in Stokes Q and U was 4.4 Jy beam-1, while that in was 4.6 Jy beam-1. No significant polarization was detected, with the maximum value of observed being 14 Jy beam-1 or . In particular the polarized intensity at the location of the central component was Jy beam-1, and we put a upper limit on the linear polarization of the central component of 3.3%. This limit is comparable to upper limits we reported for SN 1993J, and consistent with the expectation that internal Faraday depolarization is quite strong (Bietenholz et al., 2003).
3.2. The Central Component
We determined the characteristics of the central component by fitting an elliptical Gaussian model as well as a zero level to the center of the CLEANed (Stokes I) image by least squares. Although the properties of the fitted Gaussian are somewhat dependent on the exact choice of the fitting window because the central component cannot be separated uniquely from the complex background emission due to the shell, the results can nonetheless be used to characterize the central component.
3.2.1 Flux Density
The best fitting point source model, i.e., an elliptical Gaussian of width fixed to that of the CLEAN beam, had a flux density of Jy. We note that the value of Jy is, strictly speaking, closer to being an estimate of the peak brightness in Jy beam-1 than an estimate of the total flux density, since if the component is resolved the latter would be higher. We do in fact find that the central component is slightly resolved (see § 3.2.3 below). However, it is difficult to reliably estimate both the width and the flux density simultaneously. In order to be able to compare the flux density from this epoch with those from previous ones consistently, we therefore take the values obtained by fitting an unresolved source and a zero level to the image as the estimates of the flux density, keeping in mind that we are underestimating the total flux density to the extent that the central component is resolved.
This value of the flux density of the central component at GHz corresponds to a spectral luminosity, , of erg s-1 Hz-1, or 20 times that of the Crab Nebula. If we approximate the luminosity as , the central component’s luminosity is .
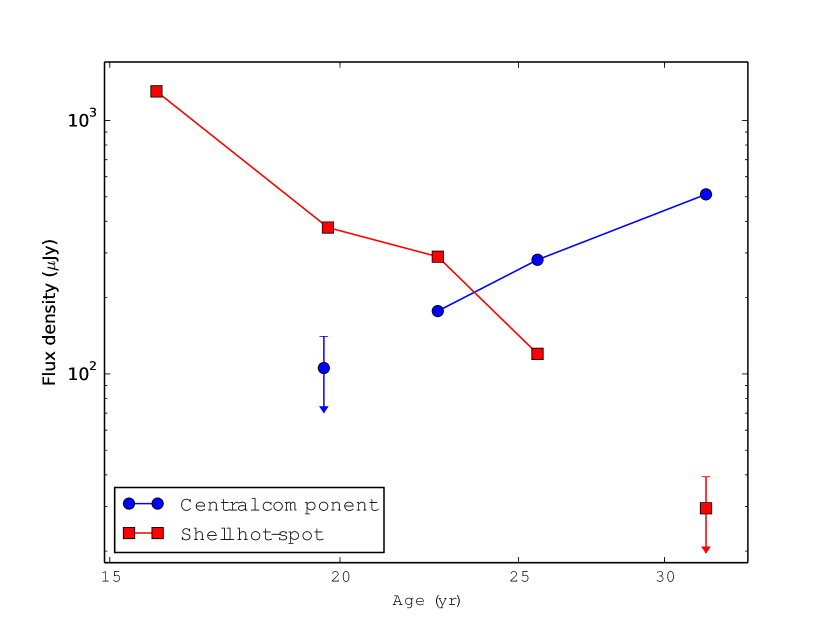
If we fit the images from earlier epochs in the same way, we obtain the values tabulated in Table 1. The uncertainty in these flux-density estimates is difficult to determine accurately as it depends on the separation between the central component and the shell-emission in the fit and how resolved the central component is. However, the general picture seems clear: from yr to yr (2005 to 2014) the central component’s flux density increased by Jy (from 177 to 511 Jy), or by a factor of almost 3. As a fraction of SN 1986J’s total flux density, it has increased from about 7% at yr to 32% at yr. We can therefore say with reasonable confidence that, in the last 6 yr, the central component’s fraction of SN 1986J’s total 5-GHz flux density has roughly doubled, and that the 5-GHz flux density of the central component has increased. We plot the flux density of the central component in Figure 3.
| Midpoint Date | AgeaaThe age of SN 1986J, taken with respect to an explosion epoch of 1983.2 (see Paper I, ). | Frequency | Central component | Shell hot-spot | ||||
|---|---|---|---|---|---|---|---|---|
| Flux densitybbThe flux density of an unresolved source fitted to the image. A variable zero-level was simultaneously fitted. This fit will underestimate the total flux density of a resolved source, but we use this consistent estimate to compare the various epochs, since we cannot reliably determine both the extent and the flux density. | Position offsetccThe position offset from the our nominal explosion center position. We use the interpolated peak-brightness location from the un-selfcalibrated 5-GHz images as our estimate of the positions, and the estimated uncertainties are 120 as in each coordinate. Our nominal explosion center position is the average position of the center of the shell from 1999 to 2008, RA = , decl. = , and we estimate that this position is within 200 as of the true explosion center (see Paper II, ). | Flux densitybbThe flux density of an unresolved source fitted to the image. A variable zero-level was simultaneously fitted. This fit will underestimate the total flux density of a resolved source, but we use this consistent estimate to compare the various epochs, since we cannot reliably determine both the extent and the flux density. | Position offsetccThe position offset from the our nominal explosion center position. We use the interpolated peak-brightness location from the un-selfcalibrated 5-GHz images as our estimate of the positions, and the estimated uncertainties are 120 as in each coordinate. Our nominal explosion center position is the average position of the center of the shell from 1999 to 2008, RA = , decl. = , and we estimate that this position is within 200 as of the true explosion center (see Paper II, ). | |||||
| RA | dec. | RA | dec. | |||||
| (yr) | (GHz) | (Jy) | (mas) | (mas) | (Jy) | (mas) | (mas) | |
| 1999 Feb 22 | 15.94 | 5.0 | 1300 | 0.996 | 0.821 | |||
| 2002 Nov 11 | 19.66 | 5.0 | 380 | 1.172 | 0.809 | |||
| 2003 Jun 22 | 20.27 | 15.4 | ||||||
| 2003 Jun 23 | 20.28 | 8.4 | ||||||
| 2005 Oct 25 | 22.62 | 5.0 | 177 | 290 | 1.376 | 0.895 | ||
| 2008 Oct 26 | 25.62 | 5.0 | ddNote that in Paper II we give an approximate and somewhat larger flux density of 390 Jy for the central component which was derived just from the peak brightness in the image. Fitting the zero-level, as we do here, gives a somewhat lower, but more accurate estimate of the flux density of the component. | 120 | 1.460 | 1.143 | ||
| 2014 Oct 23 | 31.61 | 5.0 | 511 | |||||
The peak brightness of the central component, as estimated by the point-source fit, is Jy beam-1. The average brightness of the shell emission is 50 Jy beam-1, comparable to, but slightly lower than, the shell-brightness of Jy beam-1 estimated by our fit at the central component location. The central component is therefore brighter than the shell is on average.
The shell emission is optically thin, since it has a spectral index of (where ). The central component, on the other hand, had a positive spectral index at 5 GHz at yr and was therefore still optically thick, with the transition to an optically thin spectrum occurring near 13 GHz (Paper II). Extrapolating the SED from Paper II to yr, it seems unlikely that the SED would have evolved to the point it was optically thin at 5 GHz, so the central component is almost certainly still partly absorbed at 5 GHz. The intrinsic brightness ratio between the central component and the shell is therefore likely even higher than 10.
3.2.2 Position and Proper Motion
We take the quadratically interpolated peak brightness position from the phase-referenced image as the best estimate of the central component’s position at yr, which was RA = and decl. = with small statistical uncertainties of as. A fit of an elliptical Gaussian to the image results in a position consistent with the one given above to within 20 as.
For a realistic estimate of the uncertainty on the position which includes systematic effects, we take the same conservative estimate of 120 as as we did in Paper II. We confirmed this estimate with a Monte-Carlo simulation based on the present data. The largest part of this uncertainty is due to the difficulty in separating the central component from the shell emission as well as due to noise, with a smaller part being due to the possible instability in the reference source and errors in the phase-referencing such as the troposphere or errors in the station positions (for estimates of the phase-referencing errors, see Pradel et al., 2006). We tabulate the position of the central component, expressed as offsets from our nominal explosion center position, in Table 1.
For our nominal explosion center position, we took the estimate of the explosion center location that we found in Paper II, which was RA = , decl. = , with an uncertainty of 200 as in each coordinate. This estimate is the position of the center of the shell, averaged over 5 epochs from 1999 to 2008, all determined with respect to 3C 66A. If the supernova is expanding symmetrically, this shell center position is identical to the explosion center. Only in two supernovae do we have observational constraints on the symmetry of the ejecta in the sky plane. In SN 1993J, in projection, the ejecta are circularly symmetric to within 5.5% about the explosion position (Bietenholz et al., 2001). In SN 1987A, there is a complicated structure, with mostly bilateral symmetry, but with one-sided asymmetry of at least 10% at some azimuth angles (Zanardo et al., 2013). For SN 1986J, the presence of two distinct blue-shifted components in the optical spectra also suggest an asymmetric structure (Milisavljevic et al., 2008).
In 2014, therefore, SN 1986J’s central component is as from the explosion center in RA and dec. respectively, with a combined uncertainty of 230 as in each coordinate. We regard this displacement as suggestive, but not conclusive.
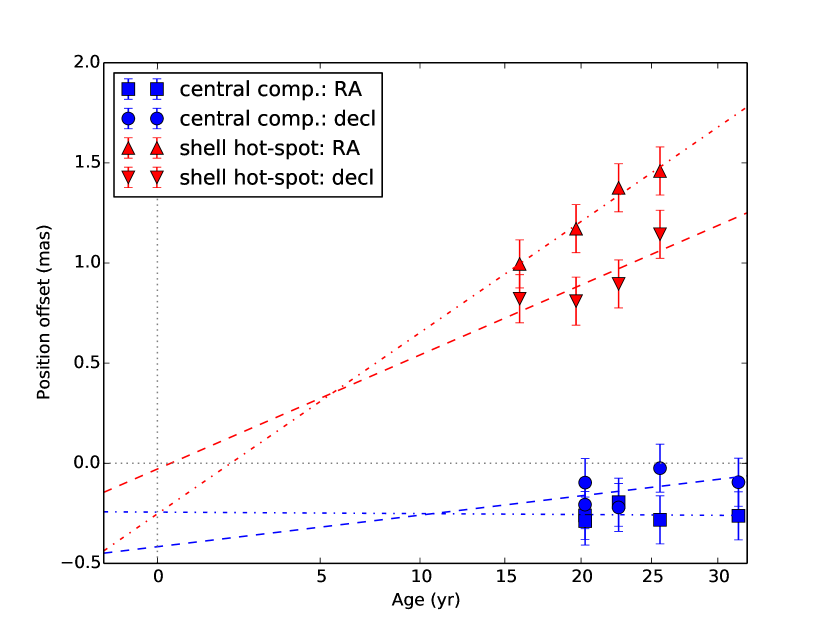
We can determine the proper motion of the central component by comparing the position in the present epoch with consistently-determined ones from 2005 and 2008 (Paper II), which are tabulated in Table 1. A linear regression gives a proper motion of and as yr-1 in RA and decl., respectively, corresponding to km s-1 at p.a. °. We plot the proper motion of the central component in Figure 4.
3.2.3 Size and Expansion Velocity
We also allowed the fitted model to be non point-like by allowing the widths and p.a. of the fitted elliptical Gaussian to be free in the fit. We obtained a fitted FWHM, deconvolved from the CLEAN beam, of as at p.a. 125°, a flux density of 707 Jy, and a fitted zero-level of 45 Jy beam-1. The rms residuals to this fit were 16 Jy beam-1, about 2.7 times larger than the off-source background rms. Unfortunately, the fitted deconvolved size is biased when it is near 0, since it cannot be less than 0. We performed a Monte-Carlo simulation ( trials), where we used model sources of known size and rms image-noise levels of 16 Jy beam-1 (equal to the rms residuals in our fit to the real image). This simulation showed us that there is a 4% chance that we would obtain a fitted major axis of 900 as when the source was in fact unresolved, resulting in final values for the fitted FWHM and p.a., along with the corresponding uncertainties, of as, at p.a. . In the NS direction, our resolution is poorer, and we can only say that the component’s perpendicular axis is as, therefore an approximately circular shape is compatible with our measurements. These FWHM values can be compared to our FWHM resolution, which was as at p.a. °. The residuals to the fit were, as mentioned, larger than the expected image noise. This is likely due to the shell emission in our fit being represented only by a constant offset, which is almost certainly an over-simplification. It could also be due to the central component being resolved and having a shape different from an elliptical Gaussian.
Our fitted value of as for the FWHM major axis of the central component suggests that the central component is somewhat resolved in an approximately SE-NW direction. Both the fitted FWHM width and p.a. are consistent with what can be seen in the higher resolution 22-GHz image in Paper II.
At 10 Mpc, the major axis FWHM corresponds to cm. The average expansion velocity, over the 31.6 yr, assuming the central component originated in the SN explosion, is then km s-1.
3.3. The Shell Hot-Spot
We first noted a bright hot-spot to the NE in the shell in Paper I, where we called it C1. In our current image, at yr (Fig. 1), the shell hot-spot is no longer clearly discernible, although there is still an enhancement of the brightness near the location where the shell hot-spot is expected. The shell hot-spot has been fading steadily since we first noted it. We give estimates of its 5-GHz flux density, or limits thereon in the last epoch, determined in the same way (§ 3.2.1) as were those of the central component (and which will similarly underestimate the true flux density if the shell hot-spot is in fact resolved). We plot the flux densities and limits in Figure 3.
We tabulate the shell hot-spot’s position, again expressed as offsets from our nominal explosion center position, in Table 1. The positions, like those of the central component (see § 3.2.2), were the quadratically interpolated peak brightness positions on the phase-referenced images). We plot the positions(along with those of the central component) in Figure 4. Since we cannot determine a position for the hot-spot in the present image, we have only the same set of positions that we already determined a proper motion from in Paper II. However, a new analysis (using a weighted fit) gives a consistent but slightly more accurate proper motion of as yr-1, corresponding to a projected velocity of km s-1, at p.a. °.
As we noted in Paper II, a decelerated motion like that seen for the shell, with , is also consistent with the measured positions and we show a fit of this form in Figure 4. The shell hot-spot therefore, has a radially outward proper motion consistent with the homologous expansion of the shell, with a projected speed about half that of the outer edge of the radio emission, consistent with its projected position about halfway between the average outer radius and the center. Such a proper motion would be expected if it were due to a dense condensation in the CSM.
We note that the p.a. of the shell hot-spot is approximately in the same direction as the elongation of the central component which is visible in our 2006 image at 22 GHz (Paper II). Furthermore there is a suggestion in some of the images in Fig. 2 of a possible enhancement on the SW side, opposite the shell hot-spot. We elaborate on this coincidence in the Discussion section (§ 4).
3.4. The Shell Size and Expansion Curve
In our earlier papers, we determined the outer radius of SN 1986J at each epoch, and determined the corresponding expansion curve. We found that the outer radius was expanding with time as (Paper II). Can we again estimate the angular radius reliably for our new observations to track the expansion curve?
In our earlier papers, we took as a representative value for the angular outer radius of SN 1986J the value , which is equal to of the contour which encompasses 90% of the total flux density. Since is somewhat dependent on the convolving beam size, we convolved our images with an approximately co-moving beam whose size increases so as to minimize the bias in the measured radius evolution.
We convolved our new, yr, image with the co-moving beam (FWHM: 3.91 mas mas at p.a. °), and found that the formal value of is now 3.97 mas. This value of would suggest that SN 1986J has shrunk over the last six years, down from = 4.23 mas at yr. The reason for the apparent decrease in size is that is no longer a good estimate of the extent of the shell. As can be seen in Figure 1, the extended shell emission is now only just visible, and the image is strongly dominated by the central component. Since the central component is at best marginally resolved, an increase in its brightness will cause to shrink. We attempted to compensate for the dominance of the central component by calculating from an image with an artificially limited brightness. This procedure indeed results in larger values of , but the exact value is dependent on the surface brightness cutoff used, and, as the cutoff is lowered, the level of the adjusted contour becomes comparable to the background rms, and the value of therefore unreliable.
We therefore can no longer determine the outer radius of SN 1986J due to the low signal-to-noise ratio of the shell emission. Our new VLBI image suggests stronger deceleration since 2008, but a continued powerlaw expansion with is also compatible with our VLBI image. There does however, seem to be an evolution of the radial distribution of the emission, with the emission near the outside edge having faded relative to that near the center in the last image.
4. Discussion
The general picture of radio emission in SNe (see, e.g., Chevalier, 1982; Chevalier & Fransson, 2016) is that it arises from the shocks formed as the cloud of ejecta interacts with the surrounding circumstellar material (CSM). In particular, a forward shock is driven into the CSM, a reverse shock is driven back into the expanding ejecta. The radio emission is thought to arise from shock-accelerated electrons and amplified magnetic field between these two shocks. Both shocks decelerate with time as the ejecta transfer part of their kinetic energy to the swept-up CSM. In the case of spherical symmetry and power-law density distributions, with the CSM density, and that of the ejecta, , a self-similar solution exists, and the shock radii are expected to evolve where (Fransson et al., 1996). In this picture, one expects radio emission from a spherical shell region. In such a region, the outer bound of the radio emission corresponds to the projected outer edge of the shell which is the forward shock. If the volume emissivity is uniform, the brightness distribution is highest at the projected inner radius of the shell, and has a minimum in the center. In the case of SN 1993J, indeed, a textbook shell structure is seen in the VLBI images (e.g., Bietenholz et al., 2003; Marcaide et al., 1995; Martí-Vidal et al., 2011)
In SN 1986J, the structure is not as clear, with the shell being somewhat distorted. If we equate the outer edge of the radio emission region with the forward shock555As we noted in Paper II, the angular radius of the forward shock is probably not identical to , our estimate of the outer edge of the radio emission, but we expect the two to be close, and moreover, since we used a convolving beam that scales with the expansion, for the ratio between and the shock radius to remain relatively constant as the SN expands., we could determine that up to yr (Paper II). The outer edge of the radio emission moved outwards between and 25.6 yr with an average speed of 7800 km s-1, and a speed at yr of 5400 km s-1. In the present, yr, image, the outer edge of the radio emission is poorly determined due to the low signal-to-noise ratio. Although continued expansion with is compatible with our measurements, it requires that the emission near the forward shock is fading. In other words, the locus of the brightest radio emission seems to have stopped expanding and may even be moving inward. The radio emission region, even aside from the emergence of the central component seems to be evolving in a non self-similar fashion. It is interesting to note that Dwarkadas & Gruszko (2012) found that also the observed X-ray emission of SN 1986J was hard to reconcile with a self-similar evolution since early times.
The central component is stationary to within our uncertainties of 570 km s-1, corresponding to % of the average expansion speed of the shell. It is marginally resolved, and has a radius (HWHM) of cm. If it had radius = 0 at the time of the explosion in 1983.2, its average expansion speed since then was km s-1, or % of that of the shell.
The motions of both the central component and the shell hot-spot, and the expansion of the more diffuse shell emission, are all therefore compatible with a homologous expansion with , originating from the geometrical center of the shell, which is coincident within the uncertainties with the position of the central component. However, the expansion does not in fact seem to be entirely homologous, since the emission near the outer edge seems to be fading relative to that nearer the center.
What is the nature of the central component? There are several hypotheses. We suggested in Paper II that it could be emission from the supernova shock running into a dense condensation in the CSM fortuitously near the center of the shell in projection. As mentioned in § 3.2.1, the brightness of the central component is at least brighter than the shell. This high and still increasing brightness, coupled with the central component’s stationarity, and its long lifetime argue against that hypothesis. It seems likely therefore that the central component really is in or near the three-dimensional center of SN 1986J.
In this case the central component may be due to the supernova shock interacting with a highly structured CSM produced by a binary companion (Chevalier 2012; Chevalier 2014; see also Barkov & Komissarov, 2011; Papish et al., 2015), where the shock travels much more slowly in the denser parts of the CSM near the binary orbit plane, thus producing a bright but compact radio emission region.
The central component could also be emission from a compact remnant of the supernova. If that remnant is a neutron star, the emission could be from a pulsar-wind nebula or perhaps from the neutron star’s accretion disc. If the remnant is a black hole, which quite possible given the probably massive progenitor (Weiler et al., 1990), then the central component could be emission from the black hole’s accretion disc. In this respect, the coincidence (mentioned in § 3.3) of the approximate alignment of the elongation of the central component with the NE hot spot and the possible SW enhancement becomes intriguing. Although inconclusive, it is suggestive of the action of a jet and counterjet, which has been suggested as an alternate to the delayed neutrino shock mechanism for core collapse SNe (e.g., Soker, 2010; Gilkis et al., 2016). We will discuss the nature of the central component in more detail in a forthcoming Paper IV on the evolution of the spectral energy distribution.
5. Summary and Conclusions
1. We obtained a new phase-referenced global-VLBI image of SN 1986J at 5 GHz, showing the continued evolution of this supernova in the radio. An animation is available in the electronic edition.
2. The 5-GHz VLBI image is now dominated by a marginally resolved central component. The ejecta shell is only barely visible. The peak brightness of the central component is 10 times higher than that of the shell.
3. The flux density of the central component is still increasing, both in absolute terms and as a fraction of the total. Since its first detection in 2003 ( yr), its 5-GHz flux density has increased by a factor of 4. Its current luminosity ( at 5 GHz) is times that of the Crab Nebula ( erg s-1).
4. The upper limit on the linearly polarized fraction of the image peak, which is the central component, was 3.3%
5. The emission from the shell is decreasing, and the brightness of the outer edge seems to have faded more than that nearer the center. The angular outer radius of the radio emission, identified with the location of the forward shock, is no longer well determined. Continued expansion with seen earlier is consistent with our new VLBI image, but it is also possible that the deceleration has increased.
6. In earlier observations, there was a prominent hot-spot to the NE in the shell. The shell hot-spot, which has almost faded from view in our present, yr, image, was moving outward with a projected speed of km s-1 at p.a. between and 25.6 yr. The shell hot spot’s motion is consistent with it taking part in a homologous expansion together with the shell, in other words, having an origin at the explosion center in 1983.2 and moving radially outward with .
7. The central component seems to be marginally resolved in our observations. We found its FWHM angular diameter at yr to be as, corresponding to cm. If it has expanded since the explosion in 1983.2, then the average projected speed of expansion was km s-1, or 9% the speed of the outer edge of the shell.
8. The central component has a proper motion corresponding to a projected speed of km s-1 between yr and 31.6 yr (2003 and 2014), consistent with being stationary. Its position is consistent within the uncertainties of the explosion position that we estimated earlier.
9. The latest observations argue in favor of the central component being located at or near the three-dimensional center of SN 1986J, rather then being associated with the expanding shell and being central only in projection.
Acknowledgments
We thank N. Soker for comments on the manuscript. The European VLBI Network is a joint facility of European and Chinese radio astronomy institutes funded by their national research councils. This research was supported by both the National Sciences and Engineering Research Council of Canada and the National Research Foundation of South Africa. We have made use of the NASA/IPAC Extragalactic Database (NED) which is operated by the Jet Propulsion Laboratory, California Institute of Technology, under contract with the National Aeronautics and Space Administration (NASA), as well as NASA’s Astrophysics Data System Abstract Service.
References
- Barkov & Komissarov (2011) Barkov, M. V., & Komissarov, S. S. 2011, MNRAS, 415, 944
- Bartel & Bietenholz (2008) Bartel, N., & Bietenholz, M. F. 2008, ApJ, 682, 1065
- Bartel & Bietenholz (2014) Bartel, N., & Bietenholz, M. F. 2014, in IAU Symposium, Vol. 296, IAU Symposium, ed. A. Ray & R. A. McCray, 53–57
- Bartel et al. (1991) Bartel, N., Rupen, M. P., Shapiro, I. I., Preston, R. A., & Rius, A. 1991, Nature, 350, 212
- Bartel et al. (1987) Bartel, N., Ratner, M. I., Rogers, A. E. E., et al. 1987, ApJ, 323, 505
- Bietenholz (2014) Bietenholz, M. 2014, in 12th European VLBI Network Symposium and Users Meeting (2014), published by SISSA, Trieste, ed. A. Tarchi, M. Giroletti, & L. Feretti, 51
- Bietenholz et al. (2010a) Bietenholz, M. F., Bartel, N., Milisavljevic, D., et al. 2010a, MNRAS, 409, 1594
- Bietenholz et al. (2001) Bietenholz, M. F., Bartel, N., & Rupen, M. P. 2001, ApJ, 557, 770
- Bietenholz et al. (2002) —. 2002, ApJ, 581, 1132, (Paper I)
- Bietenholz et al. (2003) —. 2003, ApJ, 597, 374
- Bietenholz et al. (2004) —. 2004, Science, 304, 1947
- Bietenholz et al. (2010b) —. 2010b, ApJ, 712, 1057, (Paper II)
- Chevalier (1982) Chevalier, R. A. 1982, ApJ, 259, 302
- Chevalier (1987) —. 1987, Nature, 329, 611
- Chevalier (2012) —. 2012, ApJ, 752, L2
- Chevalier (2014) Chevalier, R. A. 2014, in IAU Symposium, Vol. 296, Supernova Environmental Impacts, ed. A. Ray & R. A. McCray, 95–102
- Chevalier & Fransson (2016) Chevalier, R. A., & Fransson, C. 2016, ArXiv e-prints, arXiv:1612.07459
- Cornwell et al. (1999) Cornwell, T., Braun, R., & Briggs, D. S. 1999, in Astronomical Society of the Pacific Conference Series, Vol. 180, Synthesis Imaging in Radio Astronomy II, ed. G. B. Taylor, C. L. Carilli, & R. A. Perley, 151
- Cornwell (2008) Cornwell, T. J. 2008, IEEE Journal of Selected Topics in Signal Processing, 2, 793
- Deller et al. (2011) Deller, A. T., Brisken, W. F., Phillips, C. J., et al. 2011, PASP, 123, 275
- Dwarkadas & Gruszko (2012) Dwarkadas, V. V., & Gruszko, J. 2012, MNRAS, 419, 1515
- Fey et al. (2009) Fey, A. L., Gordon, D., & Jacobs, C. S., eds. 2009, IERS Technical Note, Vol. 35, The Second Realization of the International Celestial Reference Frame by Very Long Baseline Interferometry (Frankfurt: Verlag des Bundesamts für Kartographie und Geodäsie), 1
- Fransson et al. (1996) Fransson, C., Lundqvist, P., & Chevalier, R. A. 1996, ApJ, 461, 993
- Gilkis et al. (2016) Gilkis, A., Soker, N., & Papish, O. 2016, ApJ, 826, 178
- Greisen et al. (2009) Greisen, E. W., Spekkens, K., & van Moorsel, G. A. 2009, AJ, 137, 4718
- Hunter et al. (2012) Hunter, D. A., Ficut-Vicas, D., Ashley, T., et al. 2012, AJ, 144, 134
- Ma et al. (1998) Ma, C., Arias, E. F., Eubanks, T. M., et al. 1998, AJ, 116, 516
- Marcaide et al. (2009) Marcaide, J. M., Martí-Vidal, I., Perez-Torres, M. A., et al. 2009, A&A, 503, 869
- Marcaide et al. (1995) Marcaide, J. M., Alberdi, A., Ros, E., et al. 1995, Nature, 373, 44
- Martí-Vidal et al. (2011) Martí-Vidal, I., Marcaide, J. M., Alberdi, A., et al. 2011, A&A, 526, A142
- Milisavljevic & Fesen (2017) Milisavljevic, D., & Fesen, R. A. 2017, ArXiv e-prints, arXiv:1701.00891
- Milisavljevic et al. (2008) Milisavljevic, D., Fesen, R. A., Leibundgut, B., & Kirshner, R. P. 2008, ApJ, 684, 1170
- Papish et al. (2015) Papish, O., Soker, N., & Bukay, I. 2015, MNRAS, 449, 288
- Pradel et al. (2006) Pradel, N., Charlot, P., & Lestrade, J.-F. 2006, A&A, 452, 1099
- Rich et al. (2008) Rich, J. W., de Blok, W. J. G., Cornwell, T. J., et al. 2008, AJ, 136, 2897
- Rupen et al. (1987) Rupen, M. P., van Gorkom, J. H., Knapp, G. R., Gunn, J. E., & Schneider, D. P. 1987, AJ, 94, 61
- Soker (2010) Soker, N. 2010, MNRAS, 401, 2793
- van Gorkom et al. (1986) van Gorkom, J., Rupen, M., Knapp, G., et al. 1986, IAU Circ., 4248, 1
- Wakker & Schwarz (1988) Wakker, B. P., & Schwarz, U. J. 1988, A&A, 200, 312
- Weiler et al. (1990) Weiler, K. W., Panagia, N., & Sramek, R. A. 1990, ApJ, 364, 611
- Zanardo et al. (2013) Zanardo, G., Staveley-Smith, L., Ng, C.-Y., et al. 2013, ApJ, 767, 98
- Zanardo et al. (2014) Zanardo, G., Staveley-Smith, L., Indebetouw, R., et al. 2014, ApJ, 796, 82