The Diffuse Radiation Field at High Galactic Latitudes
Abstract
We have used GALEX observations of the North and South Galactic poles to study the diffuse ultraviolet background at locations where the Galactic light is expected to be at a minimum. We find offsets of 230 – 290 photon units in the FUV (1531 Å) and 480 – 580 photon units in the NUV (2361 Å). Of this, approximately 120 photon units can be ascribed to dust scattered light and another 110 (190 in the NUV) photon units to extragalactic radiation. The remaining radiation is, as yet, unidentified and amounts to 120 – 180 photon units in the FUV and 300 – 400 photon units in the NUV. We find that molecular hydrogen fluorescence contributes to the FUV when the 100 µm surface brightness is greater than 1.08 MJy sr-1.
1 Introduction
The diffuse radiation at high latitudes is, by definition, a combination of the diffuse Galactic light (DGL) and the extragalactic background light (EBL). The largest component of the DGL at low latitudes is the light from Galactic plane stars scattered by interstellar dust (Jura, 1979) but this will be at a minimum at the poles where there is little dust. Thus much of the diffuse light at the poles might be expected to be from the EBL (Bowyer, 1991; Henry, 1991). As a result, there were many observations of the cosmic ultraviolet background at the pole and we have listed them in Table 1. The typical surface brightness was 200 – 300 ph cm-2 s-1 sr-1 Å-1 (hereafter photon units) in the far ultraviolet (FUV: 1300 – 1800 Å) and 300 – 600 photon units in the near ultraviolet (NUV: 1800 – 3200 Å).
The EBL is comprised of several parts with the most significant being the integrated light of galaxies which Driver et al. (2016) found to be 60 – 81 photon units (FUV) and 121 – 181 photon units (NUV). These values are model-dependent but differ by no more than about 20 photon units (Xu et al., 2005; Voyer et al., 2011; Gardner et al., 2000). There may be smaller contributions from the integrated light of QSOs (16 – 30 photon units: Madau (1992)) and the IGM (< 20 photon units: Martin et al. (1991)) for a total EBL of 96 – 131 photon units in the FUV and 157 – 231 photon units in the NUV. Phenomenological models of the cosmic spectral energy distribution are increasingly consistent with observational data and semi-analytic models, except in the ultraviolet, where they differ by as much as 100 photon units (Andrews et al., 2018, Fig. 9). A good review of the current state of uncertainty in ultraviolet EBL intensity may be found in Hill et al. (2018, Fig. 5).
Henry et al. (2015) has argued strongly that there is an additional component to the DGL, unrelated to dust-scattered starlight. Much of the evidence for this component comes from GALEX observations of the Galactic poles in the FUV from Murthy et al. (2010). We have used an improved reduction of the diffuse background (Murthy, 2014a) with a Monte Carlo model for the dust scattered light (Murthy, 2016) to further explore the background in the vicinity of both Galactic poles in the far-ultraviolet (FUV: 1531 Å) and the near-ultraviolet (NUV: 2361 Å).
| References | Wavelength | Offset |
|---|---|---|
| (Å) | (photon units) | |
| Anderson et al. (1979) | 1230 – 1680 | 285 32 |
| Paresce et al. (1979) | 1350 – 1550 | 300 60 |
| Paresce et al. (1980) | 1350 – 1550 | <300 |
| Joubert et al. (1983) | 1690 | 300 – 690 |
| 2200 | 160 – 360 | |
| Jakobsen et al. (1984) | 1590 | <550 |
| 1710 | <900 | |
| 2135 | <1300 | |
| Tennyson et al. (1988) | 1800 – 1900 | 300 100 |
| 1900 – 2800 | 400 200 | |
| Onaka & Kodaira (1991) | 1500 | 200 – 300 |
| Feldman et al. (1981) | 1200 – 1670 | 150 50 |
| Henry & Murthy (1993) | 1500 | 300 100 |
| Murthy & Henry (1995) | 1250 – 2000 | 100 – 400 |
| Hamden et al. (2013) | 1344 – 1786 | 300 |
| Boissier et al. (2015) | 1528 | 315 |
| Murthy (2016) | 1531 | 300 |
| 2361 | 600 |
2 Data
The GALEX mission (Martin et al., 2005; Morrissey et al., 2007) took observations covering most of the sky in the FUV and NUV bands. An observation consisted of one or more visits with exposure times of 100 – 1000 seconds each which could be added together to reach total integration times of as high as 100,000 seconds. The original data from the mission were distributed as FITS (Flexible Image Transport System) files with a pixel size of . Murthy (2014a) masked out the stars, rebinned to pixels and subtracted the foreground emission (Murthy, 2014b) to produce a map of the diffuse background over the sky. We have used the visit-level data from Murthy (2014a), available from the High Level Science Products (HLSP) data repository111https://archive.stsci.edu/prepds/uv-bkgd/ at the Space Telescope Science Institute, to study the diffuse emission at the Galactic poles.
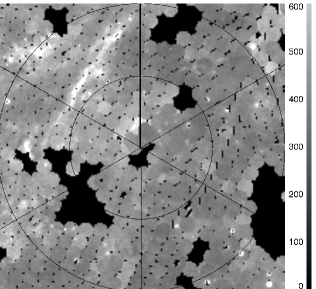
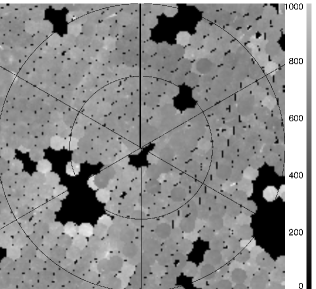
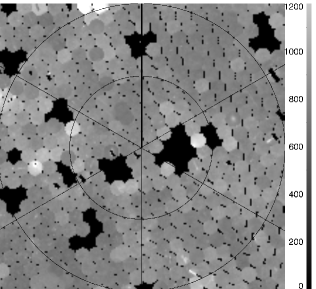
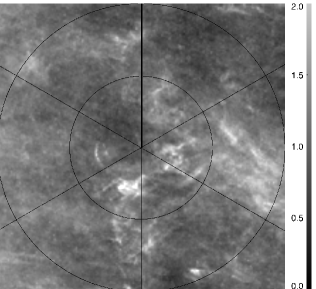
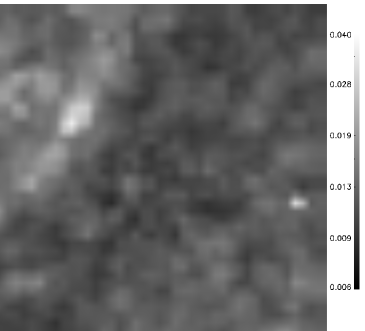
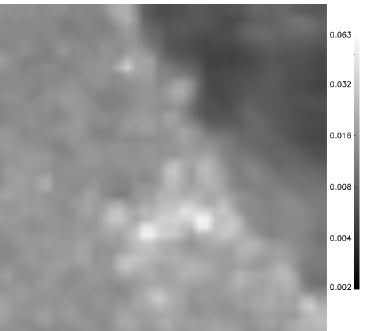
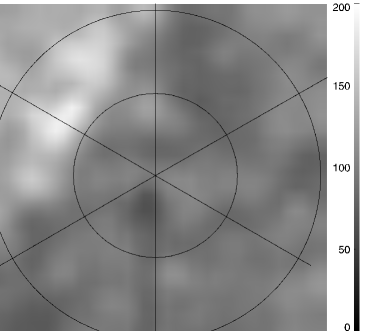
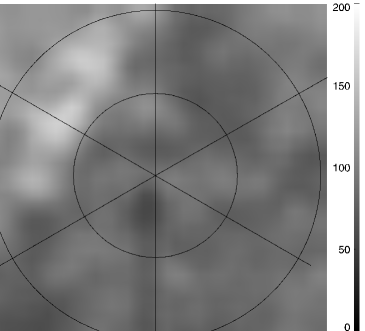
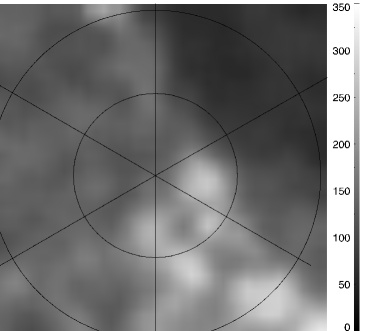
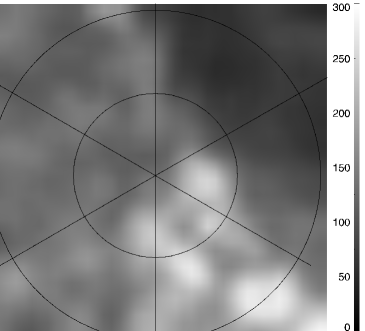
We further rebinned the original bins of Murthy (2014a) by a factor of 3 (into bins) to improve the signal-to-noise and the resultant maps are shown for the North Galactic pole (NGP) in Fig. 1 and the South Galactic pole (SGP) in Fig. 2 along with the 100 µm maps from Schlegel et al. (1998), also rebinned to pixels. Although one might expect a good correlation between the FUV and the NUV and between both UV bands and the IR (Hamden et al., 2013; Murthy, 2014a), there is much less structure in the NUV image than in the 100 µm images or, indeed, in the FUV.
Given that these are archival data, the number of visits and the exposure times per field fluctuate wildly but with most of the field observed in multiple visits. The deepest observation was the Subaru Deep Field (Kashikawa et al., 2004), which was targeted by GALEX (Ly et al., 2009) as part of the overall saturation coverage of that region by a number of different observatories. There were a total of 99 different visits in the FUV and 169 in the NUV with exposure times from 80 – 1700 seconds for each visit. The cumulative exposure times over the three years from Apr. 2004 to May 2007 is 83,031 seconds in the FUV and 164,369 seconds in the NUV.

The primary source of uncertainty in the derived astrophysical background is the foreground emission (airglow in both bands and zodiacal light in the NUV), which is comparable to the astrophysical emission at high Galactic latitudes. We have tested the foreground subtraction by tracking the background surface brightness of a single bin over all the visits in the Subaru field (Fig. 3). There are variations in both bands which, despite the missing FUV observations, are obviously correlated (r = 0.9). These are manifested as an increase in the overall background level of the image which we believe are due to changes in the radiation environment around the spacecraft but could not find any obvious trigger, either terrestrial or solar. The mean value of the background over all the visits in a pixel is photon units in the FUV and photon units in the NUV and we have adopted these uncertainties in our analysis.
We took the individual visits and added them into polar grids (Fig. 1 and 2), weighting each visit by its exposure time. Most of the field was covered by multiple visits and we assumed that the diffuse surface brightness in a given field was comprised of a constant DGL + EBL with any difference between visits being due to the uncharacterized foreground discussed above. We subtracted this difference from each visit, effectively setting the median level of the diffuse surface brightness to the minimum over all visits.
There is a bright point in the top of the NUV image of the SGP (Fig. 2) due to nebulosity around the fifth magnitude star HD 224990 (B3V). We have not included those points in our analysis. Bright points in the FUV images are due to artifacts around hot stars and are not used in the analysis.
3 Results
3.1 UV-IR Correlations
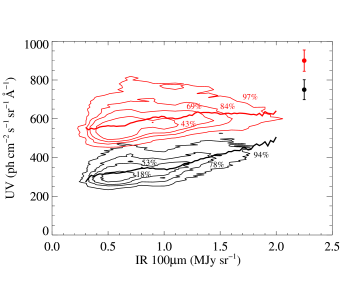
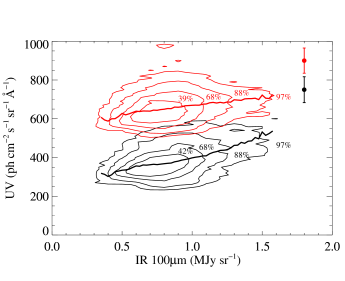
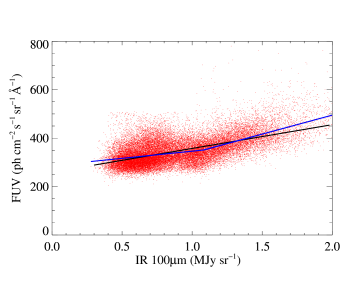
Both the UV and the 100 µm surface brightness track the presence of dust and should be linearly correlated at high Galactic latitudes where the optical depth is low. We have plotted the observed correlations in Fig. 4 and tabulated them in Table 2. The UV does indeed correlate with the IR but not as well as one might expect, as is apparent from a visual comparison of the images in Fig. 1 and 2. The bright IR features such as Markkanen’s Cloud (Markkanen, 1979) are readily seen in the FUV at both poles but are not prominent in the NUV.
| Bands | pa | ab | bc | |
| NGP | ||||
| FUV – IRAS | 0.54 | 97.58 | 259.80 | 1.26 |
| NUV – IRAS | 0.42 | 68 | 530.89 | 1.18 |
| FUV – E(B-V) | 0.52 | 4245.40 | 250.11 | 1.24 |
| NUV – E(B-V) | 0.40 | 2655.67 | 531.06 | 1.21 |
| SGP | ||||
| FUV – IRAS | 0.42 | 164.17 | 240.99 | 2.29 |
| NUV – IRAS | 0.28 | 90.30 | 579.07 | 1.48 |
| FUV – E(B-V) | 0.45 | 7967.55 | 211.85 | 2.18 |
| NUV – E(B-V) | 0.29 | 4260.72 | 565.69 | 1.47 |
| NGP (With inflection point) | ||||
| FUV – IRAS (< 1.08 MJy sr-1) | 0.27 | 57.43 | 288.27 | 1.15 |
| FUV – IRAS (> 1.08 MJy sr-1) | 0.57 | 156.33 | 182.10 | 1.37 |
| aSpearman’s correlation coefficient (P 0.05 for all the cases). | ||||
| bScale factor | ||||
| cOffset (photon units) | ||||
We noted an inflection point in the FUV/IR ratio in the NGP at an IR surface brightness of 1.08 MJy sr-1 (Fig. 5). We performed an F-Test (Bevington & Robinson, 2003) to investigate whether the additional term was justified and found an F-value of 1325 which is significant at greater than a 99.9% level. Matsuoka et al. (2011), perhaps coincidentally, found a similar inflection point at a 100 µm surface brightness of 0.8 MJy sr-1 in Pioneer optical data, which they identified with the cosmic infrared background (CIB: Lagache et al. (2000)). In this scenario, both the CIB and the UV offset would represent that part of the background which is not correlated with interstellar dust. However, we would then expect a similar inflection point in the FUV data at the SGP or in the NUV at either pole which is not seen.
Another possibility is that the change in slope is due to molecular hydrogen (H2) fluorescence (Hurwitz, 1998) in the Werner bands kicking in at a 100 µm surface brightness of 1.08 MJy sr-1 (logNH = 20.2). Canonically, H2 is only formed at column densities greater than logNH = 20.5 – 20.7 (Knapp, 1974; Savage et al., 1977; Franco & Cox, 1986; Reach et al., 1994), when self-absorption protects the molecules from dissociation by ultraviolet photons. Jo et al. (2017) have found that the fraction of the total diffuse radiation in the form of fluorescent Werner band emission from molecular hydrogen is 5-10% of the total observed surface brightness at the poles, or about 30 photon units. These observations were averaged over 10 – 15 degrees at the poles and we find that the putative Werner band emission in the GALEX data is about 60 photon units, not too far off from their observations. Gillmon et al. (2006) and Wakker (2006) have found significant molecular gas at high latitudes at column densities of 20.2 < logNH < 20.5, which Gillmon et al. (2006) attributed to a clumpy medium with the molecular gas concentrated in high density cirrus clouds. Unfortunately, we do not have the spectroscopic information needed to further investigate the emission and cannot further constrain the source of the rise in the FUV.
3.2 Zero-Points
| Component | FUVa | NUVa |
|---|---|---|
| NGP | ||
| Observed | 288 2 | 531 2 |
| EGL | 114 18 | 194 37 |
| Remainder | 174 18 | 337 37 |
| SGP | ||
| Observed | 241 2 | 579 3 |
| EGL | 114 18 | 194 37 |
| Remainder | 127 18 | 385 37 |
| a photon units | ||
The diffuse radiation at the poles is likely to be dominated by the EBL and the observed baseline will therefore place an upper limit on the EBL. The y intercepts for the FUV are 288 photon units in the NGP and 241 photon units in the SGP with the corresponding values for the NUV being 531 and 579 photon units in the NGP and SGP, respectively. Taken at face value, these are upper limits for the EBL and match well with earlier determinations of the background at the poles (Table 1), including with GALEX results from Hamden et al. (2013), Boissier et al. (2015), and Murthy (2016). As an independent check, we have calculated the slopes and offsets using the E(B - V) from Planck Collaboration et al. (2014) finding very similar offsets (Table 2). However, as discussed in the Introduction, the expected limits on the EBL are 96 – 131 photon units in the FUV and 157 – 231 photon units the NUV, or about half the observed value in the FUV and about one third in the NUV. This offset has been noted before (Table 1) but with no definite identification (Henry et al., 2015).
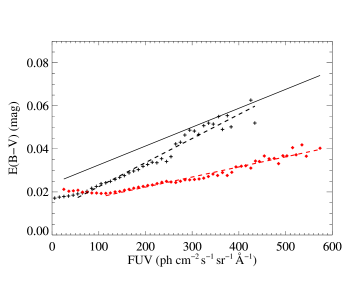
3.3 Correlation with E(B - V)
Much of the GALEX Ultraviolet Virgo Cluster Survey (GUVICS: Boissier et al. (2015)) falls within our area and our extracted diffuse values are in excellent agreement in the areas of overlap, despite independent approaches to the extraction of the diffuse radiation from the GALEX observations. Boissier et al. (2015) subtracted what they termed as “any emission not related to the cirrus” from the EBL and from unknown Galactic sources, possibly including “a very diffuse cirrus contribution” and then derived a linear relationship between the FUV (in photon units) and the reddening of E(B - V) = , where 315 photon units was their offset. They suggested that the diffuse UV background could be used to calculate the E(B - V) at a higher spatial resolution and precision than either the IRAS data (Schlegel et al., 1998) or the Planck data (Planck Collaboration et al., 2014). This method does indeed show promise and we have attempted the same with our data over both poles (Fig. 6) using Planck reddening. We found relations of E(B - V) = over the much larger area we observe in the NGP and E(B - V) = in the SGP. As Boissier et al. (2015) point out, the FUV emission is dependent on the geometry of the stars and the dust and care has to be taken when using the GALEX data to predict extinction over the sky.
4 Modeling Milky Way Radiation
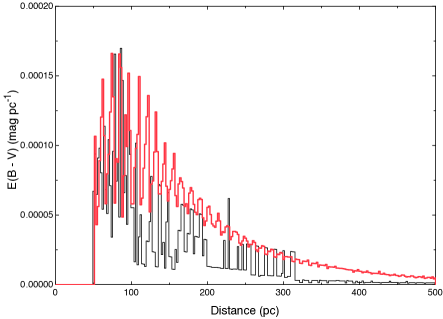
Most of the DGL at low Galactic latitudes is unequivocally due to the scattering of the light of hot stars from interstellar dust and we have applied the model developed by Murthy (2016) to predict the amount of Galactic dust-scattered radiation in the polar regions. This model uses a Monte Carlo process to track photons emitted from stars with location and spectral type from the Hipparcos catalog (Perryman et al., 1997) and stellar spectra from Castelli & Kurucz (2004). The dust was taken from the 3-dimensional extinction map derived from PanSTARRS data by Green et al. (2015) with an angular resolution of about at the poles. The gaps in the Green et al. (2015) map were filled using the reddening map given by Schlegel et al. (1998) with a scale height of 125 pc (Marshall et al., 2006). Our modeled dust distribution is shown in Fig. 7 for both poles and is similar to the IR maps shown in Fig. 1 and Fig. 2, respectively. The distribution of the extinction with distance (along a specific line of sight) is shown in Fig. 8 and is consistent with a scale height of 125 pc (Marshall et al., 2006) and a cavity of about 50 pc radius around the Sun (Welsh et al., 2010). We assumed the scattering function of Henyey & Greenstein (1941) with the albedo (a) and phase function asymmetry factor () as free parameters.
The dust at both poles has been extensively investigated through polarization measurements (Markkanen, 1979; Berdyugin et al., 1995; Berdyugin & Teerikorpi, 1997; Berdyugin et al., 2000, 2001; Berdyugin & Teerikorpi, 2002, 2016; Berdyugin et al., 2004, 2011, 2014). The polarization in the NGP was divided into two regions: Area I and Area II (Markkanen, 1979), approximately corresponding to with the 100 µm surface brightness and the polarization being larger in Area II. The overall extinction in both poles is low with minimum values close to zero (Fong et al., 1987; McFadzean et al., 1983), except for limited areas where clouds are seen in the IR maps with peak values of E(B - V) from 0.02 – 0.04 (Berdyugin et al., 2011). Berdyugin et al. (2014) found that the polarization was correlated with the IR maps with the caveat that the polarization maps probed the dust to a distance of about 400 pc while the IR emission measured the dust along the entire line of sight. Berdyugin & Teerikorpi (2016) note that there may be some dusty structures extending to high positive latitudes within Area I, as suggested by the distribution of dark and molecular clouds, in addition to the diffuse dust. In general, we find that our dust model is in agreement with the polarization observations.


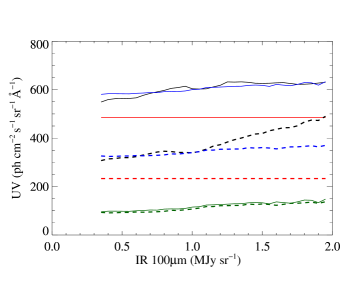
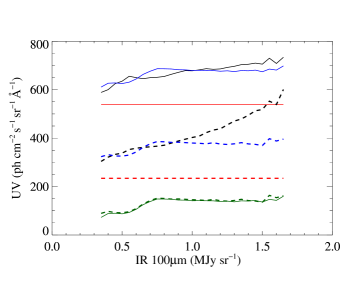
We have run our scattering model for a range of optical constants with representative results shown in Fig. 9 and 10. The major dust features are clearly visible in the models but the brightness is much less than that observed unless the grains scatter isotropically (Fig. 11). Because most of the photons at the poles come from Galactic plane stars (Jura, 1979), the earliest papers did indeed find that . It is now generally accepted (Draine, 2003) that the optical constants are close to in the FUV and in the NUV and we have used those models to fit the observed emission at each pole. There is too much noise in both the models and the data to compare on a pixel-by-pixel level and we have rather integrated both as a function of the 100 µm values from Schlegel et al. (1998) in Figures 12 and 13.
The fit is good in both poles and both bands with best-fit offsets of 233 and 234 photon units in the FUV in the NGP and SGP, respectively and offsets of 485 and 538 photon units in the NUV in the NGP and SGP, respectively. These are not far different from the zero-point offsets in Table 3. We had previously noted the inflection point in the FUV-IR correlation at 1.08 MJy sr-1 in the NGP; a comparison with the models shows that it is present in both poles in the FUV. As discussed above, this may be due to fluorescence from the Werner bands of molecular hydrogen.
5 Light from dark matter?
The continued presence of this unexplained excess in the diffuse background prompts us to briefly consider possible connections to nonstandard physics. Leading particle dark-matter candidates such as supersymmetric WIMPs or axions produce photons by annihilation or decay, but not at UV energies (Henry et al., 2015). Another possibility is offered by primordial black holes (PBHs), which emit Hawking radiation with an approximately blackbody spectrum peaking at the characteristic energy for PBHs of mass . Thus a background with eV (midway between our FUV and NUV energies) might be associated with PBHs of characteristic mass g. This value coincides with one of three narrow remaining theoretically allowed PBH mass windows (Carr et al., 2016), a so far unremarked coincidence that we find intriguing enough to explore briefly here. A plausible production mechanism for PBHs with masses close to this range has been identified by Espinosa et al. (2018). The question is whether PBHs of this kind could contribute significantly to the unexplained excess identified above, whose bolometric intensity erg s-1 cm-2 with 180 photon units at Å.
PBH luminosity is very low, erg s-1 (Overduin & Wesson, 2008). If these PBHs make up the cold dark matter in the halo of the Milky Way, then their local density pc-3 (Bovy & Tremaine, 2012). If they are distributed uniformly, then the nearest one is located at a distance 100 AU. Its intensity erg s-1 cm-2 as seen by us is far too low to account for . Alternatively, the total number of PBHs in the halo is where (Xue et al., 2008). If these are clustered near the Galactic center at kpc, then the halo intensity erg s-1 cm-2. This is still 15 orders of magnitude too small. More realistically, if the PBH halo extends beyond the Sun and can be regarded as approximately uniform in the solar vicinity, then erg s-1 cm-2 where luminosity density erg s-1 cm-3. This still falls short of by 12 orders of magnitude, a discrepancy that cannot plausibly be attributed to non-uniformity in the PBH distribution. We infer that PBHs are not likely to contribute significantly to the astrophysical background, a conclusion reinforced by others (Frampton, 2016). The failure of this explanation, of course, only deepens the mystery.
6 Conclusions
We have used GALEX data to study the diffuse ultraviolet background at both the North and South Galactic poles with two primary results:
-
1.
There is an excess emission (over the DGL and the EBL) of 120 – 180 photon units in the FUV and 300 – 400 photon units in the NUV. Offsets in the UV emission have always been observed at the poles (Table 1) but it has not been apparent how to attribute it to the different contributors. Although we do not know its origin, we can affirm that the excess emission cannot be accounted for by current models of the DGL and EBL.
- 2.
We believe that the study of the Galactic poles will prove to be fruitful in differentiating between the Galactic and extragalactic (and terrestrial) components. Deep spectroscopy of the poles, including of cirrus features, would have been invaluable in separating the components but that seems unlikely in the near future with a dearth of UV missions expected. In its absence, we will continue our in-depth study of diffuse emission with GALEX.
References
- Anderson et al. (1979) Anderson, R. C., Henry, R. C., Brune, W. H., Feldman, P. D., & Fastie, W. G. 1979, ApJ, 234, 415
- Andrews et al. (2018) Andrews, S. K., Driver, S. P., Davies, L. J. M., Lagos, C. d. P., & Robotham, A. S. G. 2018, MNRAS, 474, 898
- Berdyugin et al. (2004) Berdyugin, A., Piirola, V., & Teerikorpi, P. 2004, A&A, 424, 873
- Berdyugin et al. (2011) Berdyugin, A., Piirola, V., & Teerikorpi, P. 2011, in Astronomical Society of the Pacific Conference Series, Vol. 449, Astronomical Polarimetry 2008: Science from Small to Large Telescopes, ed. P. Bastien, N. Manset, D. P. Clemens, & N. St-Louis, 157
- Berdyugin et al. (2014) —. 2014, A&A, 561, A24
- Berdyugin et al. (1995) Berdyugin, A., Snare, M.-O., & Teerikorpi, P. 1995, A&A, 294, 568
- Berdyugin & Teerikorpi (1997) Berdyugin, A., & Teerikorpi, P. 1997, A&A, 318, 37
- Berdyugin & Teerikorpi (2002) —. 2002, A&A, 384, 1050
- Berdyugin & Teerikorpi (2016) —. 2016, A&A, 587, A79
- Berdyugin et al. (2000) Berdyugin, A., Teerikorpi, P., & Haikala, L. 2000, A&A, 358, 717
- Berdyugin et al. (2001) Berdyugin, A., Teerikorpi, P., Haikala, L., et al. 2001, A&A, 372, 276
- Bevington & Robinson (2003) Bevington, P. R., & Robinson, D. K. 2003, Data Reduction and Error Analysis for the Physical Sciences (Boston, MA: McGraw-Hill)
- Boissier et al. (2015) Boissier, S., Boselli, A., Voyer, E., et al. 2015, A&A, 579, A29
- Bovy & Tremaine (2012) Bovy, J., & Tremaine, S. 2012, ApJ, 756, 89
- Bowyer (1991) Bowyer, S. 1991, ARA&A, 29, 59
- Carr et al. (2016) Carr, B., Kühnel, F., & Sandstad, M. 2016, Phys. Rev. D, 94, 083504
- Castelli & Kurucz (2004) Castelli, F., & Kurucz, R. L. 2004, ArXiv Astrophysics e-prints, astro-ph/0405087
- Draine (2003) Draine, B. T. 2003, ARA&A, 41, 241
- Driver et al. (2016) Driver, S. P., Andrews, S. K., Davies, L. J., et al. 2016, ApJ, 827, 108
- Espinosa et al. (2018) Espinosa, J. R., Racco, D., & Riotto, A. 2018, Phys. Rev. Lett., 120, 121301
- Feldman et al. (1981) Feldman, P. D., Brune, W. H., & Henry, R. C. 1981, ApJ, 249, L51
- Fong et al. (1987) Fong, R., Jones, L. R., Shanks, T., Stevenson, P. R. F., & Strong, A. W. 1987, MNRAS, 224, 1059
- Frampton (2016) Frampton, P. H. 2016, Modern Physics Letters A, 31, 1650093
- Franco & Cox (1986) Franco, J., & Cox, D. P. 1986, PASP, 98, 1076
- Gardner et al. (2000) Gardner, J. P., Brown, T. M., & Ferguson, H. C. 2000, ApJ, 542, L79
- Gillmon et al. (2006) Gillmon, K., Shull, J. M., Tumlinson, J., & Danforth, C. 2006, ApJ, 636, 891
- Green et al. (2015) Green, G. M., Schlafly, E. F., Finkbeiner, D. P., et al. 2015, ApJ, 810, 25
- Hamden et al. (2013) Hamden, E. T., Schiminovich, D., & Seibert, M. 2013, ApJ, 779, 180
- Henry (1991) Henry, R. C. 1991, ARA&A, 29, 89
- Henry & Murthy (1993) Henry, R. C., & Murthy, J. 1993, ApJ, 418, L17
- Henry et al. (2015) Henry, R. C., Murthy, J., Overduin, J., & Tyler, J. 2015, ApJ, 798, 14
- Henyey & Greenstein (1941) Henyey, L. G., & Greenstein, J. L. 1941, ApJ, 93, 70
- Hill et al. (2018) Hill, R., Masui, K. W., & Scott, D. 2018, ArXiv e-prints, arXiv:1802.03694
- Hurwitz (1998) Hurwitz, M. 1998, ApJ, 500, L67
- Jakobsen et al. (1984) Jakobsen, P., Bowyer, S., Kimble, R., et al. 1984, A&A, 139, 481
- Jo et al. (2017) Jo, Y.-S., Seon, K.-I., Min, K.-W., Edelstein, J., & Han, W. 2017, ApJS, 231, 21
- Joubert et al. (1983) Joubert, M., Deharveng, J. M., Cruvellier, P., Masnou, J. L., & Lequeux, J. 1983, A&A, 128, 114
- Jura (1979) Jura, M. 1979, ApJ, 227, 798
- Kashikawa et al. (2004) Kashikawa, N., Shimasaku, K., Yasuda, N., et al. 2004, PASJ, 56, 1011
- Knapp (1974) Knapp, G. R. 1974, AJ, 79, 527
- Lagache et al. (2000) Lagache, G., Haffner, L. M., Reynolds, R. J., & Tufte, S. L. 2000, A&A, 354, 247
- Ly et al. (2009) Ly, C., Malkan, M. A., Treu, T., et al. 2009, ApJ, 697, 1410
- Madau (1992) Madau, P. 1992, ApJ, 389, L1
- Markkanen (1979) Markkanen, T. 1979, A&A, 74, 201
- Marshall et al. (2006) Marshall, D. J., Robin, A. C., Reylé, C., Schultheis, M., & Picaud, S. 2006, A&A, 453, 635
- Martin et al. (1991) Martin, C., Hurwitz, M., & Bowyer, S. 1991, ApJ, 379, 549
- Martin et al. (2005) Martin, D. C., Fanson, J., Schiminovich, D., et al. 2005, ApJ, 619, L1
- Matsuoka et al. (2011) Matsuoka, Y., Ienaka, N., Kawara, K., & Oyabu, S. 2011, ApJ, 736, 119
- McFadzean et al. (1983) McFadzean, A. D., Hilditch, R. W., & Hill, G. 1983, MNRAS, 205, 525
- Morrissey et al. (2007) Morrissey, P., Conrow, T., Barlow, T. A., et al. 2007, ApJS, 173, 682
- Murthy (2014a) Murthy, J. 2014a, ApJS, 213, 32
- Murthy (2014b) —. 2014b, Ap&SS, 349, 165
- Murthy (2016) —. 2016, MNRAS, 459, 1710
- Murthy & Henry (1995) Murthy, J., & Henry, R. C. 1995, ApJ, 448, 848
- Murthy et al. (2010) Murthy, J., Henry, R. C., & Sujatha, N. V. 2010, ApJ, 724, 1389
- Onaka & Kodaira (1991) Onaka, T., & Kodaira, K. 1991, ApJ, 379, 532
- Overduin & Wesson (2008) Overduin, J. M., & Wesson, P. S. 2008, The Light/Dark Universe: Light from Galaxies, Dark Matter and Dark Energy (Singapore: World Scientific)
- Paresce et al. (1979) Paresce, F., Bowyer, S., Lampton, M., & Margon, B. 1979, ApJ, 230, 304
- Paresce et al. (1980) Paresce, F., McKee, C. F., & Bowyer, S. 1980, ApJ, 240, 387
- Perryman et al. (1997) Perryman, M. A. C., Lindegren, L., Kovalevsky, J., et al. 1997, A&A, 323
- Planck Collaboration et al. (2014) Planck Collaboration, Abergel, A., Ade, P. A. R., et al. 2014, A&A, 571, A11
- Reach et al. (1994) Reach, W. T., Koo, B.-C., & Heiles, C. 1994, ApJ, 429, 672
- Savage et al. (1977) Savage, B. D., Bohlin, R. C., Drake, J. F., & Budich, W. 1977, ApJ, 216, 291
- Schlegel et al. (1998) Schlegel, D. J., Finkbeiner, D. P., & Davis, M. 1998, ApJ, 500, 525
- Tennyson et al. (1988) Tennyson, P. D., Henry, R. C., Feldman, P. D., & Hartig, G. F. 1988, ApJ, 330, 435
- Voyer et al. (2011) Voyer, E. N., Gardner, J. P., Teplitz, H. I., Siana, B. D., & de Mello, D. F. 2011, ApJ, 736, 80
- Wakker (2006) Wakker, B. P. 2006, ApJS, 163, 282
- Welsh et al. (2010) Welsh, B. Y., Lallement, R., Vergely, J.-L., & Raimond, S. 2010, A&A, 510, A54
- Xu et al. (2005) Xu, C. K., Donas, J., Arnouts, S., et al. 2005, ApJ, 619, L11
- Xue et al. (2008) Xue, X. X., Rix, H. W., Zhao, G., et al. 2008, ApJ, 684, 1143