Krypton and radon background in the PandaX-I dark matter experiment
Abstract
We discuss an in-situ evaluation of the 85Kr, 222Rn, and 220Rn background in PandaX-I, a 120-kg liquid xenon dark matter direct detection experiment. Combining with a simulation, their contributions to the low energy electron-recoil background in the dark matter search region are obtained.
keywords:
Krypton; Radon; Background; Dark Matter; Xenon; PandaX1 Introduction
Radioactive rare gases, most notably 85Kr, 222Rn and 220Rn, are important background in xenon-based dark matter experiments. They cannot be removed by conventional hot getters via chemical reactions and have high mobility to diffuse throughout the target volume, which degrade the power of fiducialization. The air contains unstable 85Kr (10.8 year half-life, -decay) whose activity is 1 Bq/m3 produced by the fissions of uranium and plutonium in our nuclear age [1]. If air is leaked into the detector, 85Kr would produce -decay background in the detector. Radon gas is produced by the decay of the long-lived 238U and 232Th, which could be introduced into the detector either externally by an air leak or internally by surface emanation from detector materials. Direct measurement of such background during data taking is critical.
PandaX-I [2] was a dark matter search experiment operated at the China JinPing underground laboratory (CJPL) [3, 4, 5] using a dual-phase time projection chamber (TPC) with a 120-kg active liquid xenon target. The apparatus has been described in detail in Ref. [2], so only the key aspects relevant to this paper are presented here. A particle interacting in liquid xenon (LXe) produces prompt scintillation photons (S1). Some ionized electrons will drift under a drift field defined by the 60 cm diameter cathode grid ( kV) and the gate grid (5 kV) located at the bottom and top of the sensitive liquid region, separated by 15 cm. The electrons will be extracted into the gaseous xenon by a stronger field across the liquid surface between the gate grid and the anode mesh (ground), separated by 8 mm, and produce proportional electroluminescense photons (S2). The S1 and S2 are collected by the photomultiplier (PMT) arrays located at the top and bottom of the TPC. When in combination with the time separation between S1 and S2, they allow three-dimensional reconstruction of the event vertex. The ratio between the S2 and S1 for the nuclear recoil (NR) signal produced by dark matter scattering with xenon nucleus is significantly lower than that for electron recoil (ER) background produced by the s or s, enabling effective background rejection. events, characteristic for radon decays, can be identified by their discrete high value of energy deposition but an even less S2-to-S1 ratio in comparison to the NR events.
The results for dark matter search from PandaX-I have been published in Refs. [6, 7]. In this paper, we present a detailed in-situ evaluation of the krypton and radon background in the full exposure (5480.1 kg-day) dark matter search data in PandaX-I. Same as Ref. [7], we have applied the widely used delayed coincidence to tag these background in the data, as in Refs. [8, 9, 10, 11, 12]. In this paper, we updated the corresponding results from Ref. [7] due to the following updates. First, the and energy cuts for 85Kr were changed slightly in comparison to Ref. [7], and in this paper we used all 80-day data to search for 85Kr delay-coincidence (Ref. [7] only used the blinded 63-day data). Second, we have updated the signal finding efficiency from the Monte Carlo (MC) simulation, which has a more realistic treatment for close-by delay-coincidence signals. Third, we have made accidental background subtraction in all delayed coincidence analysis. The rest of this paper is organized as follows: Secs. 2, 3 and 4 are dedicated to 85Kr, 222Rn, and 220Rn background, respectively, using characteristic delayed coincidence along their decay chains; Sec. 5 is an alternative radon study based on single s; and Sec. 6 contains the summary.
2 Krypton background
85Kr -decays with 99.566% of the probability directly into stable 85Rb with a -value of 687 keV, and 0.434% probability into the meta-stable 85mRb with the maximum energy of 173 keV. 85mRb then de-excites with a half-life of 1.015 s, emitting a ray of 514 keV. The 85Kr level can therefore be estimated using the - delayed coincidence signature.
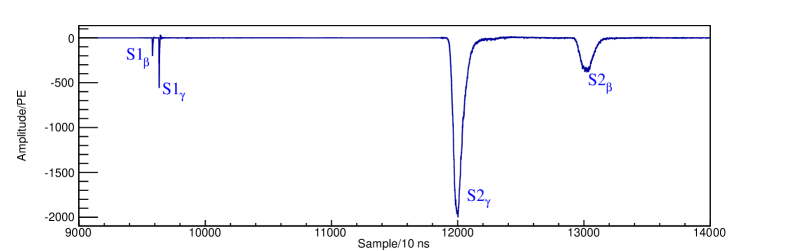
A search on the and coincidences was performed in each event. As described in Ref. [13], for each PMT channel, the waveform data in a 200 s window were recorded. To avoid ambiguity in the S1 and S2 pairing, we selected events in which both the and made a single scatter. For the delayed coincidence events from 85Kr, about 60% of them produced two clean (S1, S2) signals. The rest contained two S1s but only a single S2 as the time separation between the two S2 signals could also be less than the width of a typical S2 signal (about 2 s).
The selection cuts were applied as follows. The energy values (estimated by S1) of the and were required to be within 20 to 200 keV, and 300 to 700 keV, respectively, and the time separation between the two S1s was required to be within 0.3 and 3 s. An example coincidence waveform is shown in Fig. 1. For events with two S1s and S2s, we also required that both and were consistent with ER events (within a loose ER cut obtained from the source calibration data, cf. Fig. 4(a)). Note that to maximize the statistics, all candidate events within the 120 kg sensitive target volume were selected.
The cut efficiency was obtained using the PandaX-I MC simulation package [14], which was developed based on Geant4 [15] (v9.6) with recommended physics lists for low energy physics and included the full detector geometry of PandaX-I. The delay time cut required that both the and had deposited energy inside the detector, and the time separation between them was between 0.3 to 3 s. The efficiency was estimated to be 56.2%. The energy cut efficiencies on and were 88.8% and 72.9%, respectively, therefore the overall cut efficiency was 36.4%.
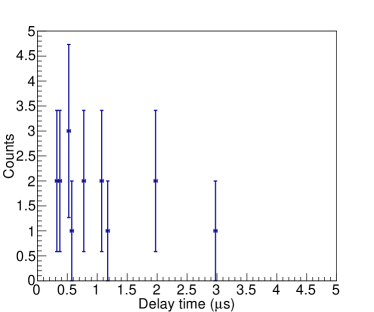
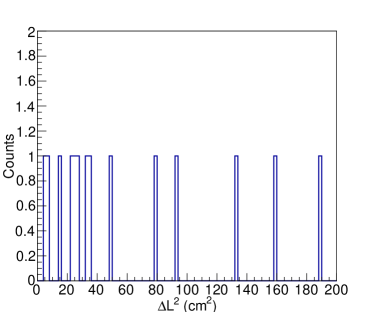
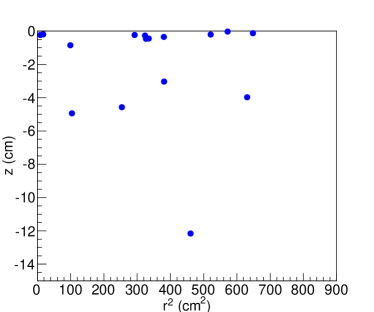
After applying the cuts above, 16 events from the data survived in the entire 120-kg sensitive volume. The delay time and the square distance () between the and are shown in Figs. 2(a) and 2(b), both exhibiting correlation despite limited statistics. The position distribution of the s is shown in Fig. 2(c). A number of candidate events happened close to the gas/liquid xenon interface. This could be due to the fact that the boiling point of krypton (120 K) is lower than that of the xenon (165 K).To be conservative, we assumed that krypton was distributed uniformly in the detector. The event selection above contained accidental background arising from the random coincidence of single -like and -like events which satisfied the selection cuts above. Based on the dark matter data, we estimated the -like and -like event rates to be 0.24 Hz and 0.4 Hz respectively. So the random coincidence event rate within the same coincidence window (0.33 s) is 2.310-2 evts/day or 1.8 events in 80.1-day exposure, with negligible statistical uncertainty.
Based on the delayed coincidence candidates and accidental background, the krypton level in xenon can be estimated by
| (1) |
where and are the numbers of 85Kr and total krypton atoms, respectively, related by the 85Kr abundance (about 210-11, see Ref. [1]). and are the number of raw candidates and accidental events in the data, respectively, is total cut efficiency, is the branching ratio which is 0.434%, -day is the live-time of the dark matter run, and is the mean lifetime of 85Kr (15.52 years). Using Eq. 1, number of 85Kr atoms is estimated to be (6.41.8)105, leading to a molar concentration of 5816 part per trillion (ppt) krypton atoms in xenon.
The MC simulation was used to translate the 85Kr decay rate to the background rate observed in the dark matter search region between 0.55 keV, leading to a 2.00.6 mDRU (mDRU = 10-3 evt/day/kg/keV) background. No apparent time dependence was observed in the - coincidence candidates, nor did the low energy background in the data exhibit the dependence. Therefore, the krypton was likely introduced during the detector filling period when the detector was underpressurized, not by a leak developed during the run.
3 222Rn
222Rn is a decay progeny of 238U, which is either external airborne or internal due to surface emanation of radioimpurity in the internal detector components. 222Rn has a half-life of 3.82 day, with its decay chain illustrated in Fig. 3. Along the chain, number of -decays could contribute to the background in the low energy signal region. Given that the PandaX-I running period was much longer than the decay half-life of 222Rn progenies all the way to 210Pb, we have assumed that secular equilibrium was achieved upstream of 210Pb, based on which we can estimate the 222Rn level.
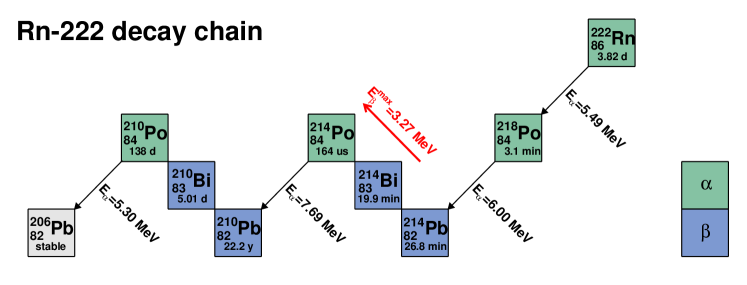
To tag 222Rn events, we used the 214Bi-214Po - delayed coincidence events, in which 214Bi emits with a maximum energy of 3.272 MeV, followed by the decay of 214Po with a half-life of 164.3 s and an energy of 7.69 MeV.
As mentioned earlier, the PandaX-I data acquisition window was 200 s [13]. The delayed coincidence signal could either be recorded in one or two adjacent events, which will be referred to as the “BiPo1E” and “BiPo2E” hereafter. The energy (scaled from S1) and energy (see later) cuts of 0.13.5 MeV and 6.09.5 MeV were applied, respectively. The time separation cut between the two S1s was set to be 20100 s for BiPo1E or 3001000 s for BiPo2E. In addition, signal should be consistent with an ER signal (Fig. 4(a)).
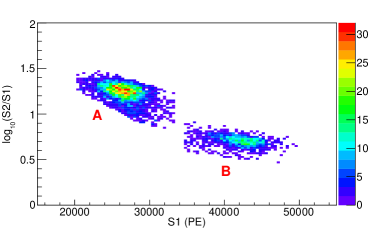
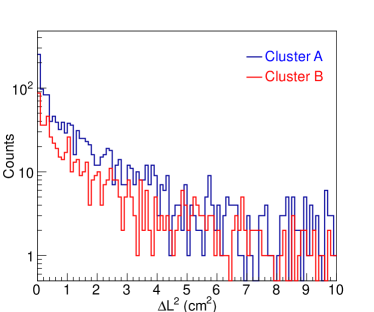
With these selection cuts, we first searched for BiPo2E from the data. Fig. 4 shows the distributions of and in the plane of log10(S2/S1) vs. S1. Two clusters in the distribution can be clearly observed in Fig. 4(b), labeled as A and B in the figure.
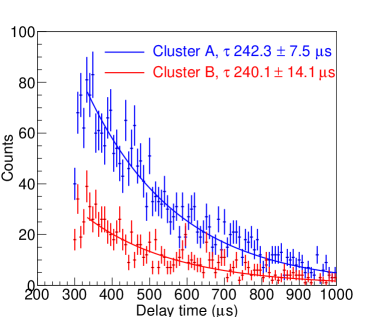
The delay time and distance between and in clusters A and B are shown in Fig. 5, with event pairs in both clusters exhibit proper timing and spatial correlations, therefore corresponding to genuine - coincidences.
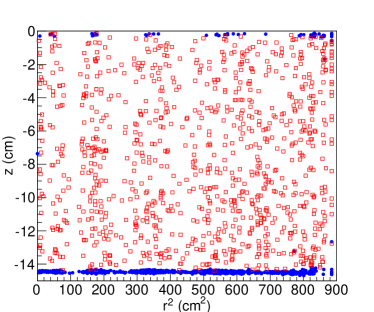
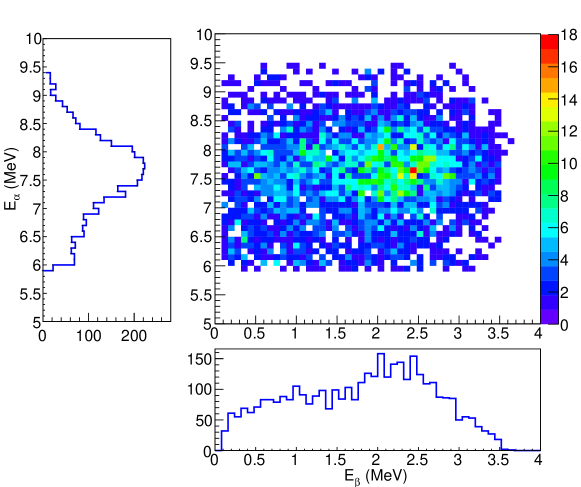
The position distribution of events in clusters A and B are shown in Fig. 5(c). Events in A are mostly located close to the cathode, while events in B are uniformly distributed in the entire detector. This phenomenon was first discussed in Ref. [16] for a liquid xenon TPC and explained by 214Bi+ ions drifting toward and getting attached onto the cathode, a model which we shall refer to as the “ion-drift model”. Since the electric field near the cathode wires was much stronger than the average drift field and due to the short range of s, cluster A is displaced from cluster B in Fig. 4(b). To reconstruct both clusters to the 214Po energy, we derived an effective energy reconstruction function as
| (2) |
The reconstructed and energy distributions are shown in Fig. 6.
For BiPo1E event, we required that there was at least one S2 signal and the energy cuts were the same with the above. Similar as those in BiPo2E, candidates were observed to form two clusters as in Fig. 4(b) with similar position distributions. No time dependence was observed from BiPo1E and BiPo2E rates. Given that the underground radon level varied from tens to few hundred Bq/m3 during the run, we concluded that the 222Rn background was not due to an external air leak, but rather due to the internal surface emanation.
Combining all the BiPo2E and BiPo1E candidate events, distributions of delay time in the 54 kg fiducial volume (FV) is shown in Fig. 7 and is fitted with a single exponential function.
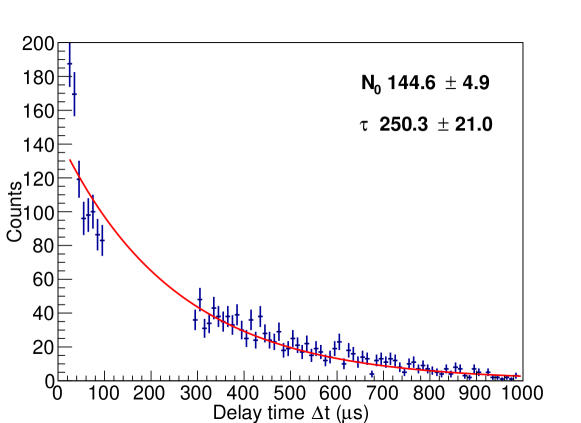
The data in the first two bins appear higher compared to the fit, implying a slight correlated background for small delay time but contributing only 3% to the total delayed coincidence rate above the expected exponential curve. The fitted decay time constant agreed well with the expectation. The total radon rate can also be estimated by integrating the fit function.
The 222Rn decay rate based on BiPo1E, BiPo2E, or the combined fit methods are summarized in Table 1.
| Method | BiPo1E | BiPo2E | Combined fit |
|---|---|---|---|
| Delay time cut acceptance | 26.3% | 26.4% | 100.0% |
| energy cut | 98.2% | 98.2% | 98.2% |
| energy cut | 100.0% | 100.0% | 100.0% |
| Branching ratio | 99.98% | 99.98% | 99.98% |
| 222Rn level | 0.66 mBq | 0.79 mBq | 0.680.13 mBq |
| 12.3 Bq/kg | 14.7 Bq/kg | 12.52.4 Bq/kg |
The signal selection efficiencies were estimated by the MC simulation. The delay time cut acceptances for BiPo1E and BiPo2E were 26.3% and 26.4%, whereas that for the combined fit is 100% due to the integration range from zero to infinity. The accidental background was estimated similarly as in Sec. 2 and confirmed to be negligible. The mean 222Rn level was obtained using the combined fit, and the uncertainty was estimated based on the largest difference among three methods. This result is at a similar level as in the XENON100 and LUX experiments [8, 9, 10, 11, 12], and such an internal background will pose challenge to next generation of liquid xenon experiment.
As mentioned earlier, -decays in the 222Rn chain contribute to the low energy background. To properly estimate the off-equilibrium -decay contribution downstream of 210Pb, in the MC simulation, 222Rn events were assumed to be produced uniformly in position in the liquid xenon (so were all the progenies) and in a duration same as the entire period of the experiment, and were let decay all the way. Events that passed all selection cuts and fell into the dark matter data taking period were counted as background. Based on the 222Rn level in the FV, the mean ER background contribution to the PandaX-I experiment for each -decay progeny is summarized in Table 2.
| Isotope | Background (mDRU) |
|---|---|
| 214Pb | 0.17 |
| 214Bi | 0.002 |
| 210Pb | 0.11 |
| 210Bi | 0.03 |
| 218Po | 0.002 |
| Total | 0.320.06 |
4 220Rn
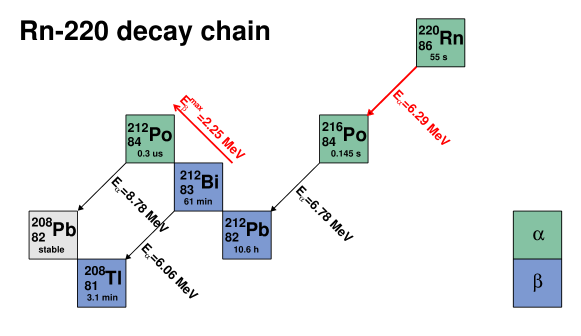
220Rn is the decay progeny of 232Th with a decay half-life of 55 s. The decay chain of 220Rn is illustrated in Fig. 8. There are two delayed coincidences which can be used as clean tags, 212Bi-212Po - and 220Rn-216Po - delayed coincidences. 212Bi has a 64.06% probability to -decay, with a maximum energy of of 2.25 MeV. The daughter 212Po decays with a half-life of 0.3 s into a stable element 208Pb emitting an particle of 8.78 MeV. The half-life of 216Po is 0.145 second and the energy is 6.29 MeV and 6.78 MeV for 220Rn and 216Po, respectively. The two decays were recorded in different events.
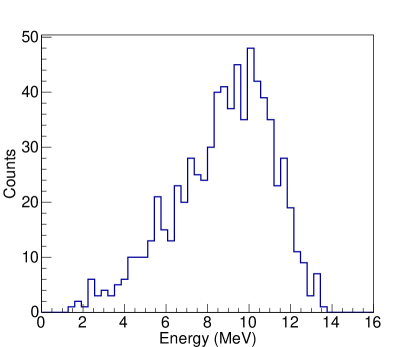
Similar to the selection of BiPo1E events in 222Rn, the event selection energy cuts for 212Bi-212Po were set in the range from 100 keV to 3 MeV for s and 3 MeV for s, and the delay time cut was set between 0.3 to 1.0 s. Similar to 214Po in Fig. 4(b), distribution of selected 212Po events also has two separated clusters, corresponding to the cathode and bulk s. The energy was reconstructed using Eq. 2, displayed in Fig. 9. Due to the short decay of 212Po, the mean energy is larger than the expected 8.78 MeV due to some pileup of S2s from the and .
To select the 220Rn-216Po delayed coincidence, the energy cuts were both from 5 MeV to 12 MeV, and the delay time cut is from 0.05 to 1 s. We required that each waveform should have only one S2 signal. The distributions of energy, position and timing difference between the selected two s are shown in Figs. 10 and 11.
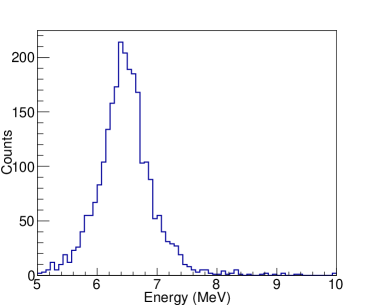
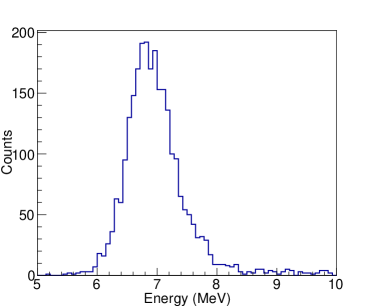
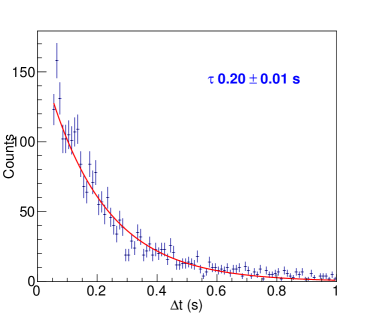
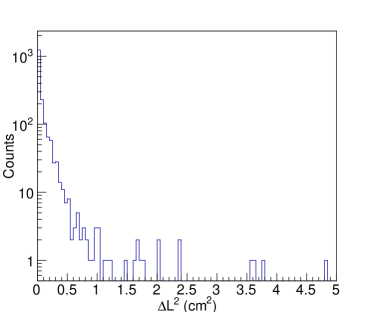
The delay time distribution agrees with the expectation and the position between two s are close, consistent with the expectation too. The position distributions of the two s in z and r2 are shown in Fig. 12, where a much uniform distribution is found in comparison to the bismuth-polonium coincidences.
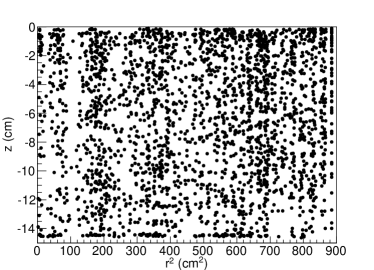
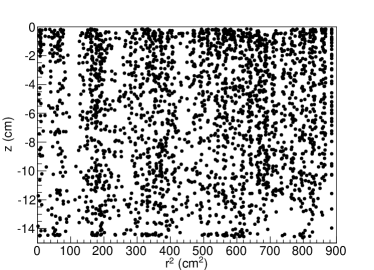
This is again consistent with the ion-drift model in Ref. [16] that the early daughters are more uniformly distributed while the later ones are more concentrated on the cathode since they have more time to drift under the electric field. Like in 222Rn, no time dependence was observed in the - and - rates, indicating that 220Rn was produced by internal surface emanation.
The 220Rn levels in the FV estimated from the two methods are summarized in Table 3.
| BiPo - | RnPo - | |
| Delay time cut acceptance | 40.1% | 77.9% |
| () energy cut | 95.7% | 100.0% |
| energy cut | 100.0% | 100.0% |
| Branching ratio | 64.06% | 100% |
| 220Rn level | 0.09 mBq | 0.21 mBq |
| 220Rn level | 1.6 Bq/kg | 3.9 Bq/kg |
The accidental background was calculated to be negligible. The two results differ by more than a factor of two, and that using the - method exhibits a strong depletion, consistent with the ion-drift model. The final level of 220Rn was estimated to be 2.71.1 Bq/kg, in which the average and half of the difference between the two methods were taken as the mean and uncertainty, respectively. The statistical uncertainties from the two methods were both negligible. Similar to Sec. 3, 220Rn events and their daughters were placed uniformly in position in the liquid xenon in the simulation. The contributions due to individual decay daughters to the low energy ER background in the FV are listed in Table 4.
| Isotope | Background (mDRU) |
|---|---|
| 212Pb | 0.11 |
| 212Bi | 0.02 |
| 208Tl | 0.001 |
| Total | 0.130.06 |
5 Single studies
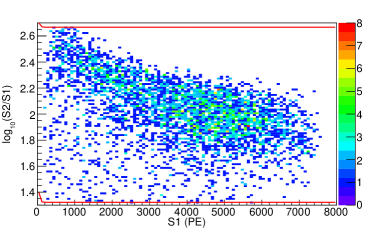
As shown in the coincidence analysis, s from the decay chain can be easily distinguished due to their high energy and large scintillation-to-ionization ratio. Therefore, single s (events in which only an isolated was identified) can also be used directly to estimate the radon background. In this approach, we selected events with S1 larger than 2104 PE in the FV and required that the location encoded by the top/bottom ratio of the S1 signal was consistent with that obtained based on the timing difference between S1 and S2, to ensure that the S1 was paired with the correct S2 signal.
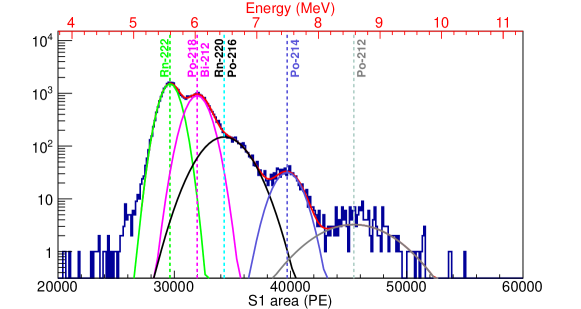
Unlike in the coincidence measurement, identification of different single s relied on good energy resolution. We used S1 signals corrected by an empirical position uniformity function to reconstruct energy instead Eq. 2 to avoid saturation effects in S2s. The S1 energy spectrum is shown in Fig. 13. The distribution is fitted with a sum of five Gaussian functions, with the peaks from low to high identified as 222Rn, 218Po (or 212Bi), 220Rn (or 216Po), 214Po, and 212Po, with their centroids in reasonable agreement with expectation. Radon levels estimated from individual peaks are listed in Table 5.
Along both chains, the event rate in the FV decrease towards later chain, consistent with the ion-drift model, also consistent with the findings in Refs. [16] and [11, 12]. We note that the values in Table 5 have sizeable discrepancies with those in Tables 1 and 3. For example, 214Po (0.28 mBq) is different from 214Bi-214Po coincidence (0.68 mBq), and 212Po (0.06 mBq) is different from 212Bi-212Po (0.09 mBq), indicating systematic uncertainties in the single alpha analysis due to finite energy resolution to these highly energetic events. Therefore, in this paper, we report the values derived from the coincidence method as the official results. Further studies are ongoing with the new data from PandaX-II in which the TPC is a factor of four longer to investigate the difference between the two approaches.
| Decay chain | Isotope | (MeV) | (MeV) | Radon rate (mBq) |
|---|---|---|---|---|
| 222Rn | 222Rn | 5.49 | 5.59 | 3.9 |
| 218Po | 6.00 | 6.02 | 2.8 | |
| 214Po | 7.69 | 7.69 | 0.28 | |
| 220Rn | 220Rn | 6.29 | 6.47 | 0.9 |
| 216Po | 6.78 | |||
| 212Po | 8.78 | 8.58 | 0.06 |
6 Summary
We present a krypton and radon background study based on the PandaX-I full exposure data. By searching for delayed coincidence events along their decay chains, we obtained the krypton and radon decay rates in the detector. With an updated data selection and MC simulation, the expected background due to 85Kr, 222Rn and 220Rn were estimated to be 2.00.6, 0.320.06 and 0.130.06 mDRU respectively, consistent with and should supersede the initial estimates presented in Ref. [7]. These background rates appeared stable over time and distributed throughout the detector. For increasingly large detectors in the next generation experiments, such background may become more important, and special care is called for to control such background to a new level.
7 Acknowledgement
This work has been supported by a 985-III grant from Shanghai Jiao Tong University, grants from National Science Foundation of China (Grant Nos. 11435008, 11455001, 11505112 and 11525522), and grants from the Ministry of Science and Technology of China (Grant Nos. 2016YFA0400301 and 2016YFA0400302). This work is supported in part by the Key Laboratory for Particle Physics, Astrophysics and Cosmology, Ministry of Education, Shanghai Key Laboratory for Particle Physics and Cosmology (SKLPPC), and the Chinese Academy of Sciences Center for Excellence in Particle Physics (CCEPP).
References
- [1] P. Collon et al., Tracing Noble Gas Radionuclides in the Environment, Ann. Rev. Nucl. Part. Sci. 54 (2004) 39-67
- [2] X.G. Cao et al. (PandaX collaboration), PandaX: A Liquid Xenon Dark Matter Experiment at CJPL, Sci. China Phys. Mech. Astron. 57 (2014) 1476
- [3] K.J. Kang, J.P. Cheng, Y.H. Chen, et al., Status and Prospects of a Deep Underground Laboratory in China, J. Phys. Conf. Ser. 203 (2010) 012028;
- [4] H.T. Wong et al., Dark Matter Search with Sub-keV Germanium Detectors at the China Jinping Underground Laboratory, J. Phys. Conf. ser. 375 (2012) 042061;
- [5] J. Li, X. Ji, W. Haxton et al., The Second-phase Development of the China JinPing Underground Laboratory, arXiv:1404.2651[physics.ins-det]
- [6] M.J. Xiao et al. (PandaX Collaboration), First dark matter search results from the PandaX-I experiment, Sci. China Phys. Mech. Astron. 57 (2014) 2024
- [7] X. Xiao et al. (PandaX Collaboration), Low-mass dark matter search results from full exposure of PandaX-I experiment, Phys. Rev. D 92 (2015) 052004
- [8] E. Aprile et al. (XENON100 Collaboration), Study of the electromagnetic background in the XENON100 experiment, Phys. Rev. D 83 (2011) 082001
- [9] Marc Weber, XENON100 Collaboration, A Study of Radon Background in the XENON100 Experiment, AIP Conference Proceedings 208 (2011) 1338 doi:10.1063/1.3579583
- [10] Akerib D. S. et al., Radiogenic and muon-induced backgrounds in the LUX dark matter detector, Astroparticle Physics 62 (2015) 33-46
- [11] A. Bradley et. al., Radon-Related Backgrounds in the LUX Dark Matter Search, Physics Procedia 61 (2015) 658
- [12] Bradley, Adam Wade, LUX thermosyphon cryogenics and Radon-related Backgrounds for the first WIMP result, Diss. Case Western Reserve University (2014)
- [13] X.X. Ren et al., The Electronics and Data Acquisition System for the PandaX-I Dark Matter Experiment, JINST 11 (2016) T04002 arXiv:1602.00858v2 [physics.ins-det]
- [14] Manuscript in preparation.
- [15] S. Agostinelli et al., NIM A, vol. 506, no. 3 (2003)
- [16] J.B. Albert et. al., Measurements of the ion fraction and mobility of alpha and beta decay products in liquid xenon using EXO-200, Phys. Rev. C 92 (2015) 045504