Unveiling the AGN in IC 883: discovery of a parsec-scale radio jet
Abstract
IC 883 is a luminous infrared galaxy (LIRG) classified as a starburst-active galactic nucleus (AGN) composite. In a previous study we detected a low-luminosity AGN (LLAGN) radio candidate. Here we report on our radio follow-up at three frequencies which provides direct and unequivocal evidence of the AGN activity in IC 883. Our analysis of archival X-ray data, together with the detection of a transient radio source with luminosity typical of bright supernovae, give further evidence of the ongoing star formation activity, which dominates the energetics of the system. At sub-parsec scales, the radio nucleus has a core-jet morphology with the jet being a newly ejected component showing a subluminal proper motion of 0.6–1 . The AGN contributes less than two per cent of the total IR luminosity of the system. The corresponding Eddington factor is , suggesting this is a low-accretion rate engine, as often found in LLAGNs. However, its high bolometric luminosity () agrees better with a normal AGN. This apparent discrepancy may just be an indication of the transition nature of the nucleus from a system dominated by star-formation, to an AGN-dominated system. The nucleus has a strongly inverted spectrum and a turnover at GHz, thus qualifying as a candidate for the least luminous ( ) and one of the youngest ( yr) gigahertz-peaked spectrum (GPS) sources. If the GPS origin for the IC 883 nucleus is confirmed, then advanced mergers in the LIRG category are potentially key environments to unveil the evolution of GPS sources into more powerful radio galaxies.
keywords:
galaxies: individual: IC 883 – galaxies: active – galaxies: nuclei – galaxies: jets – radio cotinuum: galaxies – X-rays: galaxies1 Introduction
One of the mechanisms in the Universe able to trigger bursts of star formation, as well as the onset of an active galactic nucleus (AGN), is the merger of gas-rich galaxies (e.g., Hopkins et al., 2006; Di Matteo et al., 2007). These systems are a seed for galaxy evolution and are thought to produce luminous and ultraluminous infrared (IR: 8–1000 ) galaxies (LIRGs: ; ULIRGs: ; Sanders & Mirabel, 1996). Owing to (U)LIRGs nature, both the AGN and the active star formation therein are deeply embedded in dust, and hence obscured. Radio observations provide us with an extinction-free view of the merger products, and thus allow us to study their interaction, their evolution and their influence on their hosts.
IC 883, also known as UGC 8387, I Zw 056 and Arp 193, is one of the closest ( Mpc) LIRGs, with an IR luminosity of (Sanders et al., 2003). The system consists of a kpc rotating ring of molecular gas and dust observed edge-on, and two large tidal tails (one protruding orthogonally from the centre and another extending along the main body towards the South), which indicate the occurrence of previous merger episodes (e.g., Smith et al., 1995; Downes & Solomon, 1998; Scoville et al., 2000). Clemens & Alexander (2004) found kinematic differences in HI absorption and 12CO emission which they interpret as evidence of an outflow of atomic gas perpendicular to the ring, though they also note inflow (or other non-circular motion) could account for the velocity differences. It is possible that returning tidal material at somewhat larger distances, but seen in projection against the nucleus, could also be the origin of the kinematic disparity between the 12CO and HI.
Veilleux et al. (1995) classified this galaxy as a low-ionisation nuclear emission-line region (LINER) based on optical spectroscopy. Posterior analysis suggested its classification as a starburst–AGN composite (Yuan et al., 2010). The thermal nature of the soft X-ray emission, the IR colours indicating thermal emission from cold dust (Modica et al., 2012, and references therein), the steep global radio spectral index () and the far-IR/radio flux ratio (; Condon et al., 1991), among other characteristics, provide solid evidence of active star formation in the system. In fact, IC 883 lies close to the well known starburst galaxy M82 in the diagnostic plot of the 6.2 Polycyclic Aromatic Hydrocarbon vs the 9.7 silicate strength (with values of 0.6 and , respectively; Stierwalt et al., 2013) proposed by Spoon et al. (2007). Support for the presence of an AGN in IC 883 comes from the [Ne V] 14.32 emission line detection in the heavily obscured nuclear region (Dudik et al., 2009), and the detection of compact radio sources at milli-arcsec resolution (Lonsdale et al., 1993; Smith et al., 1998; Parra et al., 2010). The AGN has however remained elusive in X-rays and mid-IR continuum observations, where AGNs are typically uncovered, and hence its presence has been judged uncertain (e.g., Asmus et al., 2015). We note that the starburst-AGN classification means solely that there is both emission from a starburst and merger-driven shocks, which together can mimic strong AGN emission (Rich et al., 2014).
Papadopoulos et al. (2014) studied the spectral line energy distribution (SLED) of CO lines in IC 883, plus emission lines of dense gas tracers such as high-J HCN transitions, and found that the system basically lacks a dense molecular gas component ( cm-3). This is a somewhat unexpected result for a system which is presumably undergoing a starburst.
In Romero-Cañizales et al. (2012b), henceforth Paper I, we presented radio observations of the nuclear and circumnuclear regions of IC 883 using very long baseline interferometry (VLBI) facilities and the electronic Multi-Element Remotely Linked Interferometer Network (e-MERLIN) array. Our observations revealed the presence of at least six non-thermal compact components (labelled as components A1 to A6) within the innermost 100 pc diameter nuclear region of IC 883 (named component A), likely constituting a supernova (SN) factory in coexistence with a low-luminosity AGN (LLAGN) candidate (component A1). We found that the AGN candidate is powering the radio emission at both circumnuclear and nuclear scales, as seen with the e-MERLIN and European VLBI Network (EVN) arrays, unlike the scenario depicted at other wavelengths, where the starburst represents the major contribution to the global emission.
In Paper I we also modelled the IR spectral energy distribution (SED) and found that the contribution from a putative AGN to the IR emission is no more than 10 per cent that of the starburst, albeit with inherent large uncertainties predicted by our almost edge-on view of the torus.
In this paper we present recent VLBI radio observations made with the EVN, as well as archival X-ray data, aiming at confirming the presence of an AGN in IC 883, and at understanding its nature. We also present archival Karl G. Jansky Very Large Array (VLA) data which has a resolution comparable to that of our e-MERLIN observations reported in Paper I. Our study is made within the framework of the e-MERLIN legacy project Luminous InfraRed Galaxy Inventory (LIRGI; PIs: J. Conway & M. Á. Pérez-Torres)111http://lirgi.iaa.es/, which will offer a radio complement to the Great Observatories All-sky LIRG Survey (GOALS; Armus et al., 2009) NASA program. LIRGI pursues the ambitious goal of characterising the nuclear and circumnuclear radio emission of a statistically significant sample of 42 of the most luminous northern LIRGs.
We organise the manuscript as follows. In §2 we describe the radio and X-ray observations used, as well as the data reduction process. In §3 we provide maps and measurements from our data. In §4 we investigate the nature of the IC 883 nucleus based on its morphology, flux density variability, its radio SED and the X-ray emission. We recap in §5 with our final conclusion.
2 Observations: description and data reduction
2.1 VLBI radio follow-up
With the aim of characterising the nuclear emission in IC 883 we started an observing program using the EVN under project code ER030 (PI: C. Romero-Cañizales). The program consisted of three yearly epochs from 2012 to 2014 (see details in Table 1) at the frequency bands centred at GHz ( cm, or X-band), GHz ( cm, or C-band) and GHz ( cm, or L-band), using the following stations (location, diameter): Ef-Effelsberg (DE, 100 m), Wb-Westerbork array (NL, 1425 m), Jb1-Lovell (UK, 76 m), Jb2-MK II (UK, 25 m), On-Onsala (SE, 20 m at cm, and 25 m at cm), Mc-Medicina (IT, 32 m), Nt-Noto (IT, 32 m), Tr-Torun (PL, 32 m), Ys-Yebes (ES, 40 m), Sv-Svetloe (RU, 32 m), Zc-Zelenchukskaya (RU, 32 m), Bd-Badary (RU, 32 m), Ur-Nanshan (CN, 25 m), Sh-Sheshan (CN, 25 m), Hh-Hartebeesthoek (SA, 26 m) and Ro-Robledo (ES, 70 m).
Each observing segment (see Table 1) lasted 4 hr in total, from which 2.5 hr were spent on target. An integration time of 2 sec was used in all the epochs, except for segments D and G, where we used 1 sec to obtain a similar field of view as for the other frequencies in the same epochs. We used MHz sub-bands, each with dual polarisation. In the 2012 epoch the observations at 4.9 and 1.6 GHz were carried out under project EP076 (segments C and D), and subject to a correlation flaw which made those observations unusable.
We reduced the data in the NRAO Astronomical Image Processing System (aips). Taking as a starting point the EVN pipeline products, we improved the calibration considering ionospheric corrections, radio interference removal, and phase and amplitude self-calibration on the phase reference source, J13173425. The average peak intensities of this calibrator in the different bands were , and , with a variability in the peak intensity among epochs of up to 11, 18 and 9 per cent at 8.4, 4.9 and 1.6 GHz, respectively. In all segments, we used J11592914 as a fringe finder.
| ER030 | Central | Observing | Participating |
|---|---|---|---|
| segment | frequency (GHz) | date | stations |
| - | 8.4 | 02-Nov-2012 | Ef, Wb, On, Mc, Nt, Ys, Sv, Zc, Bd, Ur, Sh, Hh, Ro |
| B | 4.9 | 24-Oct-2013 | Ef, Wb, Jb2, On, Mc, Nt, Tr, Ys, Sv, Zc, Bd, Ur, Sh, Hh |
| C | 1.6 | 31-Oct-2013 | Ef, Wb, Jb1, On, Mc, Nt, Tr, Sv, Zc, Bd, Ur, Sh, Hh |
| D | 8.4 | 04-Nov-2013 | Ef, Wb, On, Mc, Nt, Ys, Sv, Zc, Bd, Ur, Sh, Hh |
| E | 4.9 | 22-Oct-2014 | Ef, Wb, Jb1, On, Nt, Tr, Ys, Sv, Zc, Bd, Sh, Hh |
| F | 1.6 | 30-Oct-2014 | Ef, Wb, Jb1, On, Nt, Tr, Sv, Zc, Bd, Sh, Hh |
| G | 8.4 | 04-Nov-2014 | Ef, Wb, On, Nt, Ys, Sv, Zc, Bd, Sh, Hh |
Imaging using different weighting regimes was performed both in aips and the Caltech imaging programme difmap (Shepherd et al., 1995), to assess the robustness of our results.
Throughout this paper, the uncertainties of the peak intensities and flux densities include a 5 per cent calibration uncertainty added in quadrature to the r.m.s. measured in the image. For the flux densities we also consider a multiplying factor for the r.m.s. term, equal to the number of beams covering the emitting region.
2.2 VLA archival observations
We reduced archival VLA data at 32.5 GHz, which has a resolution comparable to our previously reported e-MERLIN observations at 7.9 GHz (Paper I). Comparing the radio emission at these two frequencies can offer further understanding on the nature of the nucleus, given that the LLAGN candidate in IC 883 dominates the radio emission at both circumnuclear and nuclear scales.
IC 883 was observed at 32.5 GHz (central frequency) with the VLA on 12, 14 and 15 June 2011 under project AL746 (PI: A. K. Leroy), when the array was in its most extended configuration. These observations have been reported by Barcos-Muñoz et al. (2016).
We used the Common Astronomy Software Application (casa; McMullin et al., 2007) to reduce the data. The three datasets were processed independently using the VLA pipeline and removing obvious radio frequency interference features. The phase reference source was J13173425, as in our EVN observations. The peak intensity did not vary among datasets and we thus proceeded to combine them into a single dataset that allowed us to make a deeper image.
2.3 X-ray archival data
2.3.1 XMM-Newton observations
IC 883 was observed by XMM-Newton (Jansen et al., 2001) on 09 January 2001 for 21 ks (ObsID 0093640401, PI: F. Bauer). The observations were published by Carrera et al. (2007). The PN camera (Strüder et al., 2001) was operated in Extended Full Frame mode and the MOS1 and MOS2 cameras (Turner et al., 2001) in Prime Full Window, all using the Medium filter. We processed the data using the latest version of sas available (14.0.0). Source and background events were extracted for all detectors using an aperture radius of 40″ and selecting background regions on a source-free area on the same chip as the target. For the PN camera we selected single and double events and for both MOS detectors we selected single, double, triple and quadruple events. In all cases only events with quality flag were retained. The resulting net (source minus background) count rates and exposures were 0.015 counts/s and 19.5 ks for MOS1, 0.013 counts/s and 19.6 ks for MOS2, and 0.043 counts/s and 13.8 ks for the PN. We generated response files for each detector using the rmfgen and arfgen tasks and grouped the spectra with a minimum of 20 counts per bin using the task specgroup.
2.3.2 Chandra observations
We retrieved and re-analysed Chandra (Weisskopf et al., 2000) observations of IC 883 (ObsID 7811, PI: D. Sanders) made on UT 20 February 2007, and originally published by Iwasawa et al. (2011). The observation was carried out with ACIS-S (Garmire et al., 2003) and lasted for 14.2 ks. We performed the data reduction using ciao v.4.6 and following the standard procedure. We reprocessed the data with chandra_repro and then extracted the spectra using the specextract tool.
To be consistent with the spectral extraction of XMM-Newton/EPIC PN and MOS, which have much lower spatial resolution than Chandra, the ACIS-S source spectrum used for the spectral fitting was extracted from a circular region of 10 arcsec radius. The background spectrum was extracted from a circular region of the same size on the same CCD, where no other source was detected.
3 Analysis and Results
3.1 The pc-scale jet in IC 883
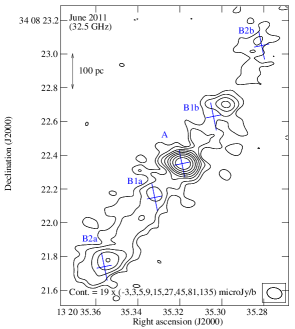
The 8.4 GHz EVN images benefit from an exquisite angular resolution and reveal for the first time a jet-like component emerging from the IC 883 core (see Fig. 1). In Table 2 we show the parameters obtained from the 8.4 GHz images convolved with a beam of mas2 at PA2.95°. For the flux measurements of the core, we considered only the emission within the 9 contour to exclude most of the extended emission that is likely associated with the jet (see Fig. 1).
| Epoch | Component | r.m.s. | Size | Peak intensity | Flux density | Luminosity | Brightness temperature |
|---|---|---|---|---|---|---|---|
| ( ) | (mas2) | ( ) | ( ) | () | (K) | ||
| 2012 | core | 59.2 | 0.59 | 2.190.12 | 2.190.12 | 26.191.49 | 6.64 |
| 2013 | 64.2 | 0.870.57 | 2.300.13 | 3.110.25 | 37.252.96 | 11.040.88 | |
| 2014 | 83.7 | 0.800.31 | 1.860.13 | 2.140.24 | 25.662.81 | 15.151.66 | |
| 2014 | jet | 83.7 | 1.370.57 | 0.590.09 | 0.800.09 | 9.541.11 | 1.770.21 |

In the 2013 and 2014 epochs the core appears slightly extended toward the direction opposite to the movement of the jet, with the largest morphology distortion in the 2013 epoch. This could hint at the existence of a counter-jet, which we cannot directly detect, probably due to the effects of Doppler de-boosting. However, we acknowledge that the 2013 observations were subject to technical problems which affected directly the uv-coverage of the source, posing difficulties for the image reconstruction and lowering its fidelity.
Only in the 2014 epoch is it possible to disentangle the jet component from the core, and we detect these two distinct components with peak positions , and , . The jet component is thus at a projected distance of 0.62 pc South-West from the core, and at a position angle (PA) of , which is almost perpendicular to the IC 883 ring structure seen at large scales with e-MERLIN at PA130°, measured from East to North ( Paper I, and references therein).
IC 883 was also observed at 8.4 GHz on 15 May 2011 with the very long baseline array (VLBA), as reported in Paper I. The angular resolution of this observation was twice that of the later EVN epochs, hence both the core and any possible jet component would have been contained within the same beam. Hence, the use of the VLBA observations as a zero-epoch is not straightforward. However, we note that in 2011, the flux density was 4.380.28 mJy (Paper I), and by 2012 it had halved. We infer that the 2014 jet component must have been ejected some time between 15 May 2011 and 2 November 2012, thus providing a lower limit to its apparent speed of 0.6 .
Using the 2012 epoch as a reference, we find that the jet has moved at approximately 1.0 . This is an upper limit to its apparent speed, as in the 2012 epoch we already see some extended emission from the core towards the direction where the jet component is detected in 2014.
3.2 Radio evolution of the IC 883 nuclear region
IC 883 shows compact structure at both 4.9 and 1.6 GHz as observed with the EVN. We have created images for all observations using a common convolving beam of mas2, which is the largest synthesised beam obtained in any epoch (corresponding to the 1.6 GHz observations in 2014 imaged with uniform weighting). This allows us to obtain flux densities from similar regions and eases the interpretation of the spectral index behaviour, although at the expense of increasing the r.m.s. Typically the use of natural weighting improves the r.m.s. whilst it provides slightly lower resolution. Here, in addition to the use of natural weighting, we have also used a much larger convolving beam than that achieved with only natural weighting (especially at 8.4 GHz). This is effectively tapering the data and consequently, it results in a larger r.m.s. We use to denote spectral indices (defined by ). The results are shown in Table 3.
| Epoch-Frequency | r.m.s. | Deconvolved | Peak intensity | Flux density | Luminosity - | Brightness temp. | Spectral |
|---|---|---|---|---|---|---|---|
| year - (GHz) | ( ) | sizes (mas2) | ( ) | ( ) | () | (K) | indices |
| 2012 – 8.4 | 77.0 | 6 | 2.660.15 | 2.660.15 | 31.861.84 | 0.11 | |
| 2013 – 8.4 | 75.5 | 1.680.80 | 4.650.24 | 4.780.31 | 57.193.76 | 6.220.41 | |
| 2013 – 4.9 | 42.2 | 6 | 4.300.22 | 4.300.22 | 51.462.62 | 0.51 | =0.20 0.16 |
| 2013 – 1.6 | 26.0 | 3.972.63 | 0.330.03 | 0.410.03 | 4.890.40 | 1.860.15 | =2.09 0.09 |
| 2014 – 8.4 | 96.8 | 4.181.14 | 4.790.26 | 5.710.39 | 68.294.71 | 2.090.14 | |
| 2014 – 4.9 | 70.0 | 2.901.89 | 4.620.24 | 5.260.34 | 62.994.03 | 4.820.31 | =0.15 0.18 |
| 2014 – 1.6 | 15.0 | 5.383.37 | 0.350.02 | 0.500.04 | 5.930.46 | 1.300.10 | =2.10 0.09 |
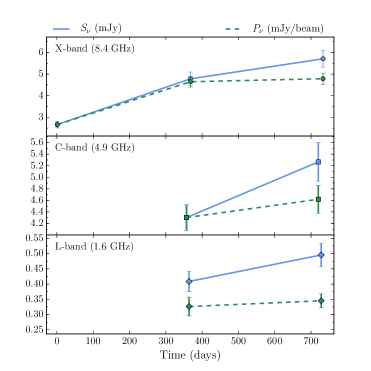
At 8.4 GHz there is a significant increase in the flux density from 2012 to 2013. We can infer this from both the high-resolution images at mas2, PA2.95° (Table 2), and the lower-resolution images at mas2 (Table 3). From 2013 to 2014 there is an apparent increase in the total flux density. We note however that adding the emission from the core and the jet in the high-resolution images results in similar fluxes within the uncertainties in 2013 and 2014. Most of the increase in flux we see at lower-resolution is likely due to extended flux unrelated to the jet, which is recovered by the larger beam. At 4.9 and 1.6 GHz there is a significant increase in the flux densities of about 20 per cent (see Fig. 2). Such an increment can also be attributed to the presence of extended emission. The peak intensities are consistent with no variation from 2013 to 2014, and seem to be dominated mostly by the evolution of the core itself.
At 8.4 and at 1.6 GHz it is clear that the deconvolved sizes are increasing. We attribute this to the expansion of the emitting region within the beam. From the high-resolution 8.4 GHz EVN images (Fig. 1), we know there is an emerging jet-like component departing from the core, and we associate its appearance to the increase in flux (at 8.4 GHz) and size of the emitting region measured in the lower-resolution images.
The spectral indices remain quite constant (within the uncertainties) from 2013 to 2014, being flat between 4.9 and 8.4 GHz () and inverted between 1.6 and 4.9 GHz (), pinpointing to some absorption mechanism. We also note that the luminosities () and brightness temperatures () are typical of synchrotron emitting sources (Table 3).
As we see in §3.5, the large convolving beam in the images we analysed in this section, might also include contamination from transient sources. However these sources would represent only a few percent of the total flux, and thus their contribution is taken into account within the uncertainties.
3.3 IC 883 at high frequencies
Further insight into the nature of the nuclear region (component A) can be obtained when comparing our previously reported e-MERLIN image at 6.9 GHz (Paper I) with the image from VLA A-configuration observations at 32.5 GHz (see §2.2). The combined VLA dataset from June 2011 was observed somewhat close in time to our e-MERLIN observations (March 2011), and their comparison can thus provide us with a rough estimate for the 6.9 to 32.5 GHz spectral index of the nuclear region.
We show the contour map of the natural weighted VLA image in Fig. 3. The image has a convolving beam of 8966 mas at PA77° and an r.m.s. . We recover a structure similar to that obtained with e-MERLIN (figure 1 in Paper I, ). We note that from the different knots of emission, only component A has a 32.5 GHz counterpart at the same position. The difference in the rest of the components might arise from the fact that at GHz we are tracing thermal radiation (e.g., from HII regions), whereas at lower frequencies it is the non-thermal radio emission from SNe, SN remnants and even an AGN, that dominate the global emission (Condon, 1992). In fact, we obtain brightness temperatures K for the 32.5 GHz emission blobs closest to B1a, B1b, B2a and B2b, which agrees with a thermal origin.
The e-MERLIN components B2a, B1a, A and B1b we reported in Paper I are at exactly the same position as the 12CO 2–1 clumps reported by Zauderer et al. (2016), labelled as C1, C2, C3 and C4, respectively. In their study they determined that component C3 (i.e., component A in our radio observations) is the dynamical centre of the molecular ring which shapes the main body of IC 883. It is in this component that the core-jet structure is embedded.
To allow a proper comparison of the VLA and the e-MERLIN observations, we have convolved the VLA image with the e-MERLIN beam: 16588 mas at PA°. In the VLA map, at the position of component A we measure a peak intensity of and a flux density of mJy. These values are very similar to those reported for component A in Paper I based on the e-MERLIN map. Hence, we obtain a two-point spectral index between 6.9 and 32.5 GHz of . Assuming that at 32.5 GHz the milli-arcsec core (component A1) will also be the dominant radio emitter from component A, as noted at 6.9 GHz with e-MERLIN, we infer that the core has also a very flat spectral index all the way from 8.4 to 32.5 GHz.
Using a spectral index of for the core and the flux density at 8.4 GHz from Table 3, we calculate a 32.5 GHz flux density of mJy in 2013, and mJy in 2014.
3.4 Radio SED of the nucleus
In Table 2 we reported the 8.4 GHz flux densities measured in 2014 for both the core and the jet. The core is approximately three times as luminous as the jet, and thus its emission will be the major contributor to the total nuclear flux measured at mas2.
In 2012 and 2013 the jet component has not been completely ejected, and we expect that its contribution to the total flux is smaller than in epoch 2014. The core will be the dominant emitter in 2012. Since we have only measurements at one frequency in 2012, we resort to considering the 2013 epoch as closest to quiescence, and use it to investigate the nature of the nucleus.
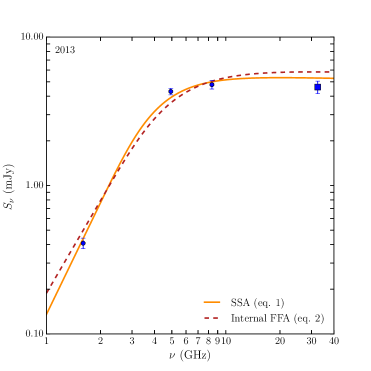
The high luminosities () and brightness temperatures () estimated for the core and the jet (Tables 2 and 3), are indicative of a synchrotron origin for the radio emission at all frequencies. We note that the spectrum is highly inverted and it shows a turnover at low frequencies. Free-free absorption (FFA) and synchrotron self-absorption (SSA) are the most commonly assumed mechanisms responsible for the turnover. We thus attempted to fit the radio SED with the available data in 2013 considering both pure SSA and pure FFA. Owing to the scarcity of data, we focused our efforts in estimating the turnover frequency () in the SED.
3.4.1 Synchrotron self-absorption
The spectral index between 1.6 and 4.9 GHz ( in Table 3) is very close to the spectral index expected from SSA in a homogeneous source ().
To construct the SED we can use a bending power-law, which produces a smooth transition between the optically-thick and optically-thin parts of the SED. Another possibility is to use a broken power-law, but this approach does not have an empirical basis.
For the bending power-law, we consider for the optically-thick part. We do not have information at frequencies where the spectrum becomes completely optically thin, but we consider to describe it. Following Callingham et al. (2015), the flux density at the frequency is described by
| (1) |
where is a constant.
We performed a non-linear least-squares minimisation to fit the bending power-law to the data and solved for and . We fitted our EVN data which covers the evolution of the core between 1.6 and 8.4 GHz, and included the expected flux density at 32.5 GHz, which provides us with an additional degree of freedom (dof). The goodness of the fit given by resulted in a value of 3.5 for 2 dof, and a turnover at GHz. The resulting SED is shown as a solid line in Fig. 4.
We also performed the fit using , which is a typical spectral index for the optically-thin part of the SED (Orienti, 2015). However, this leads to values , consequently with a p-value . We acknowledge that the scarcity of data reduces the reliability of the fits and allows the questioning of the assumptions we have made, although these seem to be quite fair.
As the behaviour of the core is similar for the fluxes and spectral indices in both 2013 and 2014, for completeness, we have repeated the above process for the values measured in 2014. This led to a very similar turnover frequency of GHz.
3.4.2 Free-free absorption
There is ongoing star formation activity in the nuclear region of IC 883 (see §3.5 and 4.4), hence internal FFA could be the mechanism responsible for producing the inverted spectrum we observe. We assume that the flux density follows:
| (2) |
(as described by Callingham et al., 2015) where we used the same notation as in §3.4.1. Since the spectral index in the optically-thin part of the spectrum is not known, we proceeded with as in §3.4.1. The SED obtained this way is shown in Fig. 4. From visual inspection we infer that the fit using FFA is slightly worse than that obtained using SSA. In fact, we obtain a larger value, 13 for 2 dof and assuming , and 49.5 for 2 dof and assuming . The turnover frequency in this case is 5.4 GHz. Similar values are obtained when fitting the 2014 measurements.
Three or four data points are not sufficient to assess the reliability of either SSA or FFA, and although we cannot neglect the influence of FFA, our fit favours SSA, and thus this is the absorption mechanism we adopt hereafter.
3.5 Transient radio sources in IC 883
Each of our EVN observations achieved an r.m.s. (see Table 3) which is equivalent to a detection of a radio supernova with luminosity (e.g., SN 1993J).
To ease the detection of radio transients in our observations, we created deep images following two paths in aips: (i) combining epochs in the image plane; and (ii) imaging the concatenated uv-data at each frequency. The former path gave unreliable results, as it enhanced artifacts present in individual images. The latter path led to a decrease in the r.m.s. We additionally attempted phase-only self-calibration to further improve image quality. However, this process failed to provide good solutions given that our target sources are faint.
Using the concatenated uv-data we made naturally-weighted deep images, which are best to test detection feasibility. These images are shown in grey-scale maps in Fig. 5 (excluding the 8.4 GHz frequency band) and their characteristics are listed in Table 4.
| Frequency | FWHM, PA | r.m.s. |
|---|---|---|
| (GHz) | (mas2, °) | ( ) |
| 8.4 | , | 48.6 |
| 4.9 | , | 42.8 |
| 1.6 | , | 19.1 |
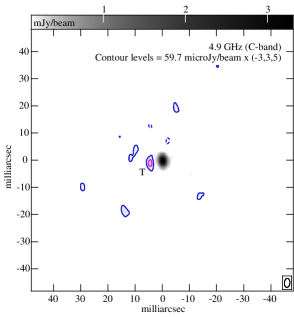
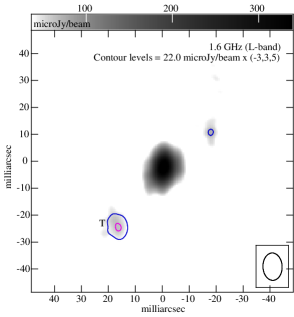
We created new images at the same spatial resolution as the deep images, but restricting the cleaning to the very central region, which is dominated by the core and the jet. We then subtracted these images from their corresponding concatenated datasets. This resulted in uv-datasets that are core-jet emission free, whose images are shown as contours overlaid on top of the grey-scale maps in Fig. 5. The contours represent the residuals, and we identify two putative transient sources with a S/N (labelled with a T), and thus correspond to robust detections. We carefully checked that these detected sources do not lie on top of sidelobes. There is no obvious emission left after the subtraction of the nuclear emission at 8.4 GHz. We note as well that previously known nuclear components (sources A2, A3 and A4 from Paper I, ) were not detected, hence confirming their transient nature.
To further test the reliability of the T sources, we produced natural weighted maps of the individual epochs at the resolution indicated in Table 4 according to the corresponding frequency. The image fidelity is slightly worse than in the deep images as there are fewer visibilities, however we find that the T source at 4.9 GHz is detected only in epoch 2013, and the 1.6 GHz T source appears only in epoch 2014. The 4.9 GHz T source is still marginally detected in a uniformly-weighted map, whilst the 1.6 GHz is washed out when using that weighting scheme. We therefore report only one reliable transient source in epoch 2013 at 4.9 GHz, with a luminosity of , based on the 4.9 GHz deep radio image. Such a luminosity is comparable to that of bright radio SNe at their maximum light.
3.6 XMM-Newton and Chandra results
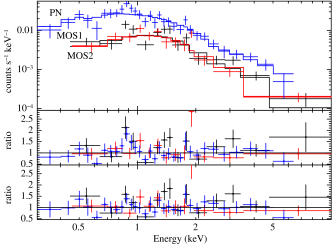
The top panel of Fig. 6 shows the three XMM-Newton spectra in the 0.2–10 keV range: the EPIC/PN spectrum is shown in blue and the MOS 1 and MOS 2 spectra in black and red respectively. For all fits we used the xspec package and fit the three spectra simultaneously with all parameters tied.
We first tried a simple fit with a power-law model (powerlaw) obscured by neutral material using the Tuebingen-Boulder absorption model for X-ray absorption by the gas, molecular and dust phases of the interstellar medium (ISM) (tbabs; Wilms et al., 2000), with a hydrogen column density fixed at the Galactic value in the direction of the source, cm-2. This model gives a poor fit with for 57 dof and obvious residuals peaking sharply at 0.8 keV, and overestimates the flux at low and high energies. Freeing the column density and maintaining the powerlaw slope and normalisation free improves the fit significantly to for 56 dof. This model is plotted as a solid line in the top panel of Fig. 6 and the ratio between the data and the model is plotted in the middle panel. The best fitting values of the parameters are cm-2, photon index , and normalisation at 1 keV. These values result in an unabsorbed 2–10 keV flux of and a 2–10 keV luminosity .
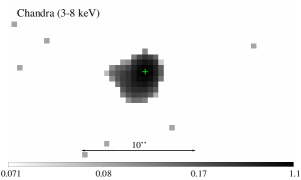
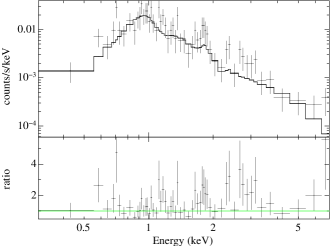
The higher angular resolution Chandra images of IC 883 show a spatially extended emission region around a central point source (Fig. 7). This extended emission is inevitably included in the extraction region of the PN and MOS source spectra. This emission probably corresponds to hot gas in the galaxy and we account for it by adding an optically-thin thermal emission component, using the Astrophysical Plasma Emission Code (apec; Smith et al., 2001). For the XMM-Newton spectrum, fitting the model tbabs*(powerlaw apec) with free column density, powerlaw slope and normalisation, and apec temperature and normalisation, while keeping the abundance fixed to the Solar value and the redshift at the systemic value , gives a slightly better fit with for 54 dof. The hot gas component is always sub-dominant but makes its largest contribution between 0.7 and 1 keV removing a small peak in the residuals at these energies. The ratio of the data to this model is shown in the bottom panel in Fig. 6, where the peak at 0.85 keV, most clearly seen in the PN (blue points) is better modelled. The best fitting parameters are cm-2, , powerlaw normalisation at 1 keV, apec temperature keV and apec normalisation at 1 keV. These values result in an unabsorbed 2–10 keV flux of the powerlaw only of and , similar to the value reported by Modica et al. (2012). Chandra data were binned to 1 count per bin, and we used Cash statistics to fit the ACIS-S spectrum, resulting in for 147 dof. Using a model similar to the one applied to XMM-Newton data we obtain a column density of cm-2, a photon index of , and a temperature of the apec of keV. All these parameters are consistent with the values obtained with XMM-Newton/EPIC. The Chandra spectrum is shown in Fig. 8. The observed 2–10 keV flux is .
4 Discussion
The high-resolution radio data we have presented in this paper provide unambiguous evidence of the existence of a jet in IC 883, and thus, for the presence of an AGN in the nucleus. On the other hand, our analysis of the available X-ray data agrees both with star formation and AGN activity in IC 883. In this section we discuss the observational evidence in order to understand the ongoing physical processes in the core of IC 883.
4.1 Origin of the X-ray emission
The origin of the X-ray emission is difficult to determine. The 0.2–10 keV spectrum contains an optically-thin thermal component and a powerlaw with slope . The former can be produced by a collisionally ionised plasma in a star forming region while the second can be produced by a related population of high-mass X-ray binaries. In this case, the entire X-ray emission can be ascribed to star formation. Alternatively, a low luminosity Seyfert spectrum could produce the powerlaw emission and photo-ionise its surroundings to produce most of the emission below 2 keV, which is also consistent with the optical LINER classification of this source.
Taking into account the background-corrected Chandra counts in the 2–8 keV () and 0.5–2 keV () bands, the hardness ratio () for IC 883 is . This value is below the threshold set by Iwasawa et al. for AGN (), and is consistent with the average of the GOALS sample (, Iwasawa et al., 2011). However, a slope of , as measured here, is also consistent with a low-accretion rate AGN (e.g., Fanali et al., 2013).
The X-ray to star formation rate (SFR) correlation of Ranalli et al. (2003), considering the SFR of IC 883 (185 yr-1, Paper I, ), shows that the expected 2–10 keV luminosity solely due to star formation would be , which is 10 times higher than the measured X-ray luminosity of the source. This discrepancy can be related to a high obscuration of the star forming region itself. Furthermore, the high X-ray flux expected would suggest that most of the observed X-ray emission arises from the star formation.
4.2 A new jet component
Our EVN observations on 4 November 2014 clearly show a resolved core-jet structure in IC 883. The jet was likely ejected some time between 15 May 2011 and 2 November 2012 hence moving away from the core with an apparent speed of 0.6–1.0 (see Section 3.1). Such subluminal proper motion is comparable to the apparent velocities of jets detected in LLAGNs (e.g., Nagar et al., 2002a; Mezcua & Prieto, 2014; Argo et al., 2015).
We note that the appearance of the jet component was not associated with a strong radio flare in IC 883 at least since 2004, time of the first VLBI observations at frequencies higher than 5 GHz reported in Paper I where the core is clearly detected, though even before that, Lonsdale et al. (1993) reported an upper limit at 1.49 GHz from global VLBI observations made in 1991. The jet is detected thanks to the high-resolution and high-sensitivity observations that were made toward IC 883 for the first time. Similar observations are needed to unveil parsec-scale jet components in other AGNs as suggested by Mezcua & Prieto (2014). We are probably witnessing recurrent AGN activity in IC 883 rather than its onset, unlike in the case of NGC 660 where the radio brightness increased by a factor of , accompanying the appearance of a new compact source and the production of a jet (Argo et al., 2015).
Given the nuclear flux density level in 2011 (4.380.28 mJy, Paper I, ) and its decrease by 2012 (see Table 2), we can infer there was probably a previous component similar to the one we clearly detect in 2014. In Paper I we also reported variability in the flux density of the nucleus at 5 GHz (labelled as component A1 in that paper) in the unevenly sampled period from 2004 to 2011. IC 883 could be producing jet components continuously. However, the jet components do not seem to live very long, as we do not see larger-scale jets, not even at a 2 mas resolution.
It is thought that a very dense ISM (as expected in the nuclear region of LIRGs) can halt jets moving through it (Bicknell et al., 2003). The interaction of the jet with the ISM can be probed by means of HI absorption observations. However, the possibility exists that HI absorption also probes foreground molecular clouds which happen to lie in the line of sight (Conway, 1999), as seems to be the case here (see §1). In IC 883, the HI absorption reported by Clemens & Alexander (2004) is displaced by arcsec () from component A (Zauderer et al., 2016), and hence it is not probing directly the core-jet region.
Papadopoulos et al. (2014) report a deficit of dense gas toward the dynamical centre region (which corresponds to the nuclear region as we have seen at radio frequencies). Furthermore, Modica et al. (2012) found evidence of a nuclear stellar wind based on the soft X-ray emission and morphology. In fact, the soft X-ray spectrum can be well reproduced by a collisionally ionised plasma, which is a typical signature of star formation. We can exclude the presence of a strong X-ray jet, since its radio counterpart is not strong. Is the jet clearing its way through the surrounding gas? Probably not, as it is more likely that the star formation feedback is responsible for the gas dispersal.
What is then hindering the production of large scale radio jets and keeping the central radio source confined to very small regions? The reason could simply be that the AGN is producing weak jet components which are not powerful enough to break through the dense ISM.
4.3 A Gigahertz Peaked-Spectrum galaxy candidate
The IC 883 nucleus has a spectral index between 1.6 and 4.9 GHz (in 2013 and 2014) very close to the spectral index expected from synchrotron self-absorption in a homogeneous source (), with a turnover frequency of GHz. This characteristic, together with the compactness of the nucleus (at a few mas-scale), are typical features of the so-called Gigahertz-Peaked Spectrum (GPS) sources (e.g., O’Dea et al., 1991; de Vries et al., 1997; Snellen, 2009), which also share common properties with LLAGNs (Nagar et al., 2002b). GPS sources are important as they represent the first stages of powerful radio galaxies (e.g., O’Dea, 1998; Snellen et al., 2000, and references therein).
GPS galaxies have typical luminosities at 5 GHz above ( W s-1). This is about three orders of magnitude higher luminosity than that displayed by IC 883 (see Table 3). However, it is known that current GPS catalogues are biased toward bright sources at redshifts . The discovery by Tingay et al. (1997) of the nearest GPS galaxy at the time posed the question whether the low-luminosity, low-redshift GPS sources are hiding among or within LINER sources (O’Dea, 1998). In fact, Tingay et al. (2003) presented three nearby GPS sources hosted by elliptical galaxies which can be thought of as IC 883 “cousins” based on the common properties shared by their hosts: (i) showing strong evidence of interacting/merging activity; (ii) showing optical spectra identifying them as LINERs; (iii) being low-redshift galaxies (100 Mpc) with luminosities below the average for GPS galaxies (see also Hancock et al., 2009; Tingay & Edwards, 2015), although IC 883 remains the least luminous one.
It has been suggested that the compactness (on sub-kpc scales) of GPS galaxies is due to interaction with very dense surrounding gas, which is responsible for hindering the jet growth (e.g., Bicknell et al., 1997), although there is now mounting evidence that their sizes can be explained in terms of their age (O’Dea, 1998; Snellen, 2009). There are different methods to determine the age of GPS sources. For instance, using the curvature of the synchrotron spectrum in a sample of compact lobe-dominated objects and assuming equipartition magnetic fields, Murgia (2003) found spectral ages between 102–105 yr for such objects. Polatidis & Conway (2003) measured the subluminal proper motion of hot spots, and determined kinematic ages within the same range. However, Murgia (2003) noted that when the morphology of the GPS source is dominated by strong jets or hot spots, the spectral age will be a lower limit to the source age.
In the case of IC 883 there is no available information about the frequency at which the spectrum breaks and becomes steep (i.e., where radiation losses dominate) and thus we cannot determine the spectral age. In an attempt to estimate the age of the AGN in IC 883, we consider the formulation for the magnetic field and synchrotron time given by Pacholczyk (1970),
| (3) |
where is the filling factor of fields and particles, is the ratio of heavy particle energy to electron energy, adopting for simplicity the values of 0.5 and 100, respectively (see e.g., Beck & Krause, 2005). is the linear size of the radio emitting region, with a value of 7.3 pc (15 mas), as measured from the EVN images at mas2. is a function of the upper and lower frequencies considered and their corresponding spectral index, which in this case is .
From Table 3, we see that varied from 0.20 in 2013 to 0.15 in 2014. This is the turnover region of the radio SED. We have also determined that at higher frequencies, the core has a much flatter spectral index (), which holds at least from 8.4 to 32.5 GHz (see §3.3). Using these as lower and upper frequencies, we calculate a radio luminosity of in 2013 and in 2014. We thus determine a magnetic field strength of mG in 2013, and a similar value in 2014 that differs by only 5 per cent.
Tyul’Bashev (2001) obtained mean magnetic field strengths of the order of 1–10 mG for a sample of GPS sources, in good agreement with the values compiled by O’Dea (1998) from the literature. The value we estimated for IC 883 is consistent with the values reported by those authors. It is remarkable that even though IC 883 is also an advanced merger, its magnetic field strength exceeds by at least an order of magnitude that of other sources belonging to the same class (Momjian et al., 2003; Drzazga et al., 2011; Romero-Cañizales et al., 2012a).
We can now calculate the lifetime of the electrons with minimum energy moving in such a magnetic field and at a frequency (considered here as 8.4 GHz) as:
| (4) |
(Pacholczyk, 1970), resulting in an age of yr, which is at the lower end of the typical age range for GPS galaxies. An estimate of the electron lifetime according to van der Laan & Perola (1969) leads to basically the same result ( yr). In the following, we adopt an age of yr for the IC 883 core.
4.4 Ongoing star formation in the system
In Paper I we estimated a core-collapse SN (CCSN) rate of yr-1 and a SFR185 yr-1 for IC 883. Such high rates make IC 883 a prime target for CCSN searches using high-spatial resolution radio and near-IR observations.
We have concatenated all the EVN epochs to produce deep images of IC 883 at different frequencies to facilitate the SN search. We detected a transient source at 4.9 GHz in 2013 with a luminosity comparable to that of luminous radio SNe and give further evidence of the ongoing star formation activity in the nuclear regions of IC 883.
If the transient is indeed a SN, it seems to evolve fast, as we do not detect it in consecutive yearly epochs and it appears at only one frequency at a time. Another possibility is that this is a slowly evolving SN and it appears to be caught close to its maximum light, and had already fallen below the detection limit in a timespan of a year.
On account of IC 883’s distance, the discovery of transients in the radio is biased to only the brightest SNe. SNe 2010cu and 2011hi exploded in the circumnuclear regions of IC 883 and were detected in the near-IR (Kankare et al., 2012). These are likely Type IIP events based on their near-IR light-curves and radio upper limits (Kankare et al., 2012, Paper I). Type IIP SNe can easily go unnoticed at radio wavelengths as they typically have low peak luminosities ( ). This would imply that the transients we detect (reported in Paper I, and in this paper), if they are SNe, are either Type Ib/c (which are bright and evolve fast), or are relatively bright Type II’s caught close to their maximum light, falling below our detection limits rather soon. In both cases, we do not expect to detect them in consecutive yearly epochs.
We do not detect non-thermal milliarcsec radio sources off the IC 883 nuclear region. However, we note that there are large amounts of molecular gas throughout the system. The largest concentration of gas is located in component B2a (labelled as C1 by Zauderer et al., 2016), which is also near the explosion site of SNe 2010cu and 2011hi (see figure 1 in Paper I, ). The molecular mass in B2a is about twice as much as in the central component A (i.e., C3). Clemens & Alexander (2004) noticed that the spectral index in the nuclear region (A) is quite flat (consistent with an AGN nature) and steeper in the rest of the system (in agreement with active star formation). It is thus likely that the peak of star formation in IC 883 is off-nuclear (as seen in e.g., the Antennae galaxies, Wang et al., 2004), but yielding a dimmer population of SNe like SNe 2010cu and 2011hi that are not easily detected at the radio.
4.5 IC 883 energetics
The starburst in IC 883 seems to dominate the global emission at a wide range of wavelengths. However, the detection of the mas-scale jet in IC 883, together with the high brightness temperature ( K) radio core, the measured spectral index and the flux density variability, indicate that the central component is non-thermal and related to the presence of an AGN, which clearly dominates the nuclear radio emission. This has only been possible owing to high-resolution radio observations that allowed us to disentangle the nuclear region.
There is, however, no observational measurement of the mass of the central BH () in IC 883. This LIRG is not a classical bulge galaxy nor an elliptical, however, Scoville et al. (2000) found that its 1.6 light profile is better fitted by a law rather than by an exponential disk, thus implying an elliptical-like bulge. It should also be considered that IC 883 is an advanced merger, and although can have oscillations owing to departures of the system from dynamical relaxation, it is considered that after coalescence, as in this case, such fluctuations are not large (Stickley & Canalizo, 2014). We can thus use as a good approximation the - relation described in Kormendy & Ho (2013) for classical bulges and elliptical galaxies in the IC 883 case. Rothberg & Joseph (2006) measured in IC 883 for the central stellar velocity dispersion, , based on the absorption of the Ca triplet line at 8500 Å. Using this value in equation 7 from Kormendy & Ho (2013), we estimate . In this case, the Eddington Luminosity would be within the range – .
IC 883 was originally classified as a LINER (Veilleux et al., 1995). LLAGNs usually also have a low-ionisation power, and thus lack coronal lines. The typical Eddington factors () of LLAGNs are of the order of –, which makes them low-accretion rate AGNs (Nagar et al., 2005).
Is IC 883 a true LLAGN even though a coronal line ([Ne V] 14.32 ) has been detected in it? To investigate this, we first determine the mass accretion rate for IC 883. For doing this we should calculate , where is the jet kinematic luminosity, and is the AGN bolometric luminosity. According to equation 6 from Merloni & Heinz (2007), can be derived from its correlation with the core radio luminosity at 5 GHz. Using our VLBI measurements (Table 3), we estimate (4.4 – 5.0) . We also know that the [Ne V] 14.32 emission line is detected in IC 883 with a flux density of W/m2 (Inami et al., 2013), i.e., with a luminosity of – not corrected for extinction. Since the [Ne V] line has an ionisation potential that is too high to be created solely by star formation, we can estimate the bolometric AGN luminosity () for the source using equation 1 from Satyapal et al. (2007), such that – . We find that the Eddington factor for the AGN in IC 883 is – , and thus, within the range of values found for low-accretion rate AGNs.
Nagar et al. (2005) found that the primary accretion energy output for LLAGNs with a compact radio core is . However, in the case of IC 883 we find that is the main contributor to the emitted luminosity. This could indicate that either the mass of the black hole based on the stellar mass of the surrounding bulge has been underestimated and/or the [Ne V] luminosity has an important contribution from a young starburst with a significant population of massive stars (Wolf-Rayet or O-type stars), as might be the case in optically classified starbursts (Abel & Satyapal, 2008). We note, however, that the values we find for and fit better within the distribution of normal AGNs rather than within the LLAGN category, whereas when looking at the distribution in terms of the Eddington factor vs. , IC 883 falls at the limit between LLAGNs and normal AGNs (figure 1 in Elitzur & Ho, 2009). This apparent discrepancy might be related to the fact that IC 883 is an advanced merger in its transition to become an AGN dominated source.
Radio observations provide solid evidence for the presence of an AGN, and it is thus reasonable to look for an X-ray counterpart, although as in the case of other LIRGs, the AGN in IC 883 might be highly obscured (e.g., Teng et al., 2015) thus hindering the detection of an AGN contribution at energies lower than 10 keV. Using the value we have estimated from the bulge-mass relationship, we can infer the X-ray luminosity of the AGN by means of the fundamental plane of BH activity (Merloni et al., 2003, equation 5). We obtain – , which is significantly larger than the total observed luminosity. One plausible explanation is that the AGN is obscured by Compton-thick ( cm-2) material, as has been suggested previously by Zauderer et al. (2016) based on the observed high column densities, and by Asmus et al. (2015) based on the Mid-IR–X-ray correlation. Assuming a column density of cm-2, the AGN observed luminosity would decrease down to . This corresponds to a very obscured AGN contributing 10 per cent of the total observed X-ray luminosity we reported in §3.6. Compton-thick AGNs are rather common in the local Universe, and are believed to represent 20–30 per cent of the whole AGN population (Burlon et al., 2011; Ricci et al., 2015). Hence, observations at energies keV can help to unveil a heavily obscured AGN in the system, as done for NGC 6286 (Ricci et al., 2016).
It is possible now to calculate the IR luminosity of the dust around the AGN from the unobscured 2–10 keV luminosity. For this, we use the empirical relationship for the AGN thermal emission presented by Mullaney et al. (2011). We obtain a luminosity of – 2.5. Comparing this value with the IR luminosity of the system (), we find that the AGN contribution to the total IR luminosity is below two per cent, consistent with the SED fitting presented in Paper I.
4.6 The starburst-AGN connection
The properties that the AGN in IC 883 has in common with GPS sources are indicative of a short age ( yr). If the AGN in IC 883 was more powerful in the past and produced kpc-scale jets, we should be able to detect them in the MHz regime with e.g., the LOw Fequency ARray (LOFAR). Shulevski et al. (2015) reported the case of a radio galaxy within the Abell 407 cluster, which is characterised by a steep spectrum all the way from MHz to a few GHz in frequency and displays kpc-scale radio lobes, and thus shows evidence for past AGN activity. Indeed, GPS sources have rarely been found in connection with relic emission (Orienti, 2015). The observed GPS-like spectrum in IC 883, highly inverted at low frequencies, and the absence of large scale jet emission, indicate that this scenario is not plausible and the GPS-like core should be young. This would also explain why we do not see more evidence of it at other wavelengths. For instance, Stierwalt et al. (2013) argued that there is a delay of a few hundred million years for the AGN to dominate the mid-IR emission after the merger has taken place.
The AGN is apparently in an early stage in its evolution, in agreement with a GPS scenario. From the infrared SED fitting in Paper I, the age of the starburst would be 55 Myr. Although estimates of starburst age from radiative transfer model fits to the infrared SED are uncertain, we note that the Mid-IR spectrum displays very strong PAH features which in the Efstathiou et al. (2000) model is an indication of a fairly old age. This agrees well with the lack of a dense molcular gas component reported by Papadopoulos et al. (2014). The starburst is thus much older than the putative age of the AGN core, and therefore, it is reasonable to assume at least that the AGN did not trigger the starburst.
5 Conclusions
We performed three yearly epochs of multi-frequency EVN observations toward IC 883. Our mas resolution observations at 8.4 GHz reveal for the first time a core-jet morphology in the nucleus of IC 883. The parsec-scale jet is subluminal (0.6–1 ), similar to those found in other LLAGNs. However, IC 883 displays more properties in common with normal AGNs.
X-ray analysis is inconclusive about the origin of this emission, either AGN or SF. To estimate the contribution of an AGN to the X-ray luminosity, we resort to the use of the black hole mass obtained by means of its correlation with the mass of the bulge. We estimated . This is only slightly less massive than the radio-loud AGN in the host of the second closest GPS source (IC 1459; Tingay & Edwards, 2015). Plugging in the value in the fundamental plane of BH activity, we find that the AGN in IC 883 would have a – , with a contribution to the observed luminosity down to ten per cent if it is a Compton-thick AGN, as is likely the case. Observations at higher energies are needed to corroborate our estimates.
The star formation is clearly powering the energetics of IC 883 at all wavelengths, with the AGN contributing only less than two per cent of the total IR luminosity. At radio wavelengths however, an AGN is dominating the nuclear emission. The apparent discrepancies among the interpretation of different diagnostic tools could simply be pointing to the transitional nature of IC 883 from a very active star formation phase, to an AGN dominated one which at the moment is presumably in an early phase.
The radio SED of the IC 883 core is characterised by a highly inverted spectral index () with a turnover at low frequencies ( GHz). This fact, together with the compactness of the nucleus, make IC 883 a candidate for a GPS source embedded in an advanced merger which remarkably is still actively forming stars. Based on its radio luminosity and linear size, we determine a magnetic field strength of mG, which agrees with typical values for GPS sources, but being significantly larger than for advanced mergers. Correspondingly, we estimate an approximate age for the source of 3 yr. Together with the galaxies studied by Tingay et al. (2003), IC 883 is potentially one of the nearest and youngest GPS galaxies and by far the least luminous one, being three orders of magnitude less luminous than is typical.
From the available observations, we infer that the radio SED of the IC 883 core is quite flat over a wide frequency range (8.4 – 32.5 GHz). IC 883 could then be classified as a mere flat-spectrum source rather than a GPS (Snellen et al., 1999). However, the flat-spectrum sources to which Snellen et al. refer are quasars and BL LACs, which are known to be highly variable. In this case, although there is some flux density variability, the spectrum is quite similar in both 2013 and 2014. We note that Torniainen et al. (2005) sampled the SED of several bona-fide GPS sources and candidates and found at least two within the GPS category which show flat spectral indices over a wide frequency range, similar to what IC 883 is displaying. The sampling of the SED at higher frequencies is certainly missing and currently there is no available information on the optically-thin part of the spectrum. Once this is attained, we will be able to confirm or rule out the GPS nature of the IC 883 core.
Optical imaging has proved that there must be a relation between merging/interacting systems and GPS sources (Stanghellini et al., 1993). However, it is rather uncommon that GPS sources are hosted by active star-forming galaxies. In fact, there is to our knowledge only one more case in the literature. Norris et al. (2012) reported on a radio-loud AGN with kpc-scale jets and radio spectra similar to that of GPS sources, embedded in a star-forming ULIRG. IC 883 is also hosted by a LIRG galaxy, but remains the least luminous GPS source, and the youngest one ever found in a very active star forming environment. GPS sources have been more easily identified at high redshifts and current samples are biased toward high luminosity sources (O’Dea, 1998). The low-luminosity population remains relatively unknown and poorly sampled.
Our study thus opens a new window to investigate the physical environments of low-luminosity, young GPS sources, which can potentially be a numerous population among LIRGs in an advanced merger stage, but have so far been missed presumably owing to the lack of high-resolution, high-sensitivity radio data.
Acknowledgements
The authors thank George Privon and José Luis Prieto for constructive comments on the manuscript, Xian Chen and Mar Mezcua for insightful discussions, and the anonymous referee for providing detailed comments that have improved our manuscript. We acknowledge financial support by the Ministry of Economy, Development, and Tourism’s Millennium Science Initiative through grant IC120009, awarded to The Millennium Institute of Astrophysics, MAS, Chile (CR-C, FEB), from CONICYT through FONDECYT grants 3150238 (CR-C), 1140304 (PA), 1141218 and 1151408, from the CONICYT-Chile grants “EMBIGGEN” Anillo ACT1101, Basal-CATA PFB–06/2007 and the China-CONICYT fellowship (CR, FEB), as well as funding from the Spanish Ministry of Economy and Competitiveness under grants AYA2012-38491-CO2-02 and AYA2015-63939-C2-1-P, which are partly funded by the FEDER programme (AA, MAP-T, RH-I). The European VLBI Network is a joint facility of independent European, African, Asian, and North American radio astronomy institutes. Scientific results from data presented in this publication are derived from the EVN project code ER030. The research leading to these results has received funding from the European Commission Seventh Framework Programme (FP/2007-2013) under grant agreement No. 283393 (RadioNet3). The National Radio Astronomy Observatory is a facility of the National Science Foundation operated under cooperative agreement by Associated Universities, Inc.
References
- Abel & Satyapal (2008) Abel N. P., Satyapal S., 2008, ApJ, 678, 686
- Argo et al. (2015) Argo M. K., van Bemmel I. M., Connolly S. D., Beswick R. J., 2015, MNRAS, 452, 1081
- Armus et al. (2009) Armus L., Mazzarella J. M., Evans A. S., et al., 2009, PASP, 121, 559
- Asmus et al. (2015) Asmus D., Gandhi P., Hönig S. F., Smette A., Duschl W. J., 2015, MNRAS, 454, 766
- Barcos-Muñoz et al. (2016) Barcos-Muñoz L., Leroy A., Evans A., et al., 2016, in The Interplay between Local and Global Processes in Galaxies,
- Beck & Krause (2005) Beck R., Krause M., 2005, Astronomische Nachrichten, 326, 414
- Bicknell et al. (1997) Bicknell G. V., Dopita M. A., O’Dea C. P. O., 1997, ApJ, 485, 112
- Bicknell et al. (2003) Bicknell G. V., Saxton C. J., Sutherland R. S., Midgley S., Wagner S. J., 2003, New Astronomy Reviews, 47, 537
- Burlon et al. (2011) Burlon D., Ajello M., Greiner J., Comastri A., Merloni A., Gehrels N., 2011, ApJ, 728, 58
- Callingham et al. (2015) Callingham J. R., Gaensler B. M., Ekers R. D., et al., 2015, ApJ, 809, 168
- Carrera et al. (2007) Carrera F. J., Ebrero J., Mateos S., et al., 2007, A&A, 469, 27
- Clemens & Alexander (2004) Clemens M. S., Alexander P., 2004, MNRAS, 350, 66
- Condon (1992) Condon J. J., 1992, Annual Review of Astron and Astrophys, 30, 575
- Condon et al. (1991) Condon J. J., Huang Z.-P., Yin Q. F., Thuan T. X., 1991, ApJ, 378, 65
- Conway (1999) Conway J. E., 1999, New Astronomy Reviews, 43, 509
- de Vries et al. (1997) de Vries W. H., Barthel P. D., O’Dea C. P., 1997, A&A, 321, 105
- Di Matteo et al. (2007) Di Matteo P., Combes F., Melchior A.-L., Semelin B., 2007, A&A, 468, 61
- Downes & Solomon (1998) Downes D., Solomon P. M., 1998, ApJ, 507, 615
- Drzazga et al. (2011) Drzazga R. T., Chyży K. T., Jurusik W., Wiórkiewicz K., 2011, A&A, 533, A22
- Dudik et al. (2009) Dudik R. P., Satyapal S., Marcu D., 2009, ApJ, 691, 1501
- Efstathiou et al. (2000) Efstathiou A., Rowan-Robinson M., Siebenmorgen R., 2000, MNRAS, 313, 734
- Elitzur & Ho (2009) Elitzur M., Ho L. C., 2009, ApJ, 701, L91
- Fanali et al. (2013) Fanali R., Caccianiga A., Severgnini P., et al., 2013, MNRAS, 433, 648
- Garmire et al. (2003) Garmire G. P., Bautz M. W., Ford P. G., Nousek J. A., Ricker Jr. G. R., 2003, in X-Ray and Gamma-Ray Telescopes and Instruments for Astronomy., edited by J. E. Truemper, H. D. Tananbaum, vol. 4851 of Proc. SPIE, 28–44
- Hancock et al. (2009) Hancock P. J., Tingay S. J., Sadler E. M., Phillips C., Deller A. T., 2009, MNRAS, 397, 2030
- Hopkins et al. (2006) Hopkins P. F., Hernquist L., Cox T. J., Di Matteo T., Robertson B., Springel V., 2006, ApJS, 163, 1
- Inami et al. (2013) Inami H., Armus L., Charmandaris V., et al., 2013, ApJ, 777, 156
- Iwasawa et al. (2011) Iwasawa K., Sanders D. B., Teng S. H., et al., 2011, A&A, 529, A106
- Jansen et al. (2001) Jansen F., Lumb D., Altieri B., et al., 2001, A&A, 365, L1
- Kankare et al. (2012) Kankare E., Mattila S., Ryder S., et al., 2012, ApJ, 744, L19
- Kormendy & Ho (2013) Kormendy J., Ho L. C., 2013, Annual Review of Astron and Astrophys, 51, 511
- Lonsdale et al. (1993) Lonsdale C. J., Smith H. J., Lonsdale C. J., 1993, ApJ, 405, L9
- McMullin et al. (2007) McMullin J. P., Waters B., Schiebel D., Young W., Golap K., 2007, in Astronomical Data Analysis Software and Systems XVI, edited by R. A. Shaw, F. Hill, D. J. Bell, vol. 376 of Astronomical Society of the Pacific Conference Series, 127
- Merloni & Heinz (2007) Merloni A., Heinz S., 2007, MNRAS, 381, 589
- Merloni et al. (2003) Merloni A., Heinz S., di Matteo T., 2003, MNRAS, 345, 1057
- Mezcua & Prieto (2014) Mezcua M., Prieto M. A., 2014, ApJ, 787, 62
- Modica et al. (2012) Modica F., Vavilkin T., Evans A. S., et al., 2012, AJ, 143, 16
- Momjian et al. (2003) Momjian E., Romney J. D., Carilli C. L., Troland T. H., Taylor G. B., 2003, ApJ, 587, 160
- Mullaney et al. (2011) Mullaney J. R., Alexander D. M., Goulding A. D., Hickox R. C., 2011, MNRAS, 414, 1082
- Murgia (2003) Murgia M., 2003, Publ. Astron. Soc. Australia, 20, 19
- Nagar et al. (2005) Nagar N. M., Falcke H., Wilson A. S., 2005, A&A, 435, 521
- Nagar et al. (2002a) Nagar N. M., Falcke H., Wilson A. S., Ulvestad J. S., 2002a, A&A, 392, 53
- Nagar et al. (2002b) Nagar N. M., Wilson A. S., Falcke H., Ulvestad J. S., Mundell C. G., 2002b, in Issues in Unification of Active Galactic Nuclei, edited by R. Maiolino, A. Marconi, N. Nagar, vol. 258 of Astronomical Society of the Pacific Conference Series, 171
- Norris et al. (2012) Norris R. P., Lenc E., Roy A. L., Spoon H., 2012, MNRAS, 422, 1453
- O’Dea (1998) O’Dea C. P., 1998, PASP, 110, 493
- O’Dea et al. (1991) O’Dea C. P., Baum S. A., Stanghellini C., 1991, ApJ, 380, 66
- Orienti (2015) Orienti M., 2015, ArXiv e-prints
- Pacholczyk (1970) Pacholczyk A. G., 1970, Radio Astrophysics: Nonthermal processes in galactic and extragalactic sources, W. H. Freeman and Company
- Papadopoulos et al. (2014) Papadopoulos P. P., Zhang Z.-Y., Xilouris E. M., et al., 2014, ApJ, 788, 153
- Parra et al. (2010) Parra R., Conway J. E., Aalto S., et al., 2010, ApJ, 720, 555
- Polatidis & Conway (2003) Polatidis A. G., Conway J. E., 2003, Publ. Astron. Soc. Australia, 20, 69
- Ranalli et al. (2003) Ranalli P., Comastri A., Setti G., 2003, A&A, 399, 39
- Ricci et al. (2016) Ricci C., Bauer F. E., Treister E., et al., 2016, ApJ, 819, 4
- Ricci et al. (2015) Ricci C., Ueda Y., Koss M. J., Trakhtenbrot B., Bauer F. E., Gandhi P., 2015, ApJ, 815, L13
- Rich et al. (2014) Rich J. A., Kewley L. J., Dopita M. A., 2014, ApJ, 781, L12
- Romero-Cañizales et al. (2012a) Romero-Cañizales C., Pérez-Torres M. Á., Alberdi A., 2012a, MNRAS, 422, 510
- Romero-Cañizales et al. (2012b) Romero-Cañizales C., Pérez-Torres M. A., Alberdi A., et al., 2012b, A&A, 543, A72
- Rothberg & Joseph (2006) Rothberg B., Joseph R. D., 2006, AJ, 131, 185
- Sanders et al. (2003) Sanders D. B., Mazzarella J. M., Kim D.-C., Surace J. A., Soifer B. T., 2003, AJ, 126, 1607
- Sanders & Mirabel (1996) Sanders D. B., Mirabel I. F., 1996, Annual Review of Astron and Astrophys, 34, 749
- Satyapal et al. (2007) Satyapal S., Vega D., Heckman T., O’Halloran B., Dudik R., 2007, ApJ, 663, L9
- Scoville et al. (2000) Scoville N. Z., Evans A. S., Thompson R., et al., 2000, AJ, 119, 991
- Shepherd et al. (1995) Shepherd M. C., Pearson T. J., Taylor G. B., 1995, in Bulletin of the American Astronomical Society, edited by B. J. Butler & D. O. Muhleman, vol. 27 of Bulletin of the American Astronomical Society, 903–+
- Shulevski et al. (2015) Shulevski A., Morganti R., Barthel P. D., et al., 2015, A&A, 579, A27
- Smith et al. (1995) Smith D. A., Herter T., Haynes M. P., Beichman C. A., Gautier III T. N., 1995, ApJ, 439, 623
- Smith et al. (1998) Smith H. E., Lonsdale C. J., Lonsdale C. J., 1998, ApJ, 492, 137
- Smith et al. (2001) Smith R. K., Brickhouse N. S., Liedahl D. A., Raymond J. C., 2001, ApJ, 556, L91
- Snellen (2009) Snellen I., 2009, in Approaching Micro-Arcsecond Resolution with VSOP-2: Astrophysics and Technologies, edited by Y. Hagiwara, E. Fomalont, M. Tsuboi, M. Yasuhiro, vol. 402 of Astronomical Society of the Pacific Conference Series, 221
- Snellen et al. (1999) Snellen I. A. G., Schilizzi R. T., Miley G. K., Bremer M. N., Röttgering H. J. A., van Langevelde H. J., 1999, New Astronomy Reviews, 43, 675
- Snellen et al. (2000) Snellen I. A. G., Schilizzi R. T., Miley G. K., de Bruyn A. G., Bremer M. N., Röttgering H. J. A., 2000, MNRAS, 319, 445
- Spoon et al. (2007) Spoon H. W. W., Marshall J. A., Houck J. R., et al., 2007, ApJ, 654, L49
- Stanghellini et al. (1993) Stanghellini C., O’Dea C. P., Baum S. A., Laurikainen E., 1993, ApJS, 88, 1
- Stickley & Canalizo (2014) Stickley N. R., Canalizo G., 2014, ApJ, 786, 12
- Stierwalt et al. (2013) Stierwalt S., Armus L., Surace J. A., et al., 2013, ApJS, 206, 1
- Strüder et al. (2001) Strüder L., Briel U., Dennerl K., et al., 2001, A&A, 365, L18
- Teng et al. (2015) Teng S. H., Rigby J. R., Stern D., et al., 2015, ApJ, 814, 56
- Tingay & Edwards (2015) Tingay S. J., Edwards P. G., 2015, MNRAS, 448, 252
- Tingay et al. (2003) Tingay S. J., Edwards P. G., Tzioumis A. K., 2003, MNRAS, 346, 327
- Tingay et al. (1997) Tingay S. J., Jauncey D. L., Reynolds J. E., et al., 1997, AJ, 113, 2025
- Torniainen et al. (2005) Torniainen I., Tornikoski M., Teräsranta H., Aller M. F., Aller H. D., 2005, A&A, 435, 839
- Turner et al. (2001) Turner M. J. L., Abbey A., Arnaud M., et al., 2001, A&A, 365, L27
- Tyul’Bashev (2001) Tyul’Bashev S. A., 2001, Astronomy Reports, 45, 428
- van der Laan & Perola (1969) van der Laan H., Perola G. C., 1969, A&A, 3, 468
- Veilleux et al. (1995) Veilleux S., Kim D.-C., Sanders D. B., Mazzarella J. M., Soifer B. T., 1995, ApJS, 98, 171
- Wang et al. (2004) Wang Z., Fazio G. G., Ashby M. L. N., et al., 2004, ApJS, 154, 193
- Weisskopf et al. (2000) Weisskopf M. C., Tananbaum H. D., Van Speybroeck L. P., O’Dell S. L., 2000, in X-Ray Optics, Instruments, and Missions III, edited by J. E. Truemper, B. Aschenbach, vol. 4012 of Proc. SPIE, 2–16
- Wilms et al. (2000) Wilms J., Allen A., McCray R., 2000, ApJ, 542, 914
- Yuan et al. (2010) Yuan T.-T., Kewley L. J., Sanders D. B., 2010, ApJ, 709, 884
- Zauderer et al. (2016) Zauderer B. A., Bolatto A. D., Vogel S. N., et al., 2016, AJ, 151, 18