Low temperature features in the heat capacity of unary metals and intermetallics for the example of bulk aluminum and Al3Sc
Abstract
We explore the competition and coupling of vibrational and electronic contributions to the heat capacity of Al and Al3Sc at temperatures below 50 K combining experimental calorimetry with highly converged finite temperature density functional theory calculations. We find that semilocal exchange correlation functionals accurately describe the rich feature set observed for these temperatures, including electron-phonon coupling. Using different representations of the heat capacity, we are therefore able to identify and explain deviations from the Debye behaviour in the low-temperature limit and in the temperature regime 30 – 50 K as well as the reduction of these features due to the addition of Sc.
pacs:
31.15.A, 71.15.MbI Introduction
The heat capacity is one of the key physical quantities in materials research, since it can be directly measured and has a significant technological and scientific impact. It is crucial to determine the onset of phase transitions PhaseTransition1 ; PhaseTransition2 and to construct thermodynamic data bases (e.g., using the CALPHAD techniqueKaufman ), to evaluate magnetocaloric effects Magnetocaloric1 ; Magnetocaloric2 , as well as for applications in microelectronics Microelectronics1 and modern battery materials Lithiumion1 . Computing the heat capacity and understanding its generic features requires an accurate determination of the temperature dependence of all relevant excitation mechanisms such as atomic vibrations, electronic excitations and the coupling between them.
Recent advances in finite-temperature first-principles calculations have led to an accurate description of key thermodynamic quantities of a broad range of material systems OzoAsta2001solvus ; FritzIron2012 ; Previous12 ; Previous7 ; ZugangMao2011 ; quasiharm1 ; quasiharm2 ; quasiharm3 ; BiswanathPRL . With the ab initio computed Gibbs energy surface at hand, all measurable thermodynamic properties such as e.g. thermal expansion or temperature dependent elastic constants for a given compound can be accessed. Out of this set, the heat capacity is particularly sensitive to fine details in the excitation mechanisms, since it is a second derivative of the Gibbs free energy. Special care is required at low temperatures – as demonstrated in the present work – where only the consideration of with allows a full evaluation of thermodynamic contributions to the heat capacity in non-magnetic metalsfootnoteMagnetic and alloys.
The Debye model is commonly used to describe the temperature dependence of the heat capacity of materials at , ( : Debye temperature). According to this model the heat capacity should exhibit a dependence. Experimentally, however, in many metals deviations from the behaviour are observed at temperatures below 50 K. These deviations can be attributed to the realistic phonon dispersion as well as to electronic excitations close to the Fermi surface KittelBook ; IIScBook ; AlumCP4K . Recent finite-temperature density functional theory (DFT) calculations have indeed shown the importance of electronic contributions to the heat capacity for various metals Previous1 ; Previous2 ; Previous3 ; Previous4 ; Previous5 ; Previous6 ; Previous7 ; Previous8 ; Previous9 ; Previous10 ; Previous11 ; Previous12 ; Previous13 ; Previous14 . In all these works, however, the focus was on the high temperature regime (), where the importance of the electronic contributions also intuitively seems to be highest. While temperature effects well below are small on an absolute scale and have thus little effect on materials properties, analyzing the asymptotic behavior of the heat capacity towards absolute zero promises detailed insights into the various excitation mechanisms. The careful analysis of the low-temperature regime, both with respect to the methodological tools as well to the physical phenomena, is therefore in the focus of the present study.
Expressing calorimetric data solely as a sum of a vibrational phonon contribution (cubic in ) and an electronic contribution (linear in ) KittelBook ; IIScBook neglects couplings between these excitation mechanisms. The interplay between electronic and vibrational degrees of freedom yields adiabatic as well as non-adiabatic corrections. The impact of electronic temperature on the interatomic forces and thus on phonon energies is typically added to the adabiatic part. The term “electron-phonon coupling” is (in the context of perturbation theory) reserved for transition probabilities between electronic states due to ionic displacements BWC06 . It is described within the Eliashberg theory by a coupling strength, which rescales the electronic heat capacity by a mass enhancement parameterBWC06 ; BSP98 ; Gri76 ; HEC02 ; SS96 . It is directly related to the phonon linewidth arising from interactions with electronsBSP98 . While electron-phonon coupling is an established concept in the field of superconductivity, it is rarely discussed in calorimetry. Only few studies used this contribution to explain observed deviations in heat capacity measurements of simple metals when using only the two adiabatic contributions. In contrast to the present study the focus in these works was on temperatures well above the Debye temperature LIN ; WSB16 . Though it is mathematically clear that the linear (i.e. electronic) term will dominate over the cubic (i.e. vibrational) term at sufficiently low temperatures, a detailed analysis how well DFT captures this competition and the coupling of electronic and vibrational degrees of freedom at very low temperatures is currently missing. Such a benchmark is in particular important for alloys, for which low temperature experimental data are typically not readily available, making finite-temperature DFT calculations a promising tool for an accurate assessment of physical properties.
In the present work, we investigate the aforementioned deviations from the Debye behaviour in the low temperature regime within a full ab initio approach and perform experiments as a benchmark. We take pure Al and the intermetallic compound Al3Sc as prototypical systems. The Al3Sc precipitate phase is of prime importance to achieve the high mechanical strength of Al rich Al-Sc alloys and has, over the last couple of decades, enabled the impressive development of these alloys Nature1 ; Nature2 ; Parker1995 ; Drits1984 ; Elagin1992 ; Rostova2000 ; Norman1998 ; Milman2000 ; Nature3 ; Nature4 ; Harada2002 ; Hyland1992 ; Harada2003 ; Ahmad2003 ; AstaOzo2001properties ; AstaFoiles1998 ; MarquisSeidman2001 ; MarquisAsta2006 ; DunandSeidman2008 ; OzoAsta2001solvus ; RoysetRyum2005ScinAl ; ZugangMao2011 ; ClouetMartin2005 ; ClouetSigliAstaFoiles1998 ; Saha2015 . Besides possessing a structural (fcc crystal structure) and dimensional (lattice mismatch approx. 1.6% at 0 K, decreasing with temperature) correspondence with the Al host matrix, these precipitates are coherently incorporated in the Al host matrix and homogeneously distributed resulting in a fine-grained microstructure, as well as high yield and tensile strength. Since both, Al and Al3Sc, share a common underlying face-centered cubic (fcc) lattice, with Sc substituting the corners of the conventional cubic unit cell, we can directly connect the observed changes in the heat capacity features with the chemical impact of Sc.
II Methodology
To derive the thermodynamic properties of a given material system within DFT, the Helmholtz free energy is a common starting point. For a defect free non-magnetic material, the free energy includes the following contributions,
| (1) |
where the electronic (el), quasiharmonic (qh) and the anharmonic phonon-phonon coupling (ph-ph) constitute the adiabatic approximation Previous13 , while the electron-phonon coupling (el-ph) contains also non-adiabatic contributions. The target isobaric heat capacity is derived from the free energy using the relation,
| (2) |
In the following the employed methods to calculated the different contributions to Eq. (1) are briefly discussed.
II.1 Electronic contribution
The electronic contribution , which is particularly important for the present low temperature study, is obtained following Mermin’s finite-temperature DFT formalism Mermin ; Previous13 . Its physical origin is the thermodynamic excitation of electrons close to the Fermi energy (within a range of approx. ), which yields in lowest order of the Sommerfeld expansion for the ideal Thomas Fermi gas a temperature dependenceKittelBook ; IIScBook
| (3) |
with the Sommerfeld coefficient .
The parametrization of is done as follows: Firstly, we calculate the -dependent part of by performing DFT calculations on an equidistant mesh of 11 volumes and 11 temperatures as
| (4) |
where is the total electronic free energy (including the 0 K binding energy ) obtained from a fully self-consistent DFT calculation at a finite electronic temperature corresponding to a certain Fermi smearing. To obtain a dense temperature sampling for calculating the heat capacity, we use a physically motivated fit Previous13 , , where
| (5) |
with the Fermi-Dirac distribution function and with representing an energy independent electronic density of states. The latter is used as a fitting quantity by expanding it up to a third-order polynomial in as with fitting coefficients . Next, for the parametrization of the volume dependence of , a second-order polynomial is used to fit . The volume parametrization of is rather simple as we separated out the = 0 K binding energy , which carries a stronger volume dependence (fitted by a Murnaghan equation of state Murn ). In this way a numerical error of less than 0.1 meV/atom is achieved at all temperatures and volumes. For further details, we refer to Ref. Previous13, .
II.2 Vibrational contributions
In Eq. (1), the terms and together characterize the vibrational free energy. The quasiharmonic contribution, , describes non-interacting, volume dependent phonons and can straightforwardly be calculated WallaceBook ; Previous13 . The above mentioned Debye approximation for the harmonic lattice vibrations yields the expressionKittelBook
| (6) |
for the heat capacity, which is cubic in .
To estimate the influence of electronic temperature on the phonon frequencies, we have calculated the variation of the highest optical phonon frequency for Al3Sc (marked by an orange arrow at point R in Fig. 5c) with the Fermi smearing width ranging from 0.01 eV to 0.15 eV (120 K – 1740 K). The variation of this phonon frequency is on the order of THz, which corresponds to an energy change of meV. We have determined the impact of the resulting temperature dependence on the heat capacity and found it to be an order of magnitude smaller than the contribution of .
In addition we have calculated the modification of the heat capacity due to explicitly anharmonic vibrations caused by phonon-phonon interaction. In accordance with previous studiesPrevious8 , this effect also turns out to be negligible for the temperature regime investigated in this work ( K). Having in mind that already the quasiharmonic contribution is for the critical temperature regime ( K) much smaller than the electronic contribution , we do not include the modification of lattice vibrations due to electronic temperature or phonon-phonon interaction in the upcoming discussion.
II.3 Electron-phonon coupling
The electron-phonon coupling has been shown Gri76 to be crucial at very low temperatures (typically 0.1–4 K) for describing the deviation of the electronic heat capacity from the linear temperature dependence according to Eq. (3) that is solely captured by the Sommerfeld coefficient . Considering the coupling, the electronic heat capacity is written as
| (7) |
where is the dimensionless electron-phonon coupling parameter. This parameter is formally defined as the first reciprocal moment of the Eliashberg spectral functionBSP98 ; Gri76 ; HEC02 ; SS96 ,
| (8) |
The Eliashberg spectral function represents the vibrational density of states (VDOS) weighted by the effective electron-phonon coupling function averaged over the Fermi surface as explained in Refs. BS54, ; SS96, ; BSP98, .
Physically, it quantifies the contribution of phonons with frequency to the scattering process of electrons at the Fermi levelBSP98 . The energy changes due to this coupling can be obtained from diagrammatic perturbation theory. The resulting temperature dependence is mainly determined by a product of Fermi distribution and Bose-Einstein distribution functions. In the low temperature limit, however, only the independent zero point vibrations are relevantBS54 ; BWC06 , yielding an overall linear dependence of similar to the Sommerfeld expansion. Further studiesLIN ; WSB16 demonstrate that the coupling affects electronic and vibrational degrees of freedom simultaneously.
II.4 Computational Details
Total energy and force calculations are performed for a fcc supercell within the projector-augmented wave (PAW) methodPAW as implemented in the Vienna Ab Initio Simulation Package (vasp) Kresse1993 ; Kresse1996 . The generalized gradient approximation (GGA) as parameterized by Perdew-Burke-Ernzerhof (PBE)PBE is used for the exchange-correlation functional. In the case of Al, a comparison with the local density approximation (LDA) has been done to estimate the impact which the choice of the exchange-correlation functional has on the results. As discussed in previous studiesPrevious7 these deviations can be used as an approximate DFT error bar.
The phonon calculations are performed employing the small displacement methodKresseSmallDisplacement1995 ; Previous13 with a displacement value of 0.02 Bohr radius ( 0.01Å). The small value ensures that the forces on all the atoms within the given supercell vary linearly with the displacement. After performing convergence tests, a plane-wave energy cutoff Ecut = 400 eV is used. The Monkhorst-Pack scheme Monkhorst1976 for the sampling of the Brillouin zone (BZ) is chosen, with a reciprocal-space -mesh of grid points. An energy of eV is used as a convergence criterion for the self-consistent electronic loop. A Methfessel-Paxton schemeMP with a width of 0.15 eV is used for the force calculations entering the dynamical matrix.
The frequencies needed to calculate are generated by sampling the complete BZ using a q-mesh of grid points. A relative shift of with respect to the point is introduced. This is important for the calculation of the heat capacity in the limit 0 K, where only the modes in the vicinity of the point are excited, while the point itself needs to be excluded from the partition sum due to its diverging contribution. Even with the shift an artifical dependence on the choice of -mesh employed for sampling the BZ is expected, which makes the temperature region () unreliable. We find that with a fcc supercell and an interpolation mesh of grid points with the shift, the Debye behavior is valid down to 2 K. By increasing the mesh size, for example, to one can extend the Debye behavior to below 1.8 K, but it would add to the computation time dramatically. Since deviations of the experimental data from linearity are already observed in the region between 2 K and 20 K (gray shaded regions in Figs. 3b), the lower limit of 2 K is sufficient for the purpose of the present study.
For the calculations of the electronic free energy, a Fermi smearing with a width ranging from eV to 0.137 eV is used, corresponding to a temperature range of 1-1590 K (the upper limit corresponds to the melting temperature for Al3Sc) with a mesh of 11 separate temperature values. The calculations are performed for a unit cell with a k-mesh of grid points and a plane-wave energy cutoff of 300 eV.
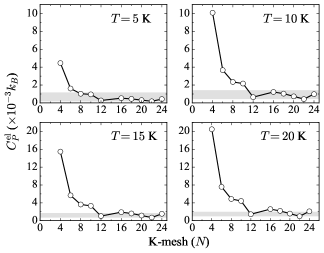
Figure 1 shows the convergence of the electronic contribution to the heat capacity with respect to the -mesh at the electronic temperature = 5, 10, 15 and 20 K. For K, for example, a mesh of at least -points is required to ensure that the error bar of is on the order of 0.001 (gray shaded regions in Fig. 1). Since the values scale with , one needs at higher temperatures larger -meshes to match the same absolute error. For the present work, we chose a mesh of -points.
The calculations to obtain the electron-phonon coupling parameter given by Eq. (8) are performed employing density functional perturbation theory (DFPT)ABINIT3 with PAW potentials (not identical to those in VASP) as implemented in the ABINIT codeABINIT1 ; ABINIT2 . For the exchange-correlation potential, we used the LDA as parametrized by Perdew and WangLDAPW , since DFPT is in ABINIT currently not implemented for GGA. The chosen values for the energy cutoff and the k-point grid are 20 Ha ( 544 eV) and , respectively. The calculations for Al3Sc are performed with the equlilibrium lattice parameter of 7.62 Bohr (4.032 Å). The LDA lattice constant obtained with VASP is 4.033 Å, i.e. almost same as the value for the ABINIT pseudopotential. The convergence criterion for the self-consistent field cycle is 10-14 Ha on the wave function squared residual.
II.5 Experimental Details
An Al3Sc ingot was prepared by induction melting and casting into a copper mold from pure Al ( wt.%) and Sc ( wt.%) under vacuum conditions in the research group of M. Rettenmayr (Otto Schott Institute of Materials Research, Friedrich-Schiller-University Jena, Germany). The ingot was re-melted several times and homogenized at C for hours.
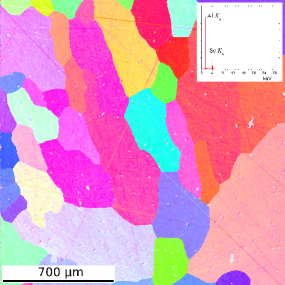
Cube-shaped samples of size mm3 were cut by spark erosion, etched, and polished. Low-temperature ( to K) heat capacity measurements were performed by a Physical Property Measurement System (PPMSTM, Quantum Design Inc.). The microstructure of the cast and annealed Al3Sc sample was checked using orientation imaging microscopy via an electron back-scatter diffraction (EBSD). A large area of was scanned with a step of (Fig. 2). The points with the confidence index smaller than 0.1 were excluded. The sample composition and homogeneity were controlled by an EDX analysis (inset Fig. 2). Small inclusions correspond to Al2Sc particles and their volume fraction is estimated to be lower than 1%.
III Results and Discussion
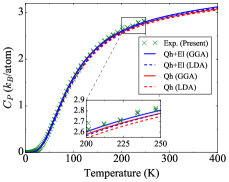
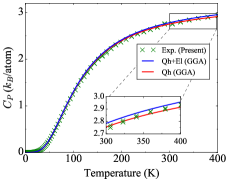
In Figs. 3a and 3d, we present our measured (green crosses) and calculated (blue lines) data for Al and Al3Sc. We find a very good agreement over the whole temperature range. The good agreement with experiment is consistent with the small deviations between LDA and GGA results, since these deviations have been empirically found Previous7 to provide for this quantity a confidence interval for the predictive power (or accuracy) of the DFT calculations.
The DFT calculations allow by construction a separation into the various free energy contributions, whereas the experimental analysis gives only access to the total response of the material. Specifically, the red curves in Figs. 3a and 3d correspond to the vibrational part as described within the quasiharmonic (Qh) approximation. The blue curves (Qh+El) show the impact of the electronic contribution which is small and of the same order as the tiny difference between theory and experiment (see inset in Fig. 3a). A similarly small electronic effect has been reported in previous DFT studies for Al Previous8 ; Previous12 ; Previous13 and Al alloys CpAlAlloys . Since the electronic contribution linearly decreases with temperature T, one would expect that it becomes even less significant at lower temperatures.
III.1 Significance of the electronic contributions
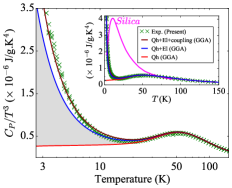
Due to the decrease of the vibrational heat capacity towards low temperatures, the standard representation chosen in the plots in Figs. 3a and 3d is not the most suitable way to visualize and discuss features in the low temperature ( K) regime. To analyze the validity of the Debye approximation, the heat capacity is often (e.g., in the literature for thermoelectric materials) renormalized with . A perfect Debye dependence (Eq. 6) would then result in a constant temperature independent behavior. Figures 3b and 3e show that the vibrational part (red curves) exhibits only a weak temperature dependence. The small deviations from are discussed in the next section. For reasons given in Sec. II.4, the heat capacity is not plotted below 2 K. We note that the experimental measurements do not follow the constant behavior below K, but rather increase sharply, therewith indicating the importance of non-vibrational, i.e. electronic excitations.
For this reason, experimental measurements are commonly fitted to the sum of two contributions to describe the temperature dependence of the heat capacity in the low temperature regime KittelBook ; IIScBook ,
| (9) |
The structure of this expression is motivated by the competition of electronic and vibrational contributions, as captured by the Sommerfeld model (3) and the Debye model (6), respectively. A straightforward approach to test the validity of Eq. (9) is to perform another renormalization of the heat capacity data, namely by plotting
| (10) |
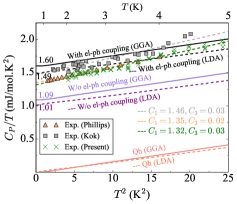
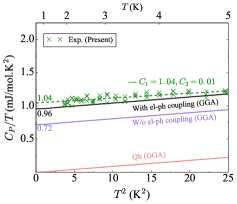
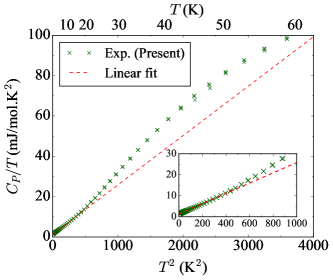
versus . As shown in Fig. 4, the experimental data show in this representation a constant slope up to approx. 20 K, i.e., up to this temperature the heat capacity is exclusively captured by a and dependence.
An advantage of the ab initio methodology is that it allows a separate discussion of the different contributions to the heat capacity as shown in Figs. 3c and 3f. If only lattice vibrations contributed to the measured heat capacity at these temperatures (red lines), would pass through the origin. As already indicated in Sec. II.2 also the impact of a finite electronic temperature on the phonons will not change this behaviour. The same applies to anharmonic lattice vibrations, since our previous calculations Previous8 for Al and our more recent resultsUpcoming_paper for Al3Sc only show a noticeable impact to the heat capacity close to the melting point.
The non-zero intercept with the -axis in Figs. 3c and 3f, which determines in (10), therefore, arises from contributions linear in . These are the electronic contribution and the electron-phonon coupling (7). We will first focus on the electronic contribution. The values of the coefficient obtained on the one hand by fitting the experimental data to Eq. (10) and on the other hand by computing the electronic contribution to the heat capacity are 1.04 and 0.72 mJ mol-1K-2 for Al3Sc and 1.32-1.46 and 1.09 mJ mol-1K-2 for Al, respectively. The spread in the experimental data for the value of Al reflects the scatter in the available literatureCpAl_Phillips ; CpAl_Kok . The sizeable difference between the experimental and theoretical indicates that electron-phonon coupling in Eq. (7) cannot be neglected. Thus, is not only determined by the Sommerfeld coefficient , but also by the coupling parameter . For Al (Fig. 3c), we have therefore computed the electron-phonon coupling and have determined the value 0.47 for , in good agreement with the reported values for Al that range from 0.38 to 0.45SS96 ; Lambda_Al2 ; Lambda_Al3 . Using our value in Eq. (7) we get mJ mol-1 K-2 . This result agrees well with the experimental values (1.32-1.46 mJ mol-1 K-2)CpAl_Phillips ; CpAl_Kok . In the case of Al3Sc (Fig. 3f) the calculation yields (for Al3Sc there exists no published data) corresponding to mJ mol-1 K-2 and showing again a good agreement with the experimental value of 1.04 mJ mol-1K-2.
We can now revisit Figs. 3b and 3e. Taking in addition to the vibrational contribution (red lines) also the electronic contribution (blue curves) into consideration, we observe that the ab initio determined heat capacity agrees qualitatively as well as quantitatively well with the experiments. Based on the insights obtained with Figs. 3c and 3f, we can now conclude that the experimental data in the plot below 5 K corresponds to a behaviour, i.e. . This is to a large extend captured by the electronic contribution to . Taking in addition the electron-phonon coupling into account (brown lines), further improves the agreement with experiment. The latter contribution affects typically in the temperature range between 0.1-4 KGri76 ; LIN . Due to the observed linearity in the versus representation in Fig. 4, however, we consider a temperature range up to 20 K for the electron-phonon coupling in Figs. 3b and 3e.
As mentioned before, the fcc crystal structure is common to both Al and Al3Sc phases where the Sc atoms replace the Al atoms on the corner sublattice sites resulting in the L12 Al3Sc phase. Comparing the above discussed features for Al and Al3Sc (Fig. 3: all subplots are provided on the same scales), we observe that the impact of the electronic contribution and the electron-phonon coupling strength is reduced compared to that of pure Al. This is in contrast to estimates in the literature, according to which the coupling constant of an alloy can be approximated by the concentration-weighted average of the coupling constants of the individual elementsWSB16 ; Sac80 (compare for Al3Sc with 0.47 for Al and 0.68 for ScSA12 ). The reason why this approach fails for Al3Sc is the reduced density of states at the Fermi level in Al3Sc compared to that of the pure metals and in particular Al. This reduces the number of partially occupied electronic states and thus the electronic entropy. The reduced density is the origin and driving force behind the energetic stability of this intermetallic compound, i.e., the failing of the averaging approach is a direct consequence of the fact that the electronic structure of the alloy cannot be regarded as small perturbation compared to the pure compounds. Since the same argument is expected to apply to any intermetallic compound, the average concept developed for alloysSac80 ; WSB16 cannot be extended to ordered compounds.
III.2 Non-Debye behaviour in the heat capacity
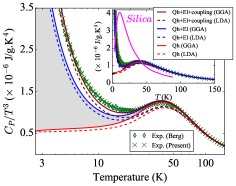
In addition to features below 20 K, we observe in the renormalized heat capacity () plots (insets in Figs. 3b and 3e) maxima at approx. 40 K for Al and 50 K for Al3Sc. At these temperatures the electronic contribution is already negligible and the Debye model would result in a constant line, i.e., the origin of these maxima must be related to an excess vibrational density of states (VDOS). Such maxima in are extensively discussed in the amorphous materials community Boson1 ; Boson2 ; Boson3 ; Boson4 ; Boson5 (e.g., for silica) and are called boson peak. In contrast to the maxima we observe here, the peaks found for amorphous materials are much sharper (magenta curve with a maxima at around 15 K in insets of Figs. 3b and 3e) and are associated with localization phenomena (e.g., short range order) that shift the van Hove singularities to the low-frequency regime (close to 1 THz).
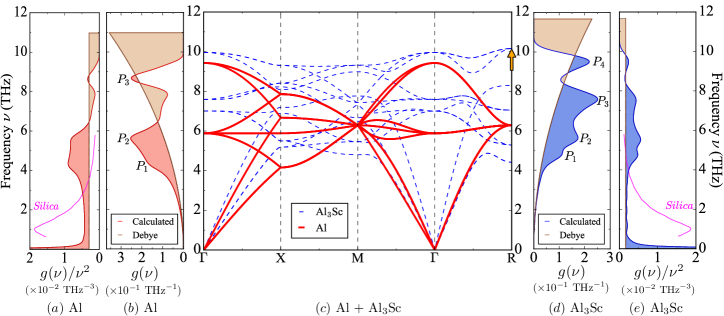
In the crystalline and perfectly ordered materials investigated by us, the non-Debye behaviour in Figs. 3b and 3e has a different physical origin BosonCrystalline1 ; BosonCrystalline2 ; BKA16 . To show this, we first provide the phonon spectra of Al and Al3Sc (Fig. 5c), plotted in the same BZ belonging to the L12 phase. The spectra are used to calculate the VDOS of Al and Al3Sc (Figs. 5b and 5d). In addition, we provide the Debye VDOSMaradudin (brown solid curves in Figs. 5b and 5d) as with the Debye frequency . Here, and are the transverse and the longitudinal velocities of sound for metals calculated from the corresponding acoustic phonon branches close to the point and is the atomic concentration. Comparing the calculated and the Debye VDOS (in Figs. 5b and 5d), we notice two profound peaks ( and ) between 4-6 THz as well as additional peaks at higher frequencies that are characterized by an excess DOS over the Debye value. At the same time, Figs. 5a and 5e compare the reduced VDOS () of Al and Al3Sc with that of silica for which we notice a sharp profound peak close to 1 THz.
It is difficult to experimentally resolve the effect the peaks have onto the shape of the curves, since the features are not very pronounced. In a theoretical investigation, we can analyze the heat capacity after extracting the frequency band of 4-6 THz. We use a representation of the BZ by 64 exact points (corresponding to lattice modulations fitting into a supercell) for this purpose, in order to achieve a well-defined weighting of the BZ. As illustrated in Fig. 6 (dashed orange curve), the procedure suppresses the maximum in for Al at T 40 K and creates a new relatively flat maximum at a slightly higher temperature. Flat modes in the phonon dispersion curve at higher frequencies (e.g., ) are responsible for the remaining maximum.
To see how the addition of Sc affects the non-Debye behaviour, we compare the phonon dispersions of pure Al with Al3Sc (Fig. 5c): The phonon branches in Al3Sc are higher in frequency than in Al. This is attributed to the stiffer nature of the Al-Sc bonds as compared to Al-Al bonds due to a strong hybridization between Sc and Al electron statesOzoAsta2001solvus and also reflected by a higher bulk modulus value of 85.2 GPa for Al3Sc in contrast to 74.6 GPa for Al. In addition, we observe a different relevance of flat optical branches in particular above 6 THz, yielding the peaks and in the VDOS of Al3Sc (Fig. 5d). To check the impact of these peaks onto the maxima in the heat capacity of Al3Sc, we repeated the procedure of neglecting the frequency band of 4-6 THz (which lead to and ). As shown in Fig. 6 (dashed green curve), we again observe a significant reduction in the maximum with a shift towards higher temperature as was also observed in the case of Al. Hence, the peak is less relevant than and .
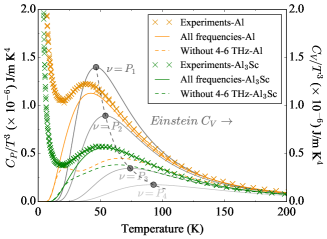
To evaluate the importance of these peaks in the VDOS, we use the Einstein model in which each phonon branch is effectively replaced by a constant single frequency and the VDOS exhibits a single discrete peak. The Einstein heat capacity is given by IIScBook ,
| (11) |
where are the number of atoms, the Boltzmann and the Planck constant, respectively. The critical temperature at which the heat capacity has a local maximum as per the Einstein model is . In Fig. 6 (fading gray curves), we plot the Einstein curves for the frequencies corresponding to and of Al3Sc (Fig. 5d). With increasing frequency (), the maximum is observed to flatten and to shift towards higher temperatures. This trend agrees with our foregoing comparison of maxima for Al and Al3Sc: The peaks in the Al3Sc VDOS are at higher frequencies (owing to stiffer phonons) than those for Al. Consequently, the maximum is flatter and observed at a slightly higher temperature than Al. Therefore, the non-Debye behaviour of crystals is mainly determined by the low-lying flat regions in the phonon spectrum, i.e. the region of 4-6 THz in Al and Al3Sc is responsible for the maxima around 40-50 K in the heat capacity. Comparing the heat capacities of Al and Al3Sc (Figs. 3b and 3e), one can notice that the maximum is less pronounced for Al3Sc and occurs at higher temperature.
IV Conclusions
Based on the insights gained in this study, we demonstrate: (i) The predictive capability of finite-temperature DFT in accurately describing the competition between electronic and vibrational heat capacity contributions in Al and Al3Sc at temperatures well below the Debye temperature, if highly converged calculations are performed. (ii) The importance of contributions beyond the adiabatic approximation, in particular of electron-phonon coupling for the correct determination of the electronic heat capacity at low temperatures. (iii) The connection of flat branches in the phonon spectrum and the observed maxima in the low-temperature heat capacity measurements that are not captured by the Debye model.
The availability of highly accurate DFT computed heat capacities including the partition in the various entropic contributions allowed a detailed analysis about the validity of approximate but commonly applied physical models such as Sommerfeld theory or Debye model. To visualize and discuss the relevant low temperature features we considered various renormalized transformations.
The comparison of Al and Al3Sc reveals that the observed deviations from the Debye behaviour at low temperatures are particularly strong in the pure element Al. The addition of 25 at.% Sc to Al reduces the fcc symmetry due to the L12 superstructure. Despite the higher structural complexity, however, the low-temperature features in the heat capacity become less pronounced. This is related to the higher stiffness of the Al-Sc bonds and the resulting increase of the Debye temperature. In an Al-Sc alloy that phase separates into a solid solution and Al3Sc precipitates, the thermodynamic properties at low temperatures will therefore be determined by the Al-rich matrix. While this study focussed on two example systems – fcc Al and Al3Sc – all discussions and considerations regarding the methodological approaches and the analysis of the data are general and can be directly transferred to other materials and compounds.
Acknowledgements.
The authors thank Dr. S. Lippmann and Prof. M. Rettenmayr (Otto Schott Institute of Materials Research, Friedrich-Schiller-University Jena, Germany) for fruitful discussions and support in preparation of Al3Sc samples. The authors are also grateful to Prof. M. W. Finnis and Dr. X. Zhang for valuable discussions and suggestions. Financial support from the Deutsche Forschungsgemeinschaft (DFG) within the priority program SPP-1713 “chemomechanics” (research projects HI 1300/8-1 and DI 1419/7-1) is gratefully acknowledged.References
- (1) F. Körmann, A. Dick, B. Grabowski, B. Hallstedt, T. Hickel, and J. Neugebauer, Phys. Rev. B 78, 033102 (2008).
- (2) J.-H. Chu, J. G. Analytis, C. Kucharczyk, and I. R. Fisher, Phys. Rev. B 79, 014506 (2009).
- (3) L. Kaufman and H. Bernstein Computer Calculation of Phase Diagrams with Special Reference to Refractory Metals (Academic Press, 1970).
- (4) K. A. Gschneidner, Jr. and V. K. Pecharsky, Annu. Rev. Mater. Sci. 30, 387 (2000).
- (5) M. Khan, K. A. Gschneidner, Jr., and V. K. Pecharsky, J. Appl. Phys. 107, 09A904 (2010).
- (6) M. Zhang, M. Y. Efremov, F. Schiettekatte, E. A. Olson, A. T. Kwan, S. L. Lai, T. Wisleder, J. E. Greene, and L. H. Allen, Phys. Rev. B 62, 10548 (2000).
- (7) T. M. Bandhauer, S. Garimella, and T. F. Fuller, J. Electrochem. Soc. 158, R1 (2011).
- (8) V. Ozolins and M. Asta, Phys. Rev. Lett. 86, 448 (2001).
- (9) F. Körmann, A. Dick, B. Grabowski, T. Hickel, and J. Neugebauer, Phys. Rev. B 85, 125104 (2012).
- (10) A. Glensk, B. Grabowski, T. Hickel, and J. Neugebauer, PRL 114, 195901 (2015).
- (11) B. Grabowski, T. Hickel, and J. Neugebauer, Phys. Rev. B 76, 024309 (2007).
- (12) Z. Mao, W. Chen, D. N. Seidman, and C. Wolverton, Acta Materialia 59, 3012 (2001).
- (13) A. Debernardi, M. Alouani, and H. Dreyssé, Phys. Rev. B 63, 064305 (2001).
- (14) A. A. Quong and A. Y. Liu, Phys. Rev. B 56, 7767 (1997).
- (15) A. Siegel, K. Parlinski, and U. D. Wdowik, Phys. Rev. B 74, 104116 (2006).
- (16) B. Dutta, A. Cakir, C. Giacobbe, A. Al-Zubi, T. Hickel, M. Acet, and J. Neugebauer, Phys. Rev. Lett. 116, 025503 (2016).
- (17) In magnetic materials, a further contribution to the heat capacity can be observed at very low temperatures, see e.g. M. Bouvier, P. Lethuillier, D. Schmitt, Phys. Rev. B 43, 13137 (1991) and D. Kaczorowski, A. Ślebarski, Phys. Rev. B 81, 214411 (2010).
- (18) C. Kittel, Introduction to Solid State Physics (Wiley, 2004).
- (19) E. S. R. Gopal, Specific Heats at Low Temperatures (Plenum Press, New York, 1966).
- (20) N. E. Phillips, Phys. Rev. 114, 676 (1959).
- (21) R. Wang, S. Wang and X. Wu, Phys. Scr. 83, 065707 (2011).
- (22) B. Grabowski, P. Söderlind, T. Hickel, and J. Neugebauer, Phys. Rev. B 84, 214107 (2011).
- (23) Y. Wang, Z.-K. Liu and L.-Q. Chen, Acta Materialia 52, 2665 (2004).
- (24) S.-L. Shang, Y. Wang, D. Kim, and Z.-K. Liu, Comput. Mat. Science 47, 1040 (2010).
- (25) R. Arróyave and Z.-K. Liu, Phys. Rev. B 74, 174118 (2006).
- (26) O. Delaire, A. F. May, M. A. McGuire, W. D. Porter, M. S. Lucas, M. B. Stone, D. L. Abernathy, V. A. Ravi, S. A. Firdosy, and G. J. Snyder, Phys. Rev. B 80, 184302 (2009).
- (27) Y. Nie and Y. Xie, Phys. Rev. B 75, 174117 (2007).
- (28) B. Grabowski, L. Ismer, T. Hickel, and J. Neugebauer, Phys. Rev. B 79, 134106 (2009).
- (29) A. I. Duff, T. Davey, D. Korbmacher, A. Glensk, B. Grabowski, J. Neugebauer, and M. W. Finnis, Phys. Rev. B 91, 214311 (2015).
- (30) S. Shang, Y. Wang and Z.-K. Liu, Phys. Rev. B 75, 024302 (2007).
- (31) H. Zhang , S.L. Shang, Y. Wang, A. Saengdeejing, L.Q. Chen, and Z.-K. Liu, Acta Materialia 75, 4012 (2010).
- (32) T. Hickel, B. Grabowski, F. Körmann, and J. Neugebauer, J. Phys.: Condens. Matter 24 053202 (2012).
- (33) N. Bock, D.C. Wallace, and D. Coffey, Phys. Rev. B 73, 075114 (2006).
- (34) R. Bauer, A. Schmid, P. Pavone, and D. Strauch, Phys. Rev. B 57, 11276 (1998).
- (35) G. Grimvall, Phys. Scripta 14, 63 (1976).
- (36) B. Hellsing, A. Eiguren, and E. V. Chulkov, J. Phys.: Condens. Matter 14, 5959 (2002).
- (37) S. Y. Savrasov and D. Y. Savrasov, Phys. Rev. B 54, 16487 (1996).
- (38) Z. Lin, L. V. Zhigilei and V. Celli, Phys. Rev. B 77, 075133 (2008).
- (39) J. Winter, J. Sotrop, S. Borek, H.P. Huber, and J. Minár, Phys. Rev. B 93, 165119 (2016).
- (40) E. Clouet, L. Laé, T. Épicier, W. Lefebvre, M. Nastar, and A. Deschamps, Nature Materials 5, 482 (2006).
- (41) V. Radmilovic, C. Ophus, E. A. Marquis, M. D. Rossell, A. Tolley, A. Gautam, M. Asta, and U. Dahmen, Nature Materials 10, 710 (2011).
- (42) B. A. Parker, Z. F. Zhou, and P. Nolle, J. of Mat. Sci. 30 452 (1995).
- (43) M. E. Drits, J. Dutkiewicz, L. S. Toropova, and J. Salawa, Crystal Res. and Tech. 19 1325 (1984).
- (44) V. I. Elagin, V. V. Zakharov, and T. D. Rostova, Metal Sci. and Heat Treat. 34 37 (1992).
- (45) T. D. Rostova, V. G. Davydov, V. I. Yelagin, and Valerij V. Zakharov, Aluminium Alloys: Their Physical and Mechanical Properties 1-3, 793 (2000).
- (46) A.F. Norman, , P. B. Prangnell, and R. S. McEwen, Acta Mater. 46 5715 (1998).
- (47) Y. V. Milman, D. V. Lotsko, and O. I. Sirko, Aluminium Alloys: Their Physical and Mechanical Properties 1-3 1107 (2000).
- (48) P. W. Voorhees, Nature Materials 5, 435 (2015).
- (49) A. Bilić, J. D. Gale, M. A. Gibson, N. Wilson, and K. McGregor, Scientific Reports 5, (2015).
- (50) Y. Harada, and D.C. Dunand, Mat. Sci. and Engg. A 329-331 686 (2002).
- (51) R. W. Hyland, Metall. Mater. Trans. A 23 1947 (1992).
- (52) Y. Harada and D.C. Dunand, Scripta Mater. 48 219 (2003).
- (53) Z. Ahmad, JOM 55 35 (2003).
- (54) M. Asta and V. Ozolins, Phys. Rev. B 64, 094104 (2001).
- (55) M. Asta, S. M. Foiles, and A. A. Quong, Phys. Rev. B 57, 11265 (1998).
- (56) E. A. Marquis and D. N. Seidman, Acta Materialia 49, 1909 (2001).
- (57) E. A. Marquis, D. N. Seidman, M. Asta and C. Woodward, Acta Materialia 54, 119 (2006).
- (58) M. E. Krug, D. C. Dunand, and D. N. Seidman, Appl. Phys. Lett. 92, 124107 (2008).
- (59) J. Røyset and N. Ryum, International Materials Reviews 50, 19 (2005).
- (60) E. Clouet, A. Barbu, L. Laé and, G. Martin, Acta Materialia 53, 2313 (2005).
- (61) E. Clouet, M. Nastar, and C. Sigli, Phys. Rev. B 69, 064109 (2004).
- (62) S. Saha, T.Z. Todorova, and J.W. Zwanziger, Acta Materialia 89, 109 (2015).
- (63) N. D. Mermin, Phys. Rev. 137, A1441 (1965).
- (64) F.D. Murnaghan, Proc. Natl. Acad. Sci. U.S.A. 30, 244 (1944).
- (65) D. C. Wallace, Thermodynamics of Crystals (Dover, New York, 1998).
- (66) M.J. Buckingham and M.R. Schafroth, Proc. Phys. Soc. London 67, 828 (1954).
- (67) P. E. Blöchl, Phys. Rev. B 50, 17953 (1994).
- (68) G. Kresse and J. Hafner, Phys. Rev. B 47, RC558 (1993).
- (69) G. Kresse and J. Furthmüller, Phys. Rev. B 54, 11169 (1996).
- (70) J. P. Perdew, K. Burke, and M. Ernzerhof, Phys. Rev. Lett. 77, 3865 (1996).
- (71) G. Kresse, J. Furthmüller, and J. Hafner, Europhysics Letters 32, 729 (1995).
- (72) H. J. Monkhorst and J. D. Pack, Phys. Rev. B 13, 5188 (1976).
- (73) M. Methfessel and A. T. Paxton, Phys. Rev. B 40, 3616 (1989).
- (74) X. Gonze and C. Lee, Phys. Rev. B 55, 10355 (1997).
- (75) X. Gonze, J.-M. Beuken, R. Caracas, F. Detraux, M. Fuchs, G.-M. Rignanese, L. Sindic, M. Verstraete, G. Zerah, F. Jollet, M. Torrent, A. Roy, M. Mikami, Ph. Ghosez, J.-Y. Raty, and D.C. Allan, Comput. Mat. Science 25, 478 (2002).
- (76) M. Torrent, F. Jollet, F. Bottin, G. Zerah, and X. Gonze, Comput. Mat. Science 42, 337 (2008).
- (77) J. P. Perdew and Y. Wang, Phys. Rev. B 45, 13244 (1992).
- (78) R. Wang, S. Wang, X. Wu, M. Lan, and T. Song, Phys. Scr. 85, 035705 (2012).
- (79) A. Gupta, B. Tas Kavakbasi, B. Dutta, D. Korbmacher, B. Grabowski, T. Hickel, S. V. Divinski, G. Wilde, and J. Neugebauer, in preparation for submission to CALPHAD.
- (80) W. T. Berg, Phys. Rev. 167, 583 (1968).
- (81) J. Horbach, W. Kob, and K. Binder, J. Phys. Chem. B 103, 4104 (1999).
- (82) N. E. Phillips, Phys. Rev. 114, 676 (1959).
- (83) J. A. Kok and W. H. Keesom, Physica 4, 835 (1937).
- (84) W. L. McMillan, Phys. Rev. 167, 331 (1968).
- (85) R. Bauer, A. Schmid, P. Pavone, and D. Strauch, Phys. Rev. B 57, 11276 (1998).
- (86) K. Vollmayr, W. Kob, and K. Binder, Phys. Rev. B 54, 15808 (1996).
- (87) F. Sacchetti, J. Phys. F: Metal. Phys. 10, 801 (1980).
- (88) S.M. Sichkar, V.N. Antonov, phys. stat. sol. (b) 249, 2118 (2012).
- (89) S. N. Taraskin and S. R. Elliott, Phys. Rev. B 56, 8605 (1997).
- (90) P. Benassi, M. Krisch, C. Masciovecchio, V. Mazzacurati, G. Monaco, G. Ruocco, F. Sette, and R. Verbeni, Phys. Rev. Lett. 77, 3835 (1996).
- (91) U. Buchenau, M. Prager, N. Nücker, A. J. Dianoux, N. Ahmad, and W. A. Phillips, Phys. Rev. B 34, 5665 (1986).
- (92) M. Foret, E. Courtens, R. Vacher, and J.-B. Suck, Phys. Rev. Lett. 77, 3831 (1996).
- (93) A. I. Chumakov, G. Monaco, A. Monaco, W. A. Crichton, A. Bosak, R. Rüffer, A. Meyer, F. Kargl, L. Comez, D. Fioretto, H. Giefers, S. Roitsch, G. Wortmann, M. H. Manghnani, A. Hushur, Q. Williams, J. Balogh, K. Parlinśki, P. Jochym, and P. Piekarz, Phys. Rev. Lett. 106, 225501 (2011).
- (94) A. I. Chumakov, G. Monaco, X. Han, L. Xi, A. Bosak, L. Paolasini, D. Chernyshov, and V. Dyadkin, Philos. Mag. 96, 743 (2016).
- (95) T. Brink, L. Koch, K. Albe, Phys. Rev. B 94, 224203 (2016).
- (96) A. A. Maradudin, E. W. Montroll, G. H. Weiss, and I. P. Ipatova, Theory of Lattice Dynamics in the Harmonic Approximation (Academic, New York, 1963).