11email: shulevski@astron.nl 22institutetext: University of Groningen, Kapteyn Astronomical Institute, Landleven 12, 9747 AD Groningen, The Netherlands33institutetext: Obserwatorium Astronomiczne, Uniwersytet Jagielloński, ul Orla 171, 30-244, Kraków, Poland 44institutetext: IRA-INAF, via P. Gobetti 101, 40129 Bologna, Italy 55institutetext: Leiden Observatory, Leiden University, Niels Bohrweg 2, 2333 CA Leiden, The Netherlands 66institutetext: INAF-Osservatorio Astronomico di Cagliari, Via della Scienza 5, I-09047 Selargius (CA), Italy 77institutetext: Department of Physics and Astronomy, The Open University, Walton Hall, Milton Keynes MK7 6AA, England88institutetext: RAL Space, The Rutherford Appleton Laboratory, Space Science and Technology Department, Chilton, Didcot, Oxfordshire OX11 0QX, England99institutetext: School of Physics and Astronomy, University of Southampton, Southampton SO17 1BJ, UK1010institutetext: University of Hamburg, Gojenbergsweg 112, 21029 Hamburg, Germany
Radiative age mapping of the remnant radio galaxy B2 0924+30: the LOFAR perspective††thanks: The LOFAR and WSRT images used to derive the spectral index and ageing maps are available in electronic form at the CDS via anonymous ftp to cdsarc.u-strasbg.fr (130.79.128.5) or via http://cdsweb.u-strasbg.fr/cgi-bin/qcat?J/A+A/
Abstract
We have observed the steep spectrum radio source B2 0924+30 using the LOw Frequency ARray (LOFAR) telescope. Hosted by a z=0.026 elliptical galaxy, it has a relatively large angular size of 12\arcmin (corresponding to 360 kpc projected linear size) and a morphology reminiscent of a remnant Fanaroff-Riley type II (FRII) radio galaxy. Studying active galactic nuclei (AGN) radio remnants can give us insight into the time-scales involved into the episodic gas accretion by AGNs and their dependence on the AGN host environment. The proximity of the radio galaxy allows us to make detailed studies of its radio structure and map its spectral index and radiative age distribution. We combine LOFAR and archival images to study the spectral properties at a spatial resolution of 1\arcmin . We derive low frequency spectral index maps and use synchrotron ageing models to infer ages for different regions of the source. Thus, we are able to extend the spectral ageing studies into a hitherto unexplored frequency band, adding more robustness to our results. Our detailed spectral index mapping, while agreeing with earlier lower resolution studies, shows flattening of the spectral index towards the outer edges of the lobes. The spectral index of the lobes is and gradually steepens to moving towards the inner edges of the lobes. Using radiative ageing model fitting we show that the AGN activity ceased around 50 Myr ago. We note that the outer regions of the lobes are younger than the inner regions which is interpreted as a sign that those regions are remnant hotspots. We demonstrate the usefulness of maps of AGN radio remnants taken at low frequencies and suggest caution over the interpretation of spectral ages derived from integrated flux density measurements versus age mapping. The spectral index properties as well as the derived ages of B2 0924+30 are consistent with it being an FRII AGN radio remnant. LOFAR data are proving to be instrumental in extending our studies to the lowest radio frequencies and enabling analysis of the oldest source regions.
keywords:
galaxies: active - radio continuum: galaxies - galaxies: individual: B2 0924+301 Introduction
Although active galactic nuclei (AGN) have been observed to influence their surrounding interstellar and intergalactic medium (ISM/IGM, McNamara & Nulsen 2012; Randall et al. 2010), the impact this may have depends on a number of relatively poorly known factors, in particular the duty-cycle of the activity, i.e. the portion of time the super massive black hole (SMBH) is active (Mendygral et al. 2012).
Tracers of past AGN accretion episodes can be observed at radio wavelengths. In the case of radio-loud AGN, their ages (and duty cycle in the case of restarted sources) can be derived using the spectral properties of the radio plasma. Once the accretion of matter onto its SMBH stops, the ejection of plasma jets ceases, terminating the supply of fresh electrons into the radio lobes. These synchrotron radio remnant regions then slowly fade as time passes owing to preferential cooling of high energy particles and/or adiabatic expansion. Consequently, their spectral index steepens ()111We define the spectral index as: , and breaks appear in the radio spectrum (Kardashev 1962; Pacholczyk 1970; Jaffe & Perola 1973; Komissarov & Gubanov 1994). If the radio emission restarts (as observed in a number of cases) this would further modify the shape of the source’s radio spectrum (Murgia et al. 2011) and may influence the source’s morphology.
Thus, radio studies enable us to identify the presence and the timescales of this type of cycle of activity. Selecting radio sources that have a steep spectral index over a range of frequencies is the predominant way of discovering AGN radio remnants222To distinguish radio sources produced by past AGN activity, as opposed to steep spectrum sources found in galaxy clusters (relic, phoenix) we name the former AGN remnants., i.e. sources in which the radio source has switched off. However, the question remains as to why there are so few remnants detected (a few dozen in total) relative to the entire population of active radio galaxies.
Because of the steepness of the spectrum, the low radio frequency observational window is the one where remnants can be more easily detected. For this reason, the recent availability of new deep images from the low frequency array (van Haarlem et al. 2013) has revamped the search and the study of these objects. The first searches with LOFAR have already provided promising results with the percentage of remnants ranging between 10% and 30% (Brienza et al. 2016; Hardcastle et al. 2016). These observations are starting to put constraints on radio galaxy evolution models and are helping us to understand what the relevant physical processes involved in remnant evolution are.
A prerequisite for the complete characterization of the AGN duty cycle is the determination of the active and switched off times of individual objects over a statistically significant sample. In studies of several double-double radio galaxies (DDRGs), Konar et al. (2013) and Orrú et al. (2015) find that they have a relatively rapid duty-cycle with the time elapsed between the periods of activity being a fraction of the total age of the source. Bona fide remnants can show a total age of over a hundred Myr (Harris et al. 1993; Venturi et al. 1998; Jamrozy et al. 2004; Giacintucci et al. 2007). The duration of their remnant phase in most cases appears to be shorter or comparable to that of the active phase (Parma et al. 2007; Murgia et al. 2011; Dwarakanath & Kale 2009, respectively). Cases where the remnant phase is (much) longer than the active phase are, so far, rarer (e.g. Brienza et al. 2016). The duty cycle likely has a dependence on galaxy mass and source power during the active phase, as suggested by statistical studies (Best et al. 2005; Shabala et al. 2008).
Detailed remnant studies have so far been limited to just a few cases and have often not been carried out at sufficiently high spatial resolution to enable the investigation of the radiative ages across the sources, and of their activity histories.
1.1 B2 0924+30
An object that offers this possibility is B2 0924+30, the target of this paper. Its host, IC 2476 (UGC 5043), is the brightest member of the relatively poor Zwicky cluster 0926.5+30.26 (Cordey 1987; Ekers et al. 1981; White et al. 1999), which is located at a redshift of . Its Sloan Digital Sky Survey (SDSS; Aihara et al. 2011) spectrum does not show emission lines indicative of an optical AGN. The radio luminosity333The adopted cosmology in this work is: km s-1Mpc-1 , , . At the redshift of B2 0924+30, kpc; its luminosity distance is 109.6 Mpc (Wright 2006). of B2 0924+30 is W Hz-1. It lacks a discernible radio core or jets / hotspots and is considered to be an AGN remnant by Cordey (1987). Spectral index studies by Jamrozy et al. (2004) show that the spectral index steepens going from the lobes to the inner regions, and the overall spectral index distribution is steeper () than that observed in most active radio galaxies.
Jamrozy et al. (2004) have also performed a radiative ageing analysis of B2 0924+30 and find an overall average source age of Myr.
We expand on previous research efforts by extending the spectral index studies to even lower radio frequencies. Using LOFAR we have derived the highest spatial resolution spectral index mapping to date extending to 140 MHz, enabling us to characterize in detail the spectral properties of the remnant lobes. Our aim is also to perform a resolved radiative age mapping of the source to better ascertain its activity history.
The organization of this paper is as follows. Section 2 describes the data used in this study and outlines the data reduction procedure. Section 3 outlines our results; in Sect. 3.1 we present the spectral analysis results and we discuss the derived source ages in Sect. 3.2. We discuss the implications of our study in Sect. 4.
2 Observations and data reduction
The target was observed with the LOFAR high band antennas (HBA) on the night of March 13, 2014, for a total on source time of 7.5 hours. The observations were obtained in the interleaved mode, using the full Dutch array of 38 antenna stations. The two HBA antenna fields of each of the core stations were treated as separate stations and of the HBA fields of the remote stations only the inner tiles were used (this configuration is known as HBA_DUAL_INNER). 3C 196 was observed as a flux calibrator source for two minutes, followed by a scan of the target of 30 minutes duration with a one minute gap between calibrator and target scans that allowed for beam forming and target re-acquisition. We recorded 325 sub-bands (SBs), over the 63.5 MHz of bandwidth between 116 MHz and 180 MHz. Each SB has 64 frequency channels and a bandwidth of 195.3 kHz. The integration time was set to 2 seconds for both calibrator and target. Four polarizations were recorded. The HBA station field of view (FoV, primary beam) covers around 5 degrees full width at half maximum (FWHM) at 140 MHz. The station beams are complex valued, time, frequency and direction dependent, and are not the same for all of the stations.
| Channels per SB (192 kHz) | 64 |
| Central Frequency | 150 MHz |
| Bandwidth | 63.5 MHz |
| Integration time | 2 s |
| Observation duration | 7.5 h |
| Polarization | Full Stokes |
| UV coverage | kk |
The data were pre-processed by the observatory pipeline (Heald et al. 2010) as described below. Each SB was automatically flagged for radio frequency interference (RFI) using the AOFlagger (Offringa et al. 2012), and then averaged in time to 10 seconds per sample and in frequency by a factor of 16, making the frequency resolution of the output data 4 channels / SB. The calibrator data were used to derive amplitude solutions for each (Dutch) station using the Blackboard self calibration (BBS, Pandey et al. 2009) tool that takes into account the LOFAR station beams variation with time and frequency. The flux density scale of Scaife & Heald (2012) was used in the calibration model for 3C 196 ( Jy).
The amplitudes of the target visibilities were corrected using the derived calibrator solutions. The target visibilities were then phase-(self)calibrated incrementally, using progressively longer baselines to obtain the final (highest) image resolution. The initial phase calibration model was derived from the VLSS444VLSS is the VLA Low frequency Sky Survey carried out at 74 MHz (Cohen et al. 2007) catalogue that covers the FoV out to the first null of the station beam, which contains spectral index information for each source in the model. Before initializing the calibration, we concatenated the data into 4 MHz (20 SB) groups previously averaging each SB to 1 frequency channel to reduce the data size. We chose this set-up to maximize the S/N while maintaining frequency-dependent ionospheric phase rotation to a manageable level. In the calibration, we neglected direction-dependent effects (ionosphere and residual clock errors on longer baselines). However, since our target is in the phase center of the FoV, these issues do not represent a limit to our science goals (as demonstrated below).
The imaging was performed using the LOFAR AW imager (Tasse et al. 2013), which incorporates the LOFAR beam and uses the A-projection (Chandra et al. 2004) algorithm to image the entire FoV. We used Briggs (Briggs 1995) weights with the robustness parameter set to , and imaged by selecting baselines larger than 0.1 . Ten self-calibration steps were performed, each using a sky model generated in the previous cycle and each subsequent one using larger baseline lengths. The self-calibration resulted in images that cover the HBA band, out of which we selected a low- and a high-resolution one (only images not affected by calibration errors)555The selection resulted in six high-resolution and six low-resolution images.
| ID | [MHz] | [mJy/b] | Beam size |
|---|---|---|---|
| LOFAR\tablefootmarka | 113 | 8.3 4.5 | |
| LOFAR\tablefootmarka | 132 | 4.3 3.1 | |
| LOFAR\tablefootmarka | 136 | 4.3 3 | |
| LOFAR\tablefootmarka | 160 | 2.3 1.9 | |
| LOFAR\tablefootmarka | 163 | 2 1.8 | |
| LOFAR\tablefootmarka | 167 | 1.8 1.7 | |
| LOFAR\tablefootmarka\tablefootmarkc | 140 | 2.5 1.2 | |
| WENSS | 325 | 3.6 | |
| WSRT\tablefootmarkb | 609 | 0.77 | |
| NVSS | 1400 | 0.45 | 45\arcsec |
The image noise and beam size are given for the low and high resolution images respectively.
\tablefoottextaThis work
\tablefoottextbJamrozy et al. (2004)
\tablefoottextcAveraged image
We smoothed the high- and low-resolution LOFAR image sets to an identical restoring beam size and averaged them to obtain two averaged images, each having a bandwidth of 28 MHz. We used these images for morphological studies of the target source. The smoothed, individual images were used in our ageing analysis. Table 2 lists the image properties for the LOFAR image set, as well as survey (WENSS666WENSS is the Westerbork Northern Sky Survey carried out at 325 MHz (Rengelink et al. 1997) and NVSS777NVSS stands for the NRAO VLA Sky Survey carried out at a frequency of 1400 MHz (Condon et al. 1998)) images used in our subsequent analysis.
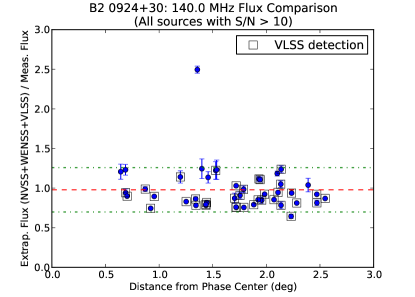
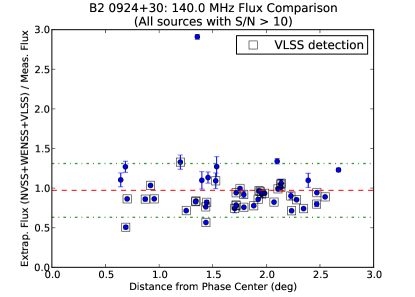
To check whether the station beam correction applied by the AW imager resulted in correct flux-density scaling across the FoV, we have the PyBDSM source finder package (Mohan & Rafferty 2015) and have extracted point sources from our averaged images. Then, we matched the extracted sources with survey catalogs (VLSS, WENSS and NVSS using a \arcsec match radius) and determined the catalogue flux density for each source by interpolating the flux densities from the catalogue entries to the LOFAR frequency. Finally, we divided the obtained catalogue flux density at 140 MHz with the measured flux density from the LOFAR image. Assuming power-law spectra, the ratio should be unity if the station beam correction gives correct fluxes over the FoV. The results are given in Fig. 1. We can see that for both of the HBA images the points cluster around , which shows that the flux correction over the FoV applied by the AW imager gives reasonable flux-density values. The scatter is around %.
Owing to an incomplete HBA beam model, the influence of the grating side-lobes was not properly taken into account during processing, which results in a systematic bias in the measured source fluxes across the LOFAR band. This shows up as a systematic steepening of the in-band spectral index. We applied a LOFAR beam normalization correction factor to the measured flux densities to mitigate the effect.
3 Results
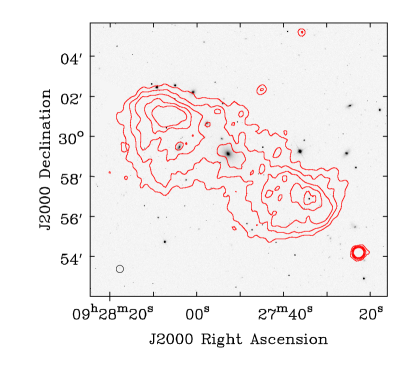
Figure 2 shows the low-resolution LOFAR image obtained by smoothing and averaging together six images taken across the LOFAR band (listed in Table 2). It has a resolution of and an r.m.s. noise level of mJy beam-1.
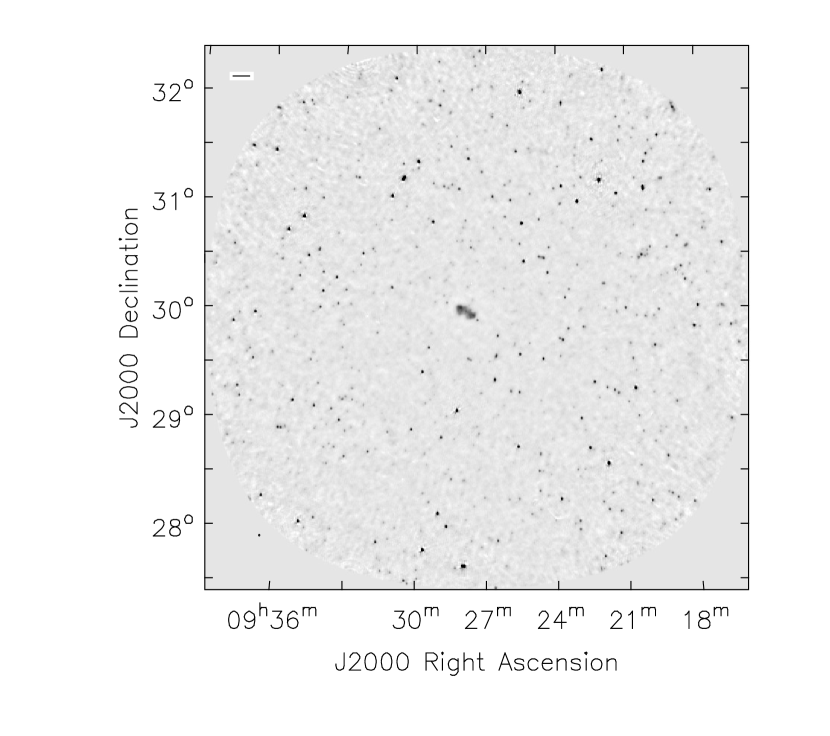
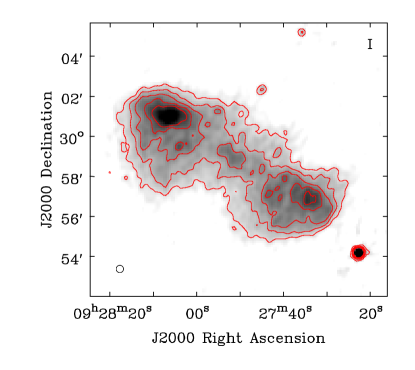
Figure 3 shows the LOFAR view of the target in the-high resolution (22\arcsec) averaged image (see Table 2). We note increased surface brightness regions ( mJy beam-1) within the lobes that are located on opposite sides of the host galaxy. Also, there is an enhancement of surface brightness around the position of the host galaxy. The source is enveloped in a lower surface brightness cocoon.
Several smaller regions of increased surface brightness are noticeable within the radio lobes (see Fig. 3b). Two of them in the north-east (NE) lobe can be identified with background/foreground galaxies.
A point source located off the outermost edge of the SW lobe has been identified with a quasar (Ekers et al. 1981).
There is no noticeable radio core at the position of the host galaxy as ascertained from our high-resolution imaging and images with 1\arcsecresolution obtained by Cordey (1987) at 5000 MHz. Giovannini et al. (1988) place an upper limit on the core flux density of mJy which, in relation to the total surface brightness, hints at the remnant nature of the radio source.
3.1 Spectral analysis
The morphology of B2 0924+30 supports its classification as AGN remnant, fading away after the AGN which has created it has shut down. Here, we elaborate on its spectral properties. The shape of the integrated flux spectrum encodes the activity history of a given radio source and can be a powerful tool in understanding the exact nature of the observed radio emission.
3.1.1 Integrated spectrum
Jamrozy et al. (2004) fitted a synchrotron ageing model to data collected from the literature as well as their own observations. We repeated the fitting procedure, adding the integrated flux density measured from our averaged LOFAR map. An overview of the measurements is given in Table 3.
The magnetic field strength was derived by assuming an equipartition between the energy contained in the magnetic field and in relativistic particles according to Miley (1980). In our calculations, we used a central frequency of 609 MHz, with a spectral index of (average over the source) and lobe extent of . The cut-off frequency values for the calculation were taken to be MHz and MHz, and the electron to proton ratio was set to unity. We computed the magnetic field value for each lobe separately and then averaged the result. Our estimate gives a value of G (similar to what is found for other remnant sources; Murgia et al. 2011; Brienza et al. 2016).
If we impose a low energy cut-off in the particle spectrum, instead of a low frequency cut-off in the emitted synchrotron radiation spectrum, for the magnetic field (Brunetti et al. 1997) we get
where is the equipartition magnetic field that was calculated previously and the low-energy cut-off value. For , , while for , G (30 % larger). Choosing an energy cut-off value is somewhat arbitrary. Based on equipartition arguments, Jamrozy et al. (2004) derive a value of G. We therefore decide to adopt the equipartition value that we initially derived and assume a magnetic field strength of G for all subsequent analysis.
We fitted a continuous-injection model with an off phase (KGJP, Komissarov & Gubanov 1994) to the integrated flux density measurements. Based on a modification of the expression found in Shulevski et al. (2015), the particle distribution function is
where, and are the active phase duration and the time elapsed since source shut-down, is a term describing the energy losses of the particles, and is the energy of the particles. represents the so-called scaled frequency. We assume a range of scaled frequencies, i.e. we do not fit for the break frequency explicitly. The energy-loss term was taken to be the one described by Jaffe & Perola (1973); hence the JP suffix in the model label
where is the effective inverse Compton magnetic field, and is the equivalent cosmic microwave background (CMB) magnetic field.
The observed flux density is given by:
where represents a scaling factor, is defined by Pacholczyk (1970) and is the modified Bessel function.
The KGJP model is warranted since the integrated flux density includes contribution from formerly active source regions where particle acceleration was ongoing.
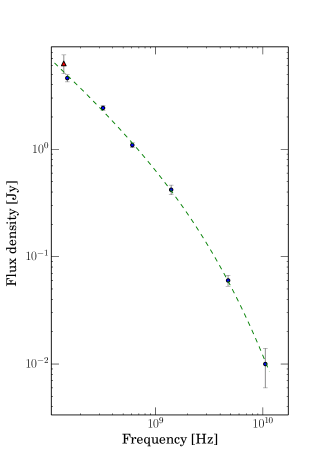
The best-fit values for the time during which the source was active and the time elapsed since the particle injection has ceased (time since shut-down) were found to be: Myr and Myr respectively. We assumed that the magnetic field is constant in time and over the source extent and we neglect adiabatic losses. The best-fit value for the injection spectral index (the spectral index of the particles immediately after they were accelerated / energized) was found to be . We used the Kapteyn package (Terlouw & Vogelaar 2012) for the model-fitting. The model acceptance criteria are identical to those presented in Shulevski et al. (2015). Our best fit-value for the total source age is Myr. Our derived ages differ from those reported by Jamrozy et al. (2004) of Myr (they also assume a constant magnetic field strength and neglect adiabatic losses). We are, however, in agreement with their derived value for the injection spectral index (). The values we derive for the epochs of source activity are not directly comparable to those of Jamrozy et al. (2004) since they used an ageing-only (JP) model in their integrated flux density spectral analysis. The best model fit is shown in Fig. 4. While the spectral curvature is expected for a remnant radio source, the steepness of the injection spectral index (confirmed by our LOFAR measurements) is puzzling.
3.1.2 Spectral index and curvature maps
To study the plasma properties in the remnant lobes, we have produced the highest resolution spectral index map of B2 0924+30 at low frequencies to date. We averaged together the lower resolution HBA images to a single low frequency image (140 MHz) and used the 609 MHz WSRT image from Jamrozy et al. (2004). The data sets have a closely matching UV coverage. The spectral analysis input images were smoothed to a resolution of 60\arcsecand registered to the same pixel size. We derived the spectral index in the standard manner, and propagated the errors of the flux-density to get an estimate of the error in determining the spectral index. We assumed that the flux-density errors in both maps are uncorrelated. We did this for each pixel above a level in the input images.
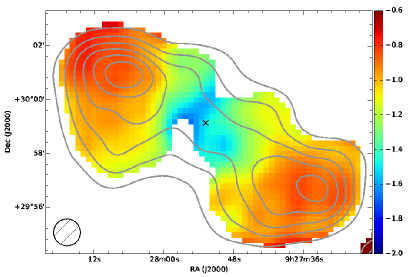
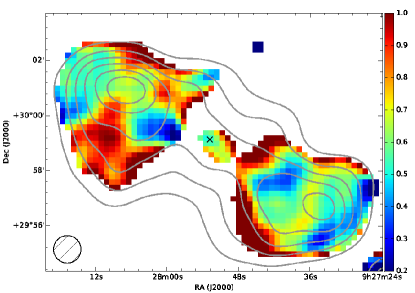
In Figs. 5a and 5b, we can see that the spectral index in the lobes varies from at their inner edges, to at the outer edges. The average value for the integrated spectral index of the source is relatively steep at low frequencies, around , in agreement with previous studies (Jamrozy et al. 2004), as well as with the injection spectral index we obtained previously from fitting the integrated spectrum in Sect. 3.1.1.
We observe that the lobes have steep spectral index values that flatten out going towards the outermost lobe edges; this is especially prominent in the NE lobe.
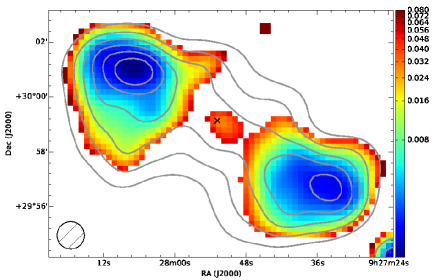
We also derived a spectral curvature map () in an analogous fashion to the spectral index map, using an NVSS survey888The NVSS image (Table 2) is missing flux on large angular scales. The integrated flux-density value at 1400 MHz that we use (Table 3) is taken from Jamrozy et al. (2004), who used single dish Effelsberg telescope measurements to correct for the loss. Based on inspection of the corrected image (Fig. 5a in Jamrozy et al. 2004), we conclude that our spectral curvature and ageing derivation (for the lobe and core regions) is not affected by us using the uncorrected NVSS map. image of the target as the highest frequency data point. We derived the spectral curvature for pixels above a level in all of the input images, to be able to map the regions around the host galaxy. The results are shown in Figs. 5c and 5d.
In line with our previous discussion, the curvature map provides interesting insights into the spectral properties of the source. The remnant lobes reveal more structure, with some areas showing large curvature up to . This suggests that different regions have spectral breaks at different frequencies, which indicates different radiative ages. For example, the lateral lobe edges show pronounced spectral steepening at higher frequencies.
3.2 Radiative ages
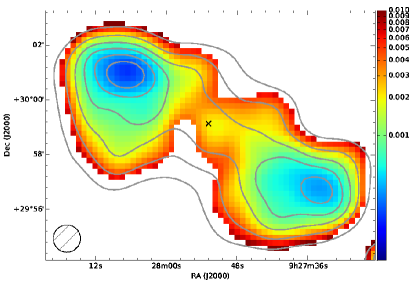
To gain a better insight into the activity history of the radio source, we took our averaged LOFAR image, together with an 609 MHz WSRT image and an NVSS survey map (Table 2), and fitted a JP ageing-only model with a particle distribution function:
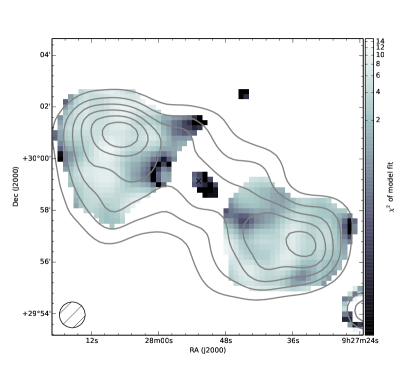
to produce an age map for the source, shown in Fig. 6. The injection index was not fitted for; its value was fixed to the one found () during the integrated flux density spectrum-fitting in Sect. 4. The magnetic field strength used was also the same as we used earlier, G.
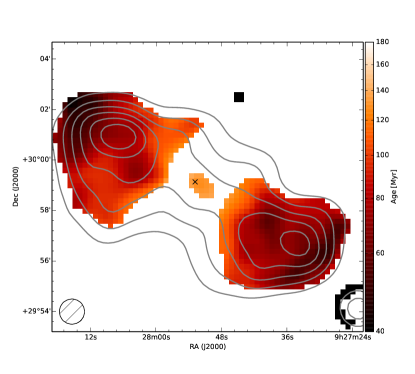
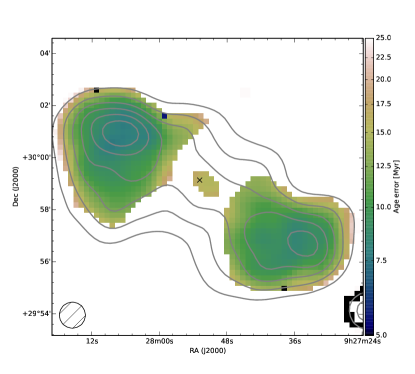
Age mapping provides more information compared to age-model fitting to integrated flux-density measurements for a given source. In the case of B2 0924+30, for the youngest regions at the edges of the lobes we determined an age of around 50 Myr; the source age increases as we look toward the host galaxy; the lobe inner edges show ages of up to 120 Myr, and the center regions around 150 Myr. These findings are in agreement with the ageing profile reported by Jamrozy et al. (2004). Since we fitted an ageing-only model (JP), we have an estimate for the time elapsed since the plasma was last energized across the source.
Consequently, for resolved sources, we can estimate the duration of their active phase as the difference between the oldest and youngest age read-off from the map: . For B2 0924+30, we find an active phase duration of around 100 Myr. Furthermore, the elapsed time since the shut-down is given by the youngest age found () and, in the case of B2 0924+30, this is found to be around 50 Myr.
The age mapping was done with a more limited spectral coverage than the integrated spectral index fit which we performed in Sect. 3.1.1. The reason is that the available maps at frequencies higher than 1400 MHz were of lower resolution (> 1\arcmin) and less sensitive to extended emission. Even so, the mapping shows that (as expected) the source age derived from a (KGJP) model fit to the integrated spectrum is only an estimate for the total source age.
The source age we derived using age mapping is around two times higher than the age obtained by model fitting to the integrated flux-density measurements reported in Sect. 3.1.1.
The ages derived for the inner lobe regions of B2 0924+30 are comparable to the oldest sources in, for example, the sample of Murgia et al. (2011).
3.3 Spectral shifts
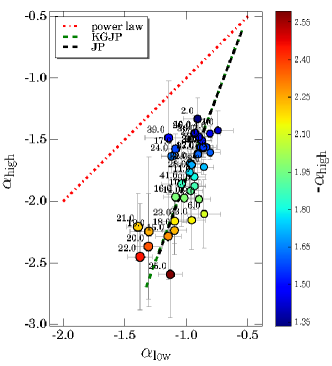
Investigating the source energetics can be done in an analogous manner to the spectral curvature map (Fig. 5c) by plotting the low- and high-frequency spectra in a "colour-colour" plot (Katz-Stone et al. 1993). This approach enables us to visualize the spectral shapes of different source regions and compare them with (spectral) ageing models.
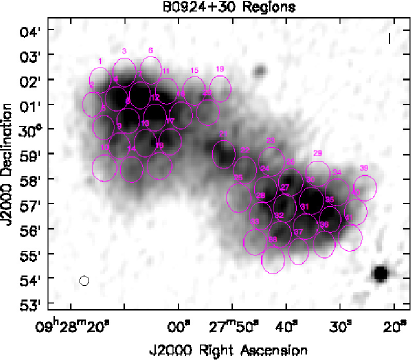
To this end, we performed the analysis on the same data set we used in the ageing modelling, described above. Forty-one measurement regions were used (shown in Fig. 8, top left panel); their spectra were plotted on the - colour-colour plane. In the same plot, we show the loci of points occupied by different ageing models, as well as a simple power law. The distribution of points that represent the regions shows that the spectral shape, for most of them, is best fitted by synchrotron radiation from an aged plasma (Fig. 8, top right panel).
We can reconstruct the global spectrum of the source by shifting the spectra (in the plane) of each region so that, finally, all of the spectra line up. We perform the shifting by choosing a reference region and aligning the spectral breaks of the remaining regions with the break of the chosen region. The spectral breaks were computed by following the expression given by Kardashev (1962):
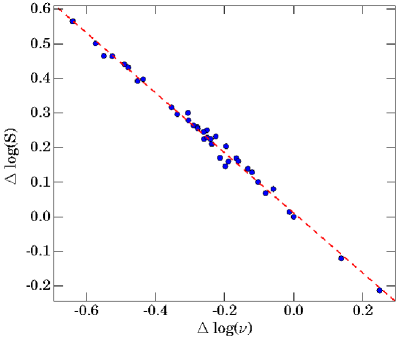
where is expressed in GHz, in G, and in Myr. This technique has been implemented in a number of cases, for example van Weeren et al. (2012), and it has the advantage of extending the spectral analysis over a wider range in frequency. If there is a global electron energy distribution across the source, the spectra of the individual regions trace it, and the differences between them are due to energy losses (radiative, adiabatic), magnetic field variations, and variations in electron density. By shifting the spectra, we account for these effects. The shift results are given in Fig. 8 (bottom right panel).
The amount of shift needed in the flux density-frequency plane per region is shown in Fig. 8 (bottom left panel). We see that the shift values lie on a straight line; this is a strong indicator that the spectral shape of the regions is dominated by radiative losses. If we sample regions with similar physical conditions, the slope of the fit represents the injection spectral index. In our case, the slope value is , which is in line with the best-fit injection spectral index that we arrived at in Sect. 3.1.1, which provides inner consistency to our analysis.
4 Discussion
B2 0924+30 is an AGN radio remnant, a leftover from the time when it was an active radio galaxy. The remnant radio lobes are very well outlined, which may indicate confinement by the IGM. Our analysis shows that the youngest plasma is located at the outer lobe edges. Regions closer to the host galaxy are progressively older, and the diffuse radio emission at the position of the host galaxy (noticeable in the LOFAR image) is the oldest region of the source. There is no sign of restarted AGN activity.
In Sect. 3 we performed a detailed spectral index, curvature, and ageing analysis, mapping these quantities with the highest spatial resolution to date (extending to low frequencies) and comparing our results to previous studies. We found that the values derived for the spectral age using integrated flux density measurements are higher than values obtained in previous studies. The injection spectral-index values are in agreement with the literature and point to a steeper () injection index than is usually assumed.
Comparing our low frequency spectral index map (Fig. 5a) with studies performed using higher frequency data (Jamrozy et al. 2004), we infer that the lobe spectral index is somewhat flatter; this is most pronounced at the outer edges of the lobes. At the frequencies we study with LOFAR, we would expect that the spectrum is a power law that is representative of the injection spectral index. Recent studies (Harwood 2017b) have shown that integrated flux-density models (incorporating a continuous injection phase) are unreliable in the recovery of parameters. They tend to depend on the frequency coverage and may provide systematically higher values for the injection spectral index. Further, determining the injection spectral index from the low-frequency spectrum alone is problematic. Harwood (2017a) show that the hotspot spectrum in maps of active sources is affected by stochastic acceleration and / or absorption processes that flatten the spectrum at low frequencies. At present, it is not known how (or whether) these processes reflect on remnant hotspot regions in inactive radio galaxies. Hence, it is uncertain how accurately we can determine the injection spectral index. In any case, within the stated errors, the injection index is in approximate agreement with studies of active radio galaxies (Harwood et al. 2015, 2016). Furthermore, simulations suggest (Kapinska et al. 2015) that the observed integrated spectrum can steepen owing to mixing of electron populations.
The appearance of the core regions with their steepest spectral index, as well as the spectral index and age gradient, suggest that B2 0924+30 is a fading FRII source; the youngest regions are found towards the outer edges of the lobes, and the oldest are the regions towards the host galaxy. Taken together, these inferences point to the fact that we are observing source regions with particles that were last energized just before source shutdown. Our mapping suggests that we are seeing the remnants of hotspots which are prominent features in active FRII radio galaxies.
We were able to estimate a limit to the duty cycle for B2 0924+30 using the duration of the active and dormant periods that were read off the derived age maps. The time elapsed since it has shut down is estimated to be half of that spent in an active phase. This is in line with the DDRG sources studied by Konar et al. (2013) that we mentioned earlier (which, morphologically, appear to be restarted FRII sources) and different from the case presented in Brienza et al. (2016), which shows a significantly shorter active compared to dormant phase and seems to have FRI morphology ( W Hz-1).
The spectral index and spectral ageing maps we produced not only support the claim that this is an FRII AGN remnant; the model fitting produces plasma ages that are higher than those derived using integrated flux density data.
The discrepancies between the ages derived from the integrated flux density analysis and resolved studies are model dependent. The integrated flux density analysis averages over source regions with different physical properties and consequently particle activity histories. Thus, the ages derived from the integrated flux density analysis may be different to that found using age mapping.
In Sect. 3.3, we show that the dominant energy-loss mechanisms are inverse Compton and synchrotron radiation, suggesting that adiabatic expansion energy losses are negligible. This hints at the possibility that the radio plasma is somewhat confined. The presence of a low significance, possibly extended ROSAT X-ray emission detection that is associated with the host galaxy (Canosa et al. 1999) may be relevant in this regard.
The fact that we can detect remnant hotspots suggests that relatively short time has elapsed since source shut-down (estimated at Myr).
The paucity of AGN radio remnants may be due to long AGN duty cycles (the time elapsed between active phases being longer than the radio plasma lifetime) and/or the radio plasma ageing more rapidly owing to expansion losses.
A larger sample of AGN radio remnants is needed to put firmer constraints on these assumptions.
5 Conclusions
We have used LOFAR to obtain images of B2 0924+39 at low frequencies with the highest spatial resolution yet obtained for this source. This has enabled us to produce detailed spectral index maps and derive radiative ages over the extent of the source. We confirmed previous inferences (Jamrozy et al. 2004) that are consistent with this source being a FRII remnant. We have also shown that there is a continuum of ages that increase from the outer lobes to the regions at the position of the host galaxy.
In addition, we have demonstrated the detection of remnant hotspot regions at the outer lobe edges, further supporting the FRII nature of this source. This result highlights the value of high-resolution, high surface-brightness sensitivity LOFAR maps obtained at low frequencies in studying remnant radio galaxies, disentangling their nature and activity history.
We have shown that age estimates obtained from integrated flux density measurements differ from those obtained using resolved studies. This finding indicates caution; ages obtained by fitting models to integrated flux-density measurements tend to be affected by the activity history of those sources, or only provide limits to the ages obtained by mapping.
Detailed studies of larger samples of AGN remnants are needed to answer the question as to whether the derived timescales are typical and consistent for this source type, and infer the details of their duty cycles.
Acknowledgements.
The authors thank the anonymous referee for the useful comments and suggestions that helped improve this paper.LOFAR, the Low Frequency Array designed and constructed by ASTRON, has facilities in several countries that are owned by various parties (each with their own funding sources), and that are collectively operated by the International LOFAR Telescope (ILT) foundation under a joint scientific policy.
RM gratefully acknowledges support from the European Research Council under the European Union’s Seventh Framework Programme (FP/2007-2013) / ERC Advanced Grant RADIOLIFE-320745.
GJW gratefully acknowledges support from The Leverhulme Trust.
This work has made use of the NASA/IPAC Extragalactic Database (NED), which is operated by the Jet Propulsion Laboratory, California Institute of Technology, under contract with the National Aeronautics and Space Administration.
This work has made use of python (www.python.org), including the packages numpy (www.numpy.org), scipy (van der Walt et al. 2011, www.scipy.org) and IPython (Pérez & Granger 2007). Plots have been produced with matplotlib (Hunter 2007).
This research made use of Astropy, a community-developed core Python package for Astronomy (Astropy Collaboration et al. 2013)
This research made use of APLpy, an open-source plotting package for Python (Robitaille & Bressert 2012)
References
- Aihara et al. (2011) Aihara, H., Prieto, C. A., An, D., et al. 2011, ApJS, 193, 29
- Astropy Collaboration et al. (2013) Astropy Collaboration, Robitaille, T. P., Tollerud, E. J., et al. 2013, A&A, 558, A33
- Best et al. (2005) Best, P. N., Kauffmann, G., Heckman, T. M., & Ivezic, Z. 2005, MNRAS, 362, 9
- Brienza et al. (2016) Brienza, M., Godfrey, L., & Morganti, R. 2016, Conference proceedings "Active Galactic Nuclei: what’s in a name?", 27 June - 1 July, Garching, Germany, 102
- Brienza et al. (2016) Brienza, M., Godfrey, L., Morganti, R., et al. 2016, A&A, 585, A29
- Briggs (1995) Briggs, D. S. 1995, PhD thesis (New Mexico Institute of Mining Technology, Socorro, New Mexico, USA)
- Brunetti et al. (1997) Brunetti, G., Setti, G., & Comastri, A. 1997, A&A, 325, 898
- Canosa et al. (1999) Canosa, C. M., Worrall, D. M., Hardcastle, M. J., & Birkinshaw, M. 1999, MNRAS, 310, 30
- Chandra et al. (2004) Chandra, P., Ray, A., & Bhatnagar, S. 2004, ApJ, 612, 974
- Cohen et al. (2007) Cohen, A. S., Lane, W. M., Cotton, W. D., et al. 2007, AJ, 134, 1245
- Condon et al. (1998) Condon, J. J., Cotton, W. D., Greisen, E. W., et al. 1998, AJ, 115, 1693
- Cordey (1987) Cordey, R. A. 1987, MNRAS, 227, 695
- Dwarakanath & Kale (2009) Dwarakanath, K. S. & Kale, R. 2009, ApJ, 698, L163
- Ekers et al. (1981) Ekers, R. D., Fanti, R., Lari, C., & Parma, P. 1981, A&A, 101, 194
- Giacintucci et al. (2007) Giacintucci, S., Venturi, T., Murgia, M., et al. 2007, A&A, 476, 99
- Giovannini et al. (1988) Giovannini, G., Feretti, L., Gregorini, L., & Parma, P. 1988, A&A, 199, 73
- Gregorini et al. (1992) Gregorini, L., Klein, U., Parma, P., Schlickeiser, R., & Wielebinski, R. 1992, A&AS, 94, 13
- Hardcastle et al. (2016) Hardcastle, M. J., Gürkan, G., van Weeren, R. J., et al. 2016, MNRAS, 462, 1910
- Harris et al. (1993) Harris, D. E., Stern, C. P., Willis, A. G., & Dewdney, P. E. 1993, AJ, 105, 769
- Harwood (2017a) Harwood, J. J. 2017a, FR-II radio galaxies at low frequencies II: spectral ageing and source dynamics, submitted to MNRAS
- Harwood (2017b) Harwood, J. J. 2017b, Spectral ageing in the era of big data: integrated vs resolved models, submitted to MNRAS
- Harwood et al. (2016) Harwood, J. J., Croston, J. H., Intema, H. T., et al. 2016, MNRAS, 458, 4443
- Harwood et al. (2015) Harwood, J. J., Hardcastle, M. J., & Croston, J. H. 2015, MNRAS, 454, 3403
- Heald et al. (2010) Heald, G., McKean, J., Pizzo, R., et al. 2010, PoS(ISKAF2010)057 [\eprint[arXiv]1008.4693v1]
- Hunter (2007) Hunter, J. D. 2007, Computing In Science & Engineering, 9, 90
- Jaffe & Perola (1973) Jaffe, W. J. & Perola, G. C. 1973, A&A, 26, 423
- Jamrozy et al. (2004) Jamrozy, M., Klein, U., Mack, K. H., Gregorini, L., & Parma, P. 2004, A&A, 427, 79
- Kapinska et al. (2015) Kapinska, A., Hardcastle, M., Jackson, C., et al. 2015, Advancing Astrophysics with the Square Kilometre Array (AASKA14), 173
- Kardashev (1962) Kardashev, N. S. 1962, Astronomicheskii Zhurnal, 39, 393
- Katz-Stone et al. (1993) Katz-Stone, D. M., Rudnick, L., & Anderson, M. C. 1993, ApJ, 407, 549
- Komissarov & Gubanov (1994) Komissarov, S. S. & Gubanov, A. G. 1994, A&A, 285, 27
- Konar et al. (2013) Konar, C., Hardcastle, M. J., Jamrozy, M., & Croston, J. H. 2013, MNRAS, 430, 2137
- McNamara & Nulsen (2012) McNamara, B. R. & Nulsen, P. E. J. 2012, New Journal of Physics, 14
- Mendygral et al. (2012) Mendygral, P., Jones, T., & Dolag, K. 2012, ApJ, 750
- Miley (1980) Miley, G. 1980, ARA&A, 18, 165
- Mohan & Rafferty (2015) Mohan, N. & Rafferty, D. 2015, PyBDSM: Python Blob Detection and Source Measurement, Astrophysics Source Code Library
- Murgia et al. (2011) Murgia, M., Parma, P., Mack, K. H., et al. 2011, A&A, 526, A148
- Offringa et al. (2012) Offringa, A. R., van de Gronde, J. J., & Roerdink, J. B. T. M. 2012, A&A, 539, A95
- Orrú et al. (2015) Orrú, E., van Velzen, S., Pizzo, R. F., et al. 2015, A&A, 584
- Pacholczyk (1970) Pacholczyk, A. G. 1970, Radio Astrophysics
- Pandey et al. (2009) Pandey, V. N., van Zwieten, J. E., de Bruyn, A. G., & Nijboer, R. 2009, in Astronomical Society of the Pacific Conference Series, Vol. 407, The Low-Frequency Radio Universe, ed. D. J. Saikia, D. A. Green, Y. Gupta, & T. Venturi, 384
- Parma et al. (2007) Parma, P., Murgia, M., de Ruiter, H. R., et al. 2007, A&A, 470, 875
- Pérez & Granger (2007) Pérez, F. & Granger, B. E. 2007, Computing in Science and Engineering, 9, 21
- Randall et al. (2010) Randall, S. W., Forman, W. R., Giacintucci, S., et al. 2010, ApJ, 726
- Rengelink et al. (1997) Rengelink, R. B., Tang, Y., deBruyn, A. G., et al. 1997, A&ASupplement Series, 124, 259
- Robitaille & Bressert (2012) Robitaille, T. & Bressert, E. 2012, APLpy: Astronomical Plotting Library in Python, Astrophysics Source Code Library
- Scaife & Heald (2012) Scaife, A. M. M. & Heald, G. H. 2012, MNRAS, 423, 30
- Shabala et al. (2008) Shabala, S. S., Ash, S., Alexander, P., & Riley, J. M. 2008, MNRAS, 388, 625
- Shulevski et al. (2015) Shulevski, A., Morganti, R., Barthel, P. D., et al. 2015, A&A, 583, A89
- Tasse et al. (2013) Tasse, C., van der Tol, S., van Zwieten, J., van Diepen, G., & Bhatnagar, S. 2013, A&A, 553, A105
- Terlouw & Vogelaar (2012) Terlouw, J. P. & Vogelaar, M. G. R. 2012, Kapteyn Package, version 2.2 (Kapteyn Astronomical Institute, Groningen, The Netherlands)
- van der Walt et al. (2011) van der Walt, S., Colbert, C., & Varoquaux, G. 2011, Computing In Science & Engineering, 13, 22
- van Haarlem et al. (2013) van Haarlem, M. P., Wise, M. W., Gunst, A. W., et al. 2013, A&A, 556, 2
- van Weeren et al. (2012) van Weeren, R. J., Rottgering, H. J. A., Intema, H. T., et al. 2012, A&A, 546, A124
- Venturi et al. (1998) Venturi, T., Bardelli, S., Morganti, R., & Hunstead, R. W. 1998, MNRAS, 298, 1113
- White et al. (1999) White, R. A., Bliton, M., Bhavsar, S. P., et al. 1999, AJ, 118, 2014
- Wright (2006) Wright, E. L. 2006, PASP, 118, 1711