Insulating titanium oxynitride for visible light photocatalysis
Abstract
We propose a systematic approach to obtain various forms of insulating titanium oxynitrides TinN2O2n-3 and we conduct a detailed study on its case, Ti2N2O. We study the energetics and the electronic structures of Ti2N2O and compare these results with those of pristine and nitrogen-doped TiO2 within the framework of the density-functional theory (DFT) and the GW approximation. We find that Ti2N2O is semiconducting with the calculated band-gap of 1.81 eV, which is significantly smaller than those of pristine TiO2 rutile (3.14 eV) or anatase (3.55 eV). Furthermore, the reduction of the band-gap of Ti2N2O is realized not by lowering of the conduction-band minimum but by rising the valence-band maximum. Therefore the proposed Ti2N2O has suitable band-edge alignment for water-splitting photocatalysis. Finally, total energy calculations indicate that Ti2N2O is potentially easier to synthesize than nitrogen-doped TiO2. Based on these results, we propose Ti2N2O as a promising visible-light photocatalytic material.
pacs:
71.20.-b,71.20.NrI Introduction
Titanium dioxide TiO2 is extensively studied as a functional material with the potential of being used in various technological applications such as photocatalysis, photovoltaics, and oxide electronics.rmp ; review1 ; review2 ; review3 One of the most interesting applications is the photocatalysis of water into hydrogen and oxygen gas.fujishima ; review4 ; review5 ; renew However, the experimental optical band gap of TiO2 is 3.0 eV in rutile and 3.2 eV in anatase phase. PCM ; Minoura ; Tang ; Tang2 ; KG ; Hosoka Therefore pristine TiO2 is not photoactive under a large part of the solar spectrum.review4 ; renew However, to improve water splitting efficiency, it is not enough to just reduce the band gap. TiO2 must maintain appropriate band energy alignment with water oxidation and reduction levels. While the conduction band in TiO2 is already aligned well with water reduction level, its valence band is too low in energy. In order to optimize the photocatalytic performance, the band-gap reduction in titanium oxide must come from an upward energy shift of the valence band, not from a downward shift of the conduction band. renew ; aoki1
Several methods such as impurity doping and forming solid solutions have been proposed in earlier reports to improve photocatalytic activity of TiO2 under visible light.renew ; review6 ; reivew7 ; review8 ; review9 As for the solid-solution method, the TiO2-ZrO2 solid solution was reported to have the absorption tail in the visible-light region.solution2 Also, the reduction of the band gap was theoretically predicted for the TaON-TiO2 solution.solution4 On the other hand, nitrogen doping was shown to add the absorption tail in the visible-light region by Asahi et al.asahi1 and this was followed with many other experimental and theoretical studies.asahi2 ; Irie ; Lindgren ; Torres ; Mrowetz ; Kobayakawa ; Spada ; Wu ; Yang ; Li1 ; Li2 ; hitosugi ; nakano ; matsui ; anpo ; Gole1 ; Gole2 ; aoki1 ; aoki2 The effectiveness of the nitrogen doping is derived from the fact that atomic nitrogen states are higher in energy than atomic oxygen states. Therefore nitrogen doping raises the valence band of TiO2 as it is formed primarily from oxygen states.Taga ; Mo ; Nakai
However, nitrogen doping into TiO2 does not give a new peak in the visible-light region. Instead, it just adds a shoulder to the original peak in the ultraviolet region.asahi2 ; Irie ; Kobayakawa ; Wu ; Yang Most likely, this happens because the nitrogen concentration is so small that the absorption via the nitrogen-induced states only occurs around the nitrogen dopants. Therefore, to enhance visible-light absorption with nitrogen doping, it is necessary to increase the nitrogen concentration level. To the best of our knowledge, the highest reported nitrogen concentration in TiO2 is 15 %.hitosugi Several studies suggested that oxygen vacancies play a crucial role in stabilizing nitrogen substitution,Ov1 ; Ov2 as is expected from the electron-counting rule. Since concentration of oxygen vacancies in native TiO2 such as rutile or anatase is relatively low, there is a natural limit to the amount of nitrogen one can substitute into TiO2.
Here we propose an alternative way to achieve much higher nitrogen concentrations in titanium oxide systems. Instead of focusing on TiO2 stoichiometry with a limited number of native oxygen vacancies, we consider here ordered compounds with composition TinO2n-1, where is any positive integer. These systems can be viewed as ordered oxygen-deficient variants of TiO2 with a large concentration of oxygen vacancies. Since oxygen vacancies stabilize nitrogen substitutions, one can expect that these systems could achieve much higher nitrogen concentrations than TiO2. The compound with has the well known corundum structure as its ground stateti2o3-c1 ; ti2o3-c2 ; ti2o3-c3 while the structures of compounds are known as Magnéli phases. magneli1 ; magneli2 ; magneli3
Since the nominal titanium valency in TinO2n-1 is less than +IV, one might expect them to be metallic due to partially occupied -levels on titanium. However, it is found experimentally that corundum Ti2O3 and several Magnéli phases exhibit the metal-insulator transitionti2o3-1 ; ti2o3-2 ; ti2o3-3 ; ti2o3-4 ; ti2o3-9 ; MITreview ; ti3o5-1 ; ti3o5-2 ; ti4o7-1 ; ti4o7-2 ; tio with a small charge-ordering gap one or two orders of magnitude less than in TiO2.co1 ; co2 ; ti4o7-3 (The values of the charge-order gap in these systems are between 27 and 250 meV. ti2o3-2 ; ti2o3-3 ; ti2o3-5 ; ti2o3-6 ; ti2o3-7 ; ti2o3-8 ; ti4o7-3 ; ti4o7-4 ; ti4o7-5 ) Therefore, to achieve large-gap insulating state without charge ordering, one needs to replace two out of oxygen atoms with nitrogen, thus achieving composition
restoring the highly stable +IV valency of titanium. We propose this as a purely insulating titanium oxynitride. It is highly notable that this approach has high controllability over electronic properties since one can tune the nitrogen concentration while keeping the titanium valency +IV by choosing the appropriate value for .
Nitrogen substitution into TinO2n-1 systems was first reported by Hyett and his co-workers for the case (Ti3-δO4N, )oxynitride1 ; oxynitride3 and later extended to larger () cases by Mikami and Ozaki (Tin(O,N)2n-1).oxynitride2 However, the resistivity of their samples is quite low (10–1000 m). Therefore these samples are likely quite far away from the ideal TinN2O2n-3 configuration. As far as we know, insulating solid material with nominal TinN2O2n-3 configuration has not been synthesized up to now while there is an experimental report on the existence of molecules with the composition Ti2N2O, which corresponds to the case. Ti2N2Omol On the other hand, theoretical prediction of TinN2O2n-3 solid compounds has been done for the case (Ti3N2O3) by Wu and his co-workers via a high throughput screening method within the density functional theory (DFT).oxynitride4 They predicted Ti3N2O3 based on the structure of Ta3N5,Ta3N5 which is almost isomorphic to the -Ti3O5 structure. Within the -sol method they obtained the band gap of 2.37 eV with a favorable band-edge position for water splitting.deltasol
In this paper, we focus on the oxynitride Ti2N2O ( case) with corundum-like structure since it has the highest nitrogen concentration among all . However, our conclusions might extend to Magnéli phases () as well. In addition, we study nitrogen-doped TiO2 so that we can compare the nitrogen substitutional energy and the electronic structure with those of Ti2N2O.
II Methods
Our electronic-structure calculations are based on the framework of the density-functional theory (DFT).HK ; KS We also employ the GW approachhedin ; hybertsen-louie-1 ; hybertsen-louie-2 to compute quasiparticle band structures of pristine TiO2.
In DFT calculations we use the generalized gradient approximation (GGA)GGAperdew with the Perdew-Burke-Ernzerhof (PBE) exchange-correlation functional.PBE We expand the Kohn-Sham orbitals in plane-wave expansion with the cut-off energy of 200 Ry. We employ the pseudopotential method with the Troullier-Martins norm-conserving pseudopotentials. TM We generated pseudopotentials for Ti, O, and N with the charged Ti4+ and neutral O and N configurations. In generating the pseudopotential for Ti, the and semicore states are treated as valence states and the cutoff radii for the , , and states are set to be 0.90 , 0.90 , and 1.00 , respectively, where is the Bohr radius. In generating the pseudopotentials for O and N, the cutoff radii both for the and states are set to be 1.05 . The k-points sampling is performed using the Monkhorst-Pack methodmonk with 446, 442, and 662 grids for the primitive unit cell of rutile TiO2, and the conventional unit cells of anatase TiO2 and corundum Ti2O3, respectively. For metallic systems, we use the Methfessel-Paxton first-order spreading with the searing of 0.01 Ry in the Brillouin-zone integration. mp The structural optimization is performed based on the Wentzcovitch damped molecular dynamics. Wen The electronic-structure calculation within the DFT is performed using the Quantum ESPRESSO package. QE
Quasiparticle band structures are calculated by the one-shot GW approachhedin ; hybertsen-louie-1 ; hybertsen-louie-2 within the generalized plasmon-pole (GPP) model. gpp As the starting point for the one-shot GW calculation, we use the DFT results obtained through the above-mentioned DFT methodology. The number of the calculated bands within the DFT calculation is 1000 per TiO2 formula unit. The frequency cut-off for the dielectric matrix calculation is set to be 40 Ry. These parameters for the GW calculation were confirmed to give well converged results in a recent GW study for rutile TiO2. Andrei The GW calculation is performed using the BerkeleyGW package. BerkeleyGW
III Structure
In this section, we discuss structural models of nitrogen-substituted TiO2 and Ti2O3 used in our study.
III.1 Nitrogen substituted TiO2
Figure 1 shows the crystal structure of pristine rutile and anatase TiO2, which are representative phases among TiO2 polymorphs. Rutile has a primitive tetragonal structure with the space group . Its unit cell contains two TiO2 formula units. Anatase has a body-centered tetragonal structure with the space group . Its primitive unit cell also contains only two TiO2 units.
All oxygen sites in rutile and anatase are crystallographically equivalent. Therefore, there is only one symmetry equivalent way to substitute a single oxygen atom with a nitrogen atom in these structures. In our calculation we replace one out of thirty-two oxygen atoms with nitrogen, both in rutile and anatase phase. After this substitution we fully relax the internal structural coordinates and lattice constants. In the case of rutile this requires a 222 supercell and in the case of anatase 221 supercell of its conventional unit cell. These supercells are shown in Fig. 2.
| (a) | (b) | |
|---|---|---|
 |
| (a) | (b) | |
|---|---|---|
 |
 |
III.2 Nitrogen substituted Ti2O3: Ti2N2O
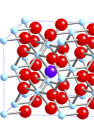
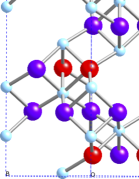
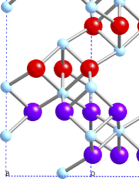
The crystal structure of corundum Ti2O3 is shown in Fig. 3. The corundum structure has rhombohedral symmetry with the space group () and its primitive unit cell contains two Ti2O3 units.
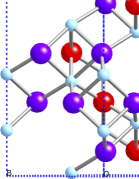
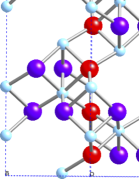
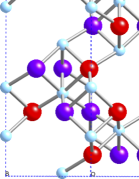
We use hexagonal conventional unit cell of Ti2O3 with twelve titanium and eighteen oxygen atoms as a starting point to obtain structure of titanium oxynitride Ti2N2O. We constructed seven representative structural models of Ti2N2O by replacing twelve out of eighteen oxygen atoms with nitrogen. Afterwards we relax the structure until it reaches total energy minimum. Seven structures of Ti2N2O we considered are shown in Fig. 4 and we label them as Ti2N2O-I through Ti2N2O-VII in the order of the energetic stability (Ti2N2O-I is the most stable). We find that the differences in the formation energy of these seven models are well correlated with the nitrogen and oxygen coordination of titanium atoms. Four out of seven models have all titanium atoms surrounded by four nitrogen and two oxygen atoms. These four models have a very similar calculated total energy (it varies at most 73 meV per Ti2N2O formula unit). Remaining three models are significantly less energetically stable (up to 239 meV per Ti2N2O formula unit) which we relate to the fact that some of their titanium atoms are surrounded with six nitrogen and no oxygen atoms, as shown in Table 1.
| Model | Titanium coordination | |||||
|---|---|---|---|---|---|---|
| (meV/Ti2N2O) | #N | 6 | 4 | 3 | 0 | |
| #O | 0 | 2 | 3 | 6 | ||
| I | 0 | 0 | 12 | 0 | 0 | |
| II | 21 | 0 | 12 | 0 | 0 | |
| III | 21 | 0 | 12 | 0 | 0 | |
| IV | 73 | 0 | 12 | 0 | 0 | |
| V | 102 | 4 | 0 | 8 | 0 | |
| VI | 130 | 4 | 0 | 8 | 0 | |
| VII | 239 | 6 | 0 | 4 | 2 | |
| (a) | (b) | |
| (c) | (d) | |
| (a): Ti2N2O-I | (b): Ti2N2O-II | (c): Ti2N2O-III |
 |
 |
 |
| (d): Ti2N2O-IV | (e): Ti2N2O-V | (f): Ti2N2O-VI |
 |
 |
 |
| (g): Ti2N2O-VII | ||
 |
IV Nitrogen substitution energy
Now we compare energy required to substitute a nitrogen atom into TiO2 and Ti2O3. Since there are no oxygen vancancies in TiO2 we expect that energy required for substitution in TiO2 will be significantly larger than that in Ti2O3.
We define the substitutional energy per single nitrogen atom in the case of TiO2 and Ti2O3 as,
| (1) | ||||
| (2) |
Where and are calculated total energies of pristine phases while and are calculated total energies of molecular oxygen and nitrogen.
Calculated values of substitutional energy are shown in Table 2 for the cases of TiO2 and Ti2O3. In the case of TiO2, values are 5.74 eV for the rutile phase and 5.89 eV for the anatase phase. In the case of Ti2O3, on the other hand, values are significantly lower, in the range of 3.30–3.42 eV. Therefore, nitrogen substitution into Ti2O3 is energetically more favorable than nitrogen doping into TiO2, as is expected from the titanium valency of +IV in Ti2N2O. This result shows that Ti2N2O could be created in the laboratory and the existence of Ti2N2O moleculesTi2N2Omol also supports this conclusion.
| Gap | CBM | VBM | ||
| (eV) | (eV) | (eV) | (eV) | |
| Pristine TiO2 | ||||
| Rutile | 3.14 | 3.14 | 0.00 | |
| (1.87) | (1.87) | (0.00) | ||
| Anatase | 3.55 | 3.11 | ||
| (2.13) | (1.76) | () | ||
| TiO2 with 1/32 N substitution | ||||
| Rutile | 5.74 | 3.11 | 3.17 | 0.06 |
| (1.86) | (1.91) | (0.05) | ||
| Anatase | 5.89 | 2.98 | 3.00 | 0.03 |
| (1.78) | (1.77) | () | ||
| Pristine Ti2O3 | ||||
| Fermi level at 3.27 eV | ||||
| Ti2N2O oxynitride | ||||
| I | 3.30 | 1.81 | 3.15 | 1.34 |
| (1.08) | (2.15) | (1.07) | ||
| II | 3.31 | 2.19 | 3.16 | 0.96 |
| (1.31) | (2.08) | (0.77) | ||
| III | 3.31 | 2.11 | 3.12 | 1.01 |
| (1.26) | (2.06) | (0.80) | ||
| IV | 3.34 | 2.06 | 3.28 | 1.22 |
| (1.23) | (2.23) | (1.00) | ||
| V | 3.35 | 2.32 | 3.35 | 1.03 |
| (1.39) | (2.25) | (0.86) | ||
| VI | 3.37 | 2.01 | 3.26 | 1.25 |
| (1.20) | (2.22) | (1.02) | ||
| VII | 3.42 | 1.99 | 3.74 | 1.76 |
| (1.19) | (2.71) | (1.52) | ||
V Electronic structure
We now discuss its effect on the electronic structure. As is well known, Kohn-Sham energies in the DFT calculation tend to underestimate electronic gaps in most semiconductors. hybertsen-louie-1 ; hybertsen-louie-2 ; gap1 ; gap2 Therefore, we use here GW approximation to obtain improved electron gaps. Since these calculations are rather computationally demanding, we performed them on pristine TiO2 rutile and anatase and use them to infer GW corrections in nitrogen-substituted cases.
V.1 Pristine TiO2 and Ti2O3
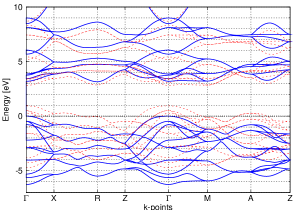
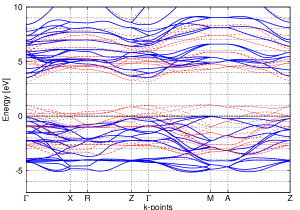
Figure 5 shows DFT (dashed red line) and GW-corrected (solid blue line) band structures of pristine rutile and anatase TiO2. We find that the GW-corrected band structure is nearly rigidly opened-up compared to the DFT band structure (scissor-shifted).
We find that the rutile TiO2 has a direct band gap of 1.87 eV at the point within a DFT calculation. Inclusion of the GW correction changes this direct band gap to 3.19 eV and produces a somewhat smaller indirect -to-R gap of 3.14 eV. This result shows that the scissor-shift due to the GW correction is not completely rigid. Similar result was obtained in a recent GW study as well.Andrei Nevertheless, this variation is relatively small.
In the case of anatase TiO2 we find conduction-band minimum (CBM) at the point but the valence-band maximum (VBM) on the –M line, close to the M point, both in DFT and GW-corrected results. Therefore, the band gap in anatase is indirect. Its magnitude is 2.13 eV within DFT and 3.55 eV with the GW correction.
| (a): Rutile | (b): Anatase |
|---|---|
 |
 |
In the case of pristine Ti2O3, we find it to be metallic within the DFT approximation. Therefore, further detailed studies are needed both experimentally and theoretically to discuss the small charge-ordering gap found in previous experiments.ti2o3-1 ; ti2o3-2 ; ti2o3-3 ; ti2o3-4 ; MITreview ; ti2o3-9 On the other hand, oxynitride Ti2N2O does not possess such difficulty and is insulating with the substantial gap even within DFT as expected from the electron counting argument, which is shown in the following subsection.
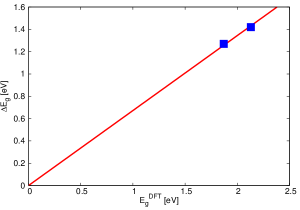
Here, we analyze GW corrections to the band gap in pristine rutile and anatase TiO2. We label GW-corrected and DFT band gaps as and , respectively, and define the GW correction to the band gap as . We plot the with respect to both for rutile and anatase TiO2 in Fig. 6. As one can see from the figure, two data point for rutile and anatase are almost collinear with the original point, indicating that is approximately proportional to in titanium oxide systems. The proportional trend of the GW correction to the band gap has also been found in the previous literatures. godby-gw ; louie-gw ; kotani-gw Once we assume the proportionality between and , we obtain
| (3) |
from the least squares fitting. We use Equation (3) to approximate the scissor-shifts in nitrogen-substituted cases.
V.2 Nitrogen-substituted cases
Now we are ready to discuss the electronic structure of nitrogen-substituted systems. We list the electron gap, the conduction band maximum (CBM), and the valence band maximum (VBM) calculated based on DFT in Table 2 for the cases of TiO2-derived and Ti2O3-derived systems. In order to align the energy levels, we use the oxygen core level in each system as the reference energy instead of the vacuum level since the calculation of the vacuum level requires detailed analysis of surface conditions. Although energy-level alignment referenced to the oxygen level is an approximation, we expect that it works well in this case since it reproduces the rutile/anatase band alignment in pristine TiO2 both measured by XPSalignmentexp and predicted by DFTalignmentexp ; alignmentcomp as well as the band-edge shift induced by nitrogen doping into rutile or anatase predicted in a previous study.valentin
Our results also show that CBM and VBM of anatase are lower than those of rutile by 0.03 eV and 0.45 eV, respectively.
After energy level alignment we introduce the GW scissor-shift correction by adding to CBM and subtracting it from VBM. Therefore total gap is increased by .
Aligned and scissor-shifted energy levels are reported in Table 2. We also list the values without the scissor-shifting in the parentheses for references. In the case of nitrogen-doped TiO2, we define the gap as the energy difference between CBM and the Fermi energy (Fermi energy is treated as VBM) since the Fermi energy is on the localized impurity state as discussed later.
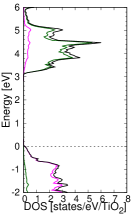
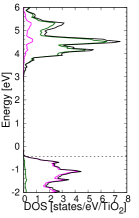
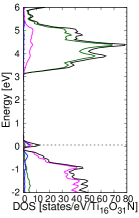
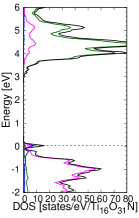
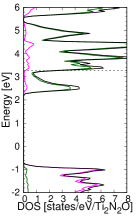
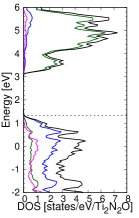
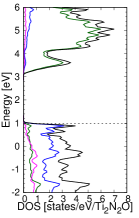
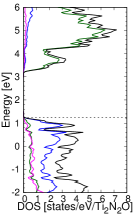
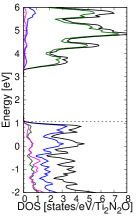
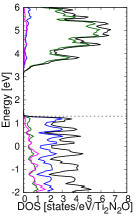
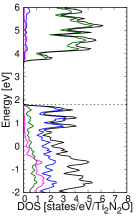
Figure 7 compares projected density of states into titanium , oxygen , and nitrogen orbitals together with the total density of states calculated based on DFT. In this figure, energy levels are aligned and both conduction and valence bands are GW scissor-shifted in the same way as in Table 2.
We now discuss these results in more detail.
V.2.1 Nitrogen substituted TiO2
| (a): Rutile | (b): Anatase | (c): N-doped rutile | (d): N-doped anatase | (e): Ti2O3 | (f)Ti2N2O-I |
 |
 |
 |
 |
 |
 |
| (g): Ti2N2O-II | (h): Ti2N2O-III | (i): Ti2N2O-IV | (j): Ti2N2O-V | (k): Ti2N2O-VI | (l): Ti2N2O-VII |
 |
 |
 |
 |
 |
 |
Substituting nitrogen into either rutile or anatase TiO2 induces localized states just above the valence band maximum. These localized states are 0.25 eV above valence bands in rutile and 0.20 eV in anatase. In both cases Fermi level is crossing the localized band.
However, nitrogen substitution not only introduces localized states, but also shifts valence and conduction bands relative to the undoped case. As a result, upon nitrogen substitution, the gap of rutile TiO2 shifts from 3.14 eV to 3.11 eV while the gap of anatase TiO2 changes from 3.55 eV to 2.98 eV. Similar band-edge shifts are also predicted in a previous DFT study. valentin
As can be seen from Fig. 7 in pristine and nitrogen substituted rutile and anatase TiO2 the valence band is composed mostly of oxygen states, while the isolated impurity band is dominated by the nitrogen states.
V.2.2 Nitrogen substituted Ti2O3: Ti2N2O
Now we discuss electronic structure of seven nitrogen-substituted (Ti2N2O) models. We find that all seven models are semiconducting as expected from the electron-counting rule.
The calculated band-gap values of Ti2N2O models range from 1.81 to 2.32 eV. Among the seven Ti2N2O models, Ti2N2O-I has the smallest band gap. This model is also energetically the most stable one. The band gap of Ti2N2O-I is therefore significantly smaller than that of pristine rutile, anatase, or even nitrogen-doped rutile and anatase. In addition, in Ti2N2O, the top of the conduction band is not formed by the localized band as in the case of nitrogen substituted rutile and anatase.
However, as discussed earlier, photocatalytic activity of TiO2 depends not only on the electronic band gap but it depends also on energy level alignment.
We find that the top of the valence band of the seven Ti2N2O models are higher than that of pristine rutile TiO2 by 0.96–1.76 eV. This alignment is therefore more preferable for water splitting purposes.
Conduction band minimum of most Ti2N2O models are higher than that of pristine rutile TiO2. The most stable model (I) had nearly the same conduction band maximum as pristine rutile TiO2.
Therefore, the reduction of band-gap values in Ti2N2O is achieved mostly by the upward shift of VBM, not by the downward shift of CBM. Therefore Ti2N2O possesses suitable band-edge position for photocatalytic water decomposition. In all the Ti2N2O models, the upper part of the valence band is composed of mainly nitrogen 2 states, as shown in Fig. 7. This result shows the effectiveness of nitrogen substitution to shift up the VBM and thus to form a narrower band gap. The amount of band-edge shift in Ti2N2O-I, the most stable model, is highly notable because it is the most likely candidate among the seven models. Its VBM and CBM shifts from those of pristine rutile TiO2 are 1.34 eV and 0.01 eV in the upward direction, respectively.
VI Summary
In this paper, we have presented a general approach to obtain a variety of purely insulating titanium oxynitride compounds TinN2O2n-3 and we conducted detailed analyses in the cases with the highest nitrogen concentration (). The resulting oxynitride, Ti2N2O, is predicted to have suitable band-edge position for photocatalytic water decomposition. Its band gap (1.81 eV) is much smaller in pristine TiO2 (3.14–3.55 eV). Importantly, most of the band gap reduction originates from the upward shift in energy of the valence band maximum. Furthermore, the energy required to substitute a nitrogen atom into Ti2O3 to form Ti2N2O is smaller than that into TiO2. These results show that Ti2N2O is a more promising material than nitrogen-doped TiO2. We hope that this approach would be extended to cases with lower nitrogen concentration and to other transition-metal oxynitrides.
Acknowledgements.
This work was supported from the MEXT Japan Elements Strategy Initiative to Form Core Research Center, JSPS KAKENHI Grant No. JP25107005, and JSPS Grant No. JP14J11856. We also acknowledge the supports by National Science Foundation Grant No. DMR-1508412 (which provided the DFT calculations) and the Theory of Materials Program at the Lawrence Berkeley National Lab funded by the Director, Office of Science, Office of Basic Energy Sciences, Materials Sciences and Engineering Division, U.S. Department of Energy under Contract No. DE-AC02-05CH11231 (which provided the GW calculations). Computational resources have been provided by the DOE at Lawrence Berkeley National Laboratory’s NERSC facility.References
- (1) F. A. Grant, Rev. Mod. Phys. 31, 646 (1959).
- (2) X. Chen and S. S. Mao, Chem. Rev. 107, 2891 (2007).
- (3) K. Nakata, T. Ochiai, T. Murakami, and A. Fujishima, Electrochim. Acta 84, 103 (2012).
- (4) A. L. Linsebigler, G. Lu, and J. T. Yates, Jr. Chem. Rev. 95, 735 (1995).
- (5) A. Fujishima and K. Honda, Nature 238, 37 (1972).
- (6) K. Hashimoto, H. Irie, and A. Fujishima, Jpn. J. Appl. Phys. 44, 8269 (2005).
- (7) S. S. Mao and S. Shen, Nature Photonics 7, 944 (2013).
- (8) M. Ni, M. K. H. Leung, D. Y. C. Leung, and K. Sumathy, Renew. Sust. Energ. Rev. 11, 401 (2007).
- (9) J. Pascual, J. Camassel, and H. Mathieu, Phys. Rev. B 18, 5606 (1978).
- (10) H. Minoura, M. Nasu, and Y. Takahashi, Ber. Bunsenges. Phys. Chem. 89, 1064 (1985).
- (11) H. Tang, H. Berger, P. E. Schmid, F. Lévy, and G. Burri, Solid State Commun. 87, 847 (1993).
- (12) H. Tang, K. Prasad, R. Sanjinès, P. E. Schmid, and F. Lévy, J. Appl. Phys. 75, 2042 (1994).
- (13) L. Kavan, M. Grtzel, S. E. Gilbert, C. Klemenz, and H. J. Scheel, J. Am. Chem. Soc. 118, 6716 (1996).
- (14) N. Hosoka, T. Sekiya, C. Satoko, and S. Kurita, J. Phys. Soc. Jpn. 66, 877-880 (1997).
- (15) Y. Aoki and S. Saito, J. Phys.: Conf. Ser. 302, 012034 (2011).
- (16) M. Ni, M. K. H. Leung, D. Y. C. Leung, and K. Sumathy, Renew. Sust. Energy Rev. 11, 401 (2007).
- (17) A. Zaleska, Revent Pat. Eng. 2, 157 (2008).
- (18) B. Viswanathan and K. R. Krishanmurthy, Int. J. Photoenergy 2012, 269654 (2012).
- (19) S. Livraghi, M. C. Paganini, E. Giamello, A. Selloni, C. D. Valentin, and G. Pacchioni J. Am. Chem. Soc. 128, 15666 (2006).
- (20) Y. Huang, Z. Zheng, Z. Ai, L. Zhang, X. Fan, and Z. Zou, J. Phys. Chem. B 110, 19323 (2006).
- (21) W. Dang, H. Chen, N. Umezawa, and J. Zhang, Phys. Chem. Chem. Phys. 17, 17980 (2015).
- (22) R. Asahi, T. Morikawa, T. Ohwaki, K. Aoki, and Y. Taga, Science 293, 269 (2001).
- (23) T. Morikawa, R. Asahi, T. Ohwaki, K. Aoki, and Y. Taga, Jpn. J. Appl. Phys. 40, L561 (2001).
- (24) H. Irie, Y. Watanabe, K. Hashimoto, J. Phys. Chem. B 107, 5483 (2003).
- (25) K. Kobayakawa, Y. Murakami, and Y. Sato, J. Photochem. Photobiol. A: Chem. 170, 177 (2005).
- (26) P.-G. Wu, C.-H. Ma, and J. K. Shang, Appl. Phys. A 8, 1411 (2005).
- (27) G. Yang, Z. Jiang, H. Shi, T. Xiao, and Z. Yan, J. Mater. Chem. 20, 5301 (2010).
- (28) T. Lindgren, J. M. Mwabora, E. Avendaño, J. Jonsson, A. Hoel, C.-G. Granqvist, and S.-E. Lindquist, J. Phys. Chem. B 107, 5709 (2003).
- (29) G. R. Torres, T. Lindgren, J. Lu, C.-G. Granqvist, and S.-E. Lindguist, J. Phys. Chem B 108, 5995 (2004).
- (30) M. Mrowetz, W. Balcerski, A. J. Colussi, and M. R. Hoffmann, J. Phys. Chem. B 108, 17269 (2004).
- (31) F. Spadavecchia, G. Cappelletti, S. Ardizzone, M. Ceotto, and L. Falciola, J. Phys. Chem. C 115, 6381 (2011).
- (32) Q. Li and J. K. Shang, J. Am. Ceram. Soc. 91, 3167 (2008).
- (33) Q. Li and J. K. Shang, J. Am. Ceram. Soc. 93, 3039 (2010).
- (34) T. L. Chen, Y. Hirose, T. Hitosugi, and T. Hasegawa, J. Phys. D: Appl. Phys. 41, 062005 (2008).
- (35) Y. Nakano, T. Morikawa, T. Ohwaki, and Y. Taga, Appl. Phys. Lett. 86, 132104 (2005).
- (36) H. Matsui, H. Tabata, N. Hasuike, H. Harima, and B. Mizobuchi, J. Appl. Phys. 97, 123511 (2005).
- (37) M. Kitano, K. Funatsu, M. Matsuoka, M. Ueshima, and M. Anpo, J. Phys. Chem. B 110, 25266 (2006).
- (38) C. Burda, Y. Lou, X. Chen, A. C. S. Samia, J. Stout, and J. L. Gole, Nano Lett. 3, 1049 (2003).
- (39) J. L. Gole, J. D. Stout, C. Burda, Y. Lou, and X. Chen, J. Phys. Chem. B 108, 1230 (2004).
- (40) Y. Aoki and S. Saito, J. Ceram. Soc. Jpn. 121, 373 (2013).
- (41) R. Asahi, Y. Taga, W. Mannstadt, A. J. Freeman, Phys. Rev. B 61, 7459 (2000).
- (42) S.-D. Mo and W. Y. Ching, Phys. Rev. B 51, 13023 (1995).
- (43) K. M. Glassford and J. R. Chelikowsky, Phys. Rev. B 45, 3874 (1992); 46, 1284 (1992).
- (44) H. Nakai, J. Heyd, and G. E. Scuseria, J. Comput. Chem. Jpn. 5, 7 (2006).
- (45) M. Batzill, E. H. Morales, U. Diebold, Phys. Rev. Lett. 96, 026103 (2006).
- (46) A. K. Rumaiz, J. C. Woicik, E. Cockayne, H. Y. Lin, G. H. Jaffari, and S. I. Shah Appl. Phys. Lett. 95, 262111 (2009).
- (47) W. R. Robinson, it J. Solid State Chem. 9, 255 (1974).
- (48) T. J. Godin and J. P. LaFemina, Phys. Rev. B 49, 7691 (1994).
- (49) S. V. Ovsyannikov, X. Wu, A. E. Karkin, V. V. Shchennikov, and G. M. Manthilake, Phys. Rev. B 86, 024106 (2012).
- (50) S. Andersson and A. Magéli, Naturwissenschaften 43, 495 (1956).
- (51) D. Regonini, A. C. E. Dent, C. R. Bowen, S. R. Pennock, J. Taylor, Mater. Lett. 65, 3590 (2011).
- (52) D. Regonini, V. Adamaki, C. R. Bowen, S. R. Pennock, J. Taylor, and A. C. E. Dent, Solid State Ionics 229, 38 (2012).
- (53) A. D. Pearson, J. Phys. Chem. Solids 5, 316 (1958).
- (54) F. J. Morin, Phys. Rev. Lett. 3, 34 (1959).
- (55) J. M. Honig and T. B. Reed, Phys. Rev. 174, 1020 (1968).
- (56) C. E. Rice and W. R. Robinson, Mat. Res. Bull. 11, 1355 (1976).
- (57) I.-H. Hwang, B. Jiang, Z. Jin, C.-I. Park, and S.-W. Han, J. Appl. Phys. 119, 014905 (2016).
- (58) M. Imada, A. Fujimori, Y. Tookura, Rev. Mod. Phys. 70, 1039 (1998).
- (59) M. Onoda, J. Solid State Chem. 136, 67 (1998).
- (60) S. Ohkoshi, Y. Tsunobuchi, T. Matsuda, K. Hashimoto, A. Namai, F. Hakoe, and H. Tokoro, Nature Chem. 2, 539 (2010).
- (61) C. Schlenker, S. Lakkis, J. M. D. Coney, and M. Marezio, Phys. Rev. Lett. 32, 1318 (1974).
- (62) S. Lakkis, C. Schlenker, B. K. Chakravetry, R. Buder, and M. Marezio, Phys. Rev. B 14, 1429 (1976).
- (63) R. F. Bartholomew and D. R. Frankl, Phys. Rev. 187, 828 (1969).
- (64) M. Marezio, D. B. McWhan, P. D. Dernier, and J. P. Remeika, Phys. Rev. Lett. 28, 1390 (1972).
- (65) M. Abbate, R. Potze, G. A. Sawatzky, C. Schlenker, H. J. Lin, L. H. Tjeng, C. T. Chen, D. Teehan, and T. S. Turner, Phys. Rev. B 51, 10150 (1995).
- (66) M. Taguchi, A. Chainani, M. Matsunami, R. Eguchi, Y. Takata, M. Yabashi, K. Tamasaku, Y. Nishino, T. Ishikawa, S. Tsuda, S. Watanabe, C.-T. Chen, Y. Senba, H. Ohashi, K. Fujiwara, Y. Nakamura, H. Takagi, and S. Shin, Phys. Rev. Lett. 104, 106401 (2010).
- (67) J. Yahia and H. P. R. Frederikse, Phys. Rev. 123, 1257 (1961).
- (68) F. J. Morin, Bell System Tech. J. 37, 1047 (1958).
- (69) S. C. Abrahams, Phys. Rev. 130, 2230 (1963).
- (70) D. Adler, Phys. Rev. Lett. 17, 139 (1966).
- (71) D. Kaplan, C. Schlenker, and J. J. Since, Philos. Mag. 36, 1275 (1977).
- (72) K. Kobayashi, T. Susaki, A. Fujimori, T. Tonogai, and H. Takagi, Europhys. Lett. 59, 868 (2002).
- (73) G. Hyett, M. A. Green, and I. P. Parkin, J. Am. Chem. Soc. 129, 15541 (2007).
- (74) A. Salamat, G. Hyett, R. Q. Cabrera, P. F. McMillan, and I. P. Parkin, J. Phys. Chem C 114, 8546, (2010).
- (75) M. Mikami and K. Ozaki, J. Phys.: Conf. Ser. 379, 012006 (2012).
- (76) A. Marzouk, H. Bolvin, P. Reinhardt, L. Manceron, J. P. Perchard, B. Tremblay, and M. E. Alikhani, J. Phys. Chem. A 118, 561 (2014).
- (77) Y. Wu, P. Lazic, G. Hautier, K. Persson, and G. Ceder, Energy Environ. Sci. 6, 157 (2013).
- (78) N. E. Brese, M. O’Keeffe, P. Rauch, and F. J. DiSalvo, Acta Cryst. C47, 2291 (1991).
- (79) M. K. Y. Chan and G. Ceder, Phys. Rev. Lett. 105, 196403 (2010).
- (80) P. Hohenberg and W. Kohn, Phys. Rev. 136, B864 (1964).
- (81) W. Kohn and L. J. Sham, Phys. Rev. 140, A1133 (1965).
- (82) L. Hedin, Phys. Rev. 139, A796 (1965).
- (83) M. S. Hybertsen and S. G. Louie, Phys. Rev. Lett. 55, 1418 (1985).
- (84) M. S. Hybertsen and S. G. Louie, Phys. Rev. B 34, 5390 (1986).
- (85) J. P. Perdew, Phys. Rev. Lett. 55, 1665 (1985).
- (86) J. P. Perdew, K. Burke, and M. Ernzerhof, Phys. Rev. Lett. 77, 3865 (1996); ibid. 78, 1396 (1997).
- (87) N. Troullier and J. L. Martins, Phys. Rev. B 43, 1993 (1991).
- (88) H. J. Monkhorst and J. D. Pack, Phys. Rev. B 13, 5188 (1976).
- (89) M. Methfessel and A. T. Paxton, Phys. Rev. B 40, 3616 (1989).
- (90) R. M. Wentzcovitch, Phys. Rev. B 44, 2358 (1991).
- (91) P. Giannozzi, S. Baroni, N. Bonini, M. Calandra, R. Car, C. Cavazzoni, D. Ceresoli, G. L. Chiarotti, M. Cococcioni, I. Dabo, A. D. Corso, S. de Gironcoli, S. Fabris, G. Fratesi, R. Gebauer, U. Gerstmann, C. Gougoussis, A. Kokalj, M. Lazzeri, L. Martin-Samos, N. Marzari, F. Mauri, R. Mazzarello, S. Paolini, A. Pasquarello, L. Paulatto, C. Sabraccia, S. Scandolo, G. Sclauzero, A. P. Seitsonen, A. Smogunov, P. Umari, and R. M. Wentzcovitch: J. Phys.: Condens. Matter, 21, 395502 (2009).
- (92) S. B. Zhang, D. Tománek, M. L. Cohen, S. G. Louie, and M. S. Hybertsen, Phys. Rev. B 40, 3162 (1989).
- (93) A. Malashevich, M. Jain, and S. G. Louie, Phys. Rev. B 89, 075205 (2014).
- (94) J. Deslippe, G. Samsonidze, D. A. Strubbe, M. Jain, M. L. Cohen, and S. G. Louie, Comput. Phys. Commun. 183, 1269 (2012).
- (95) G. Onida, L. Reining, and A. Rubio, Rev. Mod. Phys. 74, 601 (2002).
- (96) S. Kümmel and L. Kronik, Rev. Mod. Phys. 80, 3 (2008).
- (97) R. W. Godby, M. Schlüter, and L. J. Sham, Phys. Rev. B 37, 10159 (1988).
- (98) S. G. Louie, in Topics in Computational Materials Science, edited by C. Y. Fong (World Scientific, Singapore, 1998).
- (99) M. van Schilfgaarde, T. Kotani, and S. Faleev, Phys. Rev. Lett. 96, 226402 (2006).
- (100) D. O. Scanlon, C. W. Dunnill, J. Buckeridge, S. A. Shevlin, A. J. Logsdail, S. M. Woodley, C. R. A. Catlow, M. J. Powell, R. G. Palgrave, I. P. Parkin, G. W. Watson, T. W. Keal, P. Sherwood, A. Walsh, and A. A. Sokol, Nature Mater. 12, 798 (2013).
- (101) P. Deák, B. Aradi, and T. Frauenheim, J. Phys. Chem. C 115, 3443 (2011).
- (102) C. DiValentin, G. Pacchioni, and A. Selloni, Phys. Rev. B 70, 085116 (2004).