The effects of the overshooting of the convective core on main-sequence turnoffs of young- and intermediate-age star clusters
Abstract
Recent investigations have shown that the extended main-sequence turnoffs (eMSTOs) are a common feature of intermediate-age star clusters in the Magellanic Clouds. The eMSTOs are also found in the color-magnitude diagram (CMD) of young-age star clusters. The origin of the eMSTOs is still an open question. Moreover, asteroseismology shows that the value of the overshooting parameter of the convective core is not fixed for the stars with an approximatelly equal mass. Thus the MSTO of star clusters may be affected by the overshooting of the convective core (OVCC). We calculated the effects of the OVCC with different on the MSTO of young- and intermediate-age star clusters. If varies between stars in a cluster, the observed eMSTOs of young- and intermediate-age star clusters can be explained well by the effects. The equivalent age spreads of MSTO caused by the OVCC are related to the age of star clusters and are in good agreement with observed results of many clusters. Moreover, the observed eMSTOs of NGC 1856 are reproduced by the coeval populations with different . The eMSTOs of star clusters may be relevant to the effects of the OVCC. The effects of the OVCC are similar to that of rotation in some respects. But the effects cannot result in a significant split of main sequence of young star clusters at . The presence of a rapid rotation can make the split of main sequence of young star clusters more significant.
1 INTRODUCTION
The double or extended main-sequence turnoffs (eMSTOs) were discovered in the color-magnitude diagram (CMD) of intermediate-age massive star clusters in the Magellanic Clouds (Mackey & Broby Nielsen, 2007; Mackey et al., 2008; Glatt et al., 2008; Milone et al., 2009; Girardi et al., 2009; Goudfrooij et al., 2009, 2011; Keller et al., 2012; Piatti, 2013). One interpretation of the eMSTOs is that the clusters have experienced an extended star-formation histories (eSFH) with a duration of Myr (Mackey et al., 2008; Glatt et al., 2008; Milone et al., 2009; Girardi et al., 2009; Rubele et al., 2010; Goudfrooij et al., 2011, 2014; Correnti et al, 2014), which disagrees with classical understanding of star clusters being simple stellar populations (SSPs).
The eMSTOs were also discovered in young clusters NGC 1856 (Correnti et al, 2015; Milone et al., 2015), NGC 1755 (Milone et al., 2016a), NGC 1850 (Bastian et al., 2016), and NGC 1866 (Milone et al., 2016b). Moreover, NGC 1856, NGC 1755, and NGC 1866 are found to exhibit dual main sequences (MS) below their MSTO (Milone et al., 2015, 2016a, 2016b).
An alternative interpretation of the eMSTOs is the effects of star rotation (Bastian & de Mink, 2009; Yang et al., 2013; Brandt & Huang, 2015; D’Antona et al., 2015; Niederhofer et al., 2015a). Yang et al. (2013) show that the extension of MSTO caused by star rotations is related to the rotation rate of stars, the efficiency of rotational mixing, and the age of star clusters. A relatively high rotation rate and a high efficient rotational mixing are required to explain the eMSTOs of young clusters [see Figure 8 in Yang et al. (2013, but see Niederhofer et al. 2015a and D’Antona et al. 2015)]. Niederhofer et al. (2015a) claimed that the eMSTO of NGC 1856 can be explained by a rotation of times the Keplerian rotation rate (). But in order to explain the dual MSs of clusters NGC 1856 and NGC 1755, the rotation rate of is required (D’Antona et al., 2015; Milone et al., 2016a). A large number of rapid rotating stars have been found in NGC 1850 and NGC 1856 by Bastian et al. (2017).
However, neither stellar models with different ages only, nor rapid rotating models with different rotation rates, properly reproduce the observed split MS and eMSTO of NGC 1866 (Milone et al., 2016b). The populations with both different ages and different rotation rates are needed to explain NGC 1866 (Milone et al., 2016b). Moreover, D’Antona et al. (2015) stated that their rotating models fail to reproduce the stars “after the end of the central H-burning phase” of NGC 1856. However, these stars might be stars with decretion disks (Bastian et al., 2017) seen nearly edge on, so they suffer from extinction which pushes them into this region.
Another coeval interpretation of the eMSTOs is interacting binaries (Yang et al., 2011; Li et al., 2012, 2015, 2016). Yang et al. (2011) showed that interacting binaries including merged binary systems and the binaries with mass transfer can lead to both the eMSTOs and the dual red-clumps. The effects of the interacting binaries on the CMDs of some clusters should not be neglected, although the number of the interacting binaries in a cluster could be not enough to explain the eMSTOs alone.
One of the important predictions of the eSFH scenario is that the ongoing star-formation should be observed in young star clusters with an age of a few hundred Myr. However, up to now, the expected ongoing star-formation is not observed in young clusters with age beyond 10 Myr (Bastian et al., 2013, 2016; Cabrera-Ziri et al, 2014, 2016; Niederhofer et al., 2015b). Goudfrooij et al. (2011, 2014) and Correnti et al (2014) argued that the eMSTOs can occur only in clusters with masses larger than a threshold of about and with escape velocity greater than km s-1. However, the eMSTOs of NGC 1755 (Milone et al., 2016a) and NGC 411 (Li et al., 2016a) would represent a challenge for this scenario. Furthermore, the observation that there exists a strong correlation between cluster age and the inferred age spread as found by Niederhofer et al. (2015a) also rules out an actual age spread being the origin of the eMSTO.
Li et al. (2014) analyzed the sub-giant branch (SGB) of NGC 1651 harbouring an eMSTO and found that the SGB is narrower and offsets from what would be inferred from the eMSTO region if the large age spreads would be present within the cluster. Similar results were found in NGC 1806 and NGC 1846 (Bastian& Niederhofer, 2015) and NGC 411 (Li et al., 2016a). Hence, they concluded that age spreads are not likely to be the cause of the eMSTO phenomenon. However, Goudfrooij et al. (2015) found that the cross-SGB profiles of NGC 1651, NGC 1806, and NGC 1846 are consistent with their cross-MSTO profiles when the latter are interpreted as age distributions. Conversely, their SGB morphologies are inconsistent with those of simulated SSPs. The origin of the eMSTOs is still an open question.
The overshooting of the convective core (OVCC) can bring more hydrogen-rich material into H-burning core, which significantly prolongs the lifetime of the burning of core hydrogen and enhances the He-core mass left behind. The distance of the overshooting of a convection is defined as , where is a free parameter and is the local pressure scale-height. Recently, Yang (2016b) developed a method to determine the size of the convective core including the overshooting region from observed oscillation frequencies of low-degree -modes. It was found that the value of is variable for stars with an approximatelly equal mass. For example, the value of is for KIC 9812850 with (Yang, 2016b), for KIC 2837475 with (Yang et al., 2015), for Procyon with (Guenther et al., 2015; Bond et al, 2015), for HD 49933 with (Liu et al., 2014), and for KIC 11081729 with (Yang, 2015). The typical errors of the value of are . If a variable overshooting exists in stars with masses larger than , the MSTO of young- and intermediate-age star clusters would be affected by the overshooting.
In this work, we mainly focus on whether the eMSTOs of young- and intermediate-age star clusters can be explained by the effects of the OVCC. The paper is organized as follows: we show our calculation results in Section 2, and the results are compared with observations in Section 3, then we discuss and summarize the results in Section 4.
2 CALCULATION RESULTS
2.1 Evolutionary tracks
In order to study the effects of overshooting of the convective core on the MSTO of star clusters, we computed a grid of evolutionary models with the initial metallicity , in the range of with a resolution of , supplemented by , and masses between and . The resolution of mass varies from to . We used the Yale Rotation Evolution Code (YREC) (Pinsonneault et al., 1989; Yang & Bi, 2007; Yang, 2016a) to construct the models in its non-rotation configuration. The OPAL equation-of-state table EOS2005 (Rogers & Nayfonov, 2002) and OPAL opacity table GN93 (Iglesias & Rogers, 1996) were adopted, supplemented by the Alexander & Ferguson (1994) opacity tables at low temperature. The diffusion and settling of both helium and heavy elements are computed by using the diffusion coefficients of Thoul et al. (1994) for models with a mass less than . Convection is treated according to the standard mixing-length theory. The value of the mixing-length parameter is fixed at . The full mixing of material is assumed in the overshooting region. All models are evolved from zero-age MS to the red giant branch (RGB).
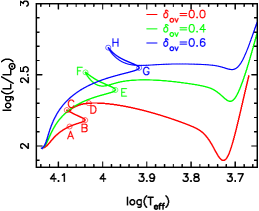
Figure 1 shows the evolutionary tracks of models with but with different . The evolutionary tracks are obviously affected by the OVCC. The model with a large mainly exhibits to be bluer than the model with a smaller at a given age and the lifetime of the burning of core hydrogen is significantly prolonged, but the lifetime of SGB is shrunk. For example, the lifetime of the SGB of the model with and = 0 is Myr, which is of its MS lifetime. But the lifetime of the SGB of the model with and = is only Myr, which is about of its MS lifetime. The Hertzsprung gap of the model with a large is obviously narrower than that of the model without the OVCC.
The values of the central hydrogen at points B, E, and G in Figure 1 are about , , and , respectively, while the values of at points C, F, and H are around , , and , respectively. Compared with the whole MS lifetime of stars with a large , the timescale of their MS hook is very short. Thus we define the points B, E, and G as the end of central H-burning phase. Due to the fact that more hydrogen-rich material is brought into H-burning core by the OVCC, the stars with the OVCC produce more nuclear energy. Part of the energy makes the stars more luminous. The other is transformed into internal energy, which leads to the fact that the stars expand obviously, i.e., the radius of the stars increases significantly. As a consequence, the effective temperature of the stars decreases at the end of central H-burning phase. And the star with a larger is brighter and redder than the star with a small at the end of central H-burning phase. Thus, the MS width and MSTO of a star cluster must be extended by the presence of the OVCC with different .
Moreover, due to the fact that the timescale of the MS hook of the model with a large is significantly shrunk, the structure of MS hook of a young star cluster including many stars with the large is hard to be exhibited in the observed CMD of the cluster.
2.2 Isochrones
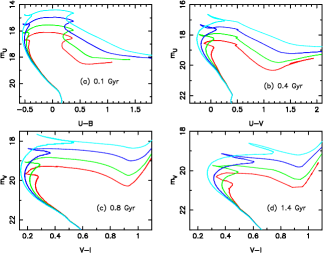
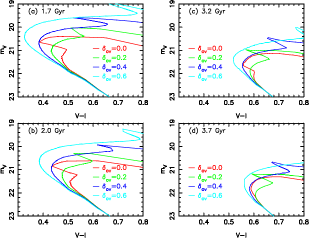
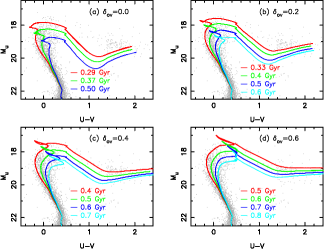
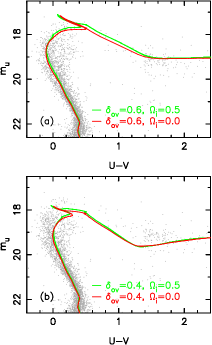
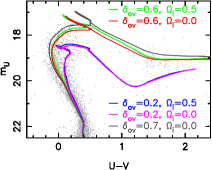
In order to understand the effects of an OVCC on the MSTO of young- and intermediate-age star clusters, we calculated isochrones with different . To obtain the CMDs of the isochrones, the theoretical properties ([Fe/H], , , ) of models are transformed into colors and magnitudes using the color transformation tables of Lejeune et al. (1998). A distance modulus of is adopted, and the value of is adopted for in the calculation. Figure 2 shows the CMDs of isochrones of models with different . Comparing the isochrones of models with a large to those of models with a smaller , one can find that the upper MS and the MSTO of young- and intermediate-age star clusters are extended by the OVCC when the different OVCCs exist in clusters. However, the lower MS of the clusters are almost not affected. For the isochrones with the age of Myr, the separation between the isochrone of models with and that of models with is about 0.1 mag in color U-V at m, but it is only around mag at m. However, the separation is about mag in color V-I at m. The eMSTO of young clusters is better visible in U-V than in V-I (see the panel of Figure 2 and Figure 3). These characteristics are similar to those found in NGC 1856 and NGC 1755 (Milone et al., 2015, 2016a) and are also expected in the rotational scenario.
3 COMPARISON WITH OBSERVATIONAL RESULTS
3.1 The equivalent age spread caused by the OVCC
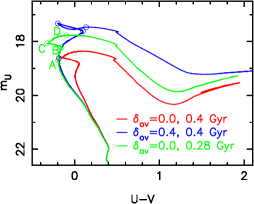
We assumed that a distribution of such as a bimodal of and exists in a star cluster. The isochrones of models with are chosen as the standard one. The isochrones of models with a large are compared to those of models with to obtain the equivalent age spread caused by the OVCC. Hereafter, the beginning and the end points of MS hook of an isochrone are labeled as B and C, respectively. The local bluest point (local minimum U-V) of MS is marked as point A, and the brightest point (minimum ) after point C is labeled as point D (see Figure 4). The values of the central hydrogen of models at points A, B, C, and D on the isochrone with age Myr are about , , , and , respectively. According to the initial mass function, the more massive the stars, the less the number of the stars. Moreover, the more massive the stars, the faster their evolutions. The stars between point C and D ( between about and 0 for but between about and 0 for ) should be rare in a young star cluster. Thus we compare the non-overshooting isochrone between point A and B to the isochrone with an overshooting to obtain the equivalent age spread. For example, inspected by eyes, the non-overshooting isochrone between point A and B in Figure 4 is considered to overlap with the overshooting isochrone with and age Myr. Thus, the equivalent age spread caused by the overshooting with is Myr when the age of the cluster is Myr. The equivalent age spreads for other isochrones with different and ages are obtained in the similar way. The “points C and D” on the isochrone with age Myr and cannot be matched by those of any isochrone with . Thus, we cannot obtain the equivalent age spread through comparing the points C or D of isochrones with different .
Due to the fact that the models with a large are obviously brighter and redder than the models with a smaller at the end of central H-burning phase, the end point of the central H-burning phase of an isochrone with cannot be reproduced by that of the isochrones with (see Figure 4). Thus, when one uses the isochrones with a small to fit the CMD of a cluster including many stars with a larger , one could find that there are many stars that cannot be reproduced after the end of the central H-burning phase.
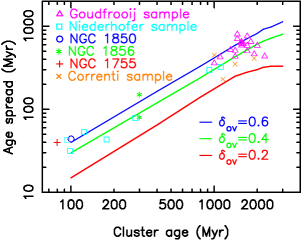
In order to understand whether the effects of the OVCC can explain the observed eMSTOs of star clusters, the equivalent age spreads caused by the OVCC are extracted as mentioned above and compared to observed ones. We do a similar experiment as Niederhofer et al. (2015a). Figure 5 shows the comparison between the equivalent age spreads and those observed by Goudfrooij et al. (2014), Niederhofer et al. (2015b), Correnti et al (2014, 2015), Milone et al. (2015, 2016a), and Bastian et al. (2016). The values of the age spreads of Goudfrooij sample adopted here are the values of , which are considered to cannot be explained by rotating models (Goudfrooij et al., 2014, but see Brandt & Huang 2015 and Niederhofer et al. 2015a). The equivalent age spreads increase with an increase in age of star clusters and , and are in good agreement with the observed ones, which shows that the observed eMSTOs of young- and intermediate-age star cluster can be interpreted by the effects of the OVCC. The inferred age spreads of a given shown in Figure 5 are relative to the same age isochrone with , i.e. the extension of MSTO caused by a at a given age is relative to the isochrone with the same age but with . Keep in mind that a single value of cannot produce any eMSTO in the CMD of a cluster. And the trend between the age of star clusters and the inferred age spread is also expected in the rotational scenario.
Figure 5 shows that the equivalent age spreads caused by the OVCC increase with an increase in age of star clusters. However, when the age of star clusters is larger than 2 Gyr, the equivalent age spreads caused by = 0.2 almost not increase with an increase in age of clusters. This is because the convective core of low mass stars shrink during their MS. But for more massive stars, the convective core increases in size during the initial stage of MS of these stars before the core begins to shrink. The larger the , the later the core begins to shrink. In the late stage of the MS of stars, when the core shrinks to a certain degree, the chemical composition of the core including the overshooting region is mainly helium. At this time, the effects of the overshooting on the evolution of stars are not significant. The smaller the value of the , the earlier this scenario appears. Therefore, the equivalent age spreads caused by the OVCC cannot increase continuously with an increase in age of star clusters. As a consequence, the equivalent age spreads caused by = 0.2 reach a maximum of about Myr at the age of about Gyr.
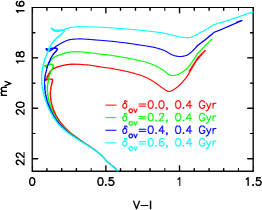
Niederhofer et al. (2016) have shown that observationally there is a peak in the inferred age spread at age Gyr, which is consistent with that expected by rotation models of Yang et al. (2013). The equivalent age spread is still present at age Gyr in OVCC scenario. But the width of eMSTO caused by the OVCC reaches a maximum in color V-I of CMD of star clusters at age Gyr, and then decreases with an increase or decrease in age (see panels and of Figure 2 and Figure 6). The equivalent age spread caused by is about 300 Myr at age Gyr. But the separation between the MS of models with = 0.2 and that of models with = 0 is only mag at mag, which is comparable with the observational error. The separation is around mag at mag (see panel of Figure 6). When the age of clusters is about Gyr, the MS of models with is very close to that of models with in the CMD; the separation between the isochrone and the isochrone is about mag at mag. The maximum separation between the MS of the or isochrone and that of the isochrone in color V-I at age Gyr is about times as large as that at age Gyr, and is around times as large as that at age Gyr. The eMSTO caused by a large should be present in the CMD of star clusters with ages Gyr unless the fraction of stars with the large is too small. But it is not as evident as that in intermediate-age star clusters. This trend is not reflected by the equivalent age spreads.
3.2 Comparison with NGC 1856
3.2.1 The eSFH scenario
NGC 1856 exhibits the extended MSTOs. Niederhofer et al. (2015a) claimed that the eMSTOs of NGC 1856 can be explained by the effects of rotation with initial rotation rate .
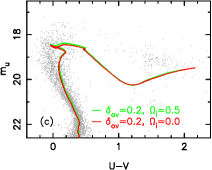
In Figure 7, we compare the data of NGC 1856 to models with different , which shows that the stars at the end of the central H-burning phase and the subgiants can be reproduced by the models with and but cannot be reproduced by the models with or . The age of a star cluster obtained from isochrones increases with an increase in . For example, when one uses the isochrones of models with to fit the CMD of NGC 1856, one could obtain an age of Myr; however, when one uses the isochrones of models with to fit the CMD, an age of Myr would be obtained. Moreover, Figure 7 also shows that one would obtain a smaller age spread if one uses the isochrones with a small to fit the eMSTOs of NGC 1856. Panel of Figure 7 shows that the eMSTOs of NGC 1856 can be explained by an age spread no more than Myr of models with .
NGC 1856 also exhibits the dual MSs. The dual MSs of NGC 1856 are separated by mag in color U-V at and merge together magnitudes below (Milone et al., 2015). In order to explain the split MS, the rotation as high as 0.9 is required (D’Antona et al., 2015). Moreover, the simulated populations of D’Antona et al. (2015) cannot reproduce the stars near the end of the central H-burning phase (see their figure 4). But this might be due to stars with decretion disks seen nearly edge on (Bastian et al., 2017).
The separation between the isochrone with age Myr and that with age Myr is mag in color U-V at , which is in good agreement with observation of Milone et al. (2015), and is only mag at . Recently, Li et al. (2016c) analyzed the data of NGC 1856 and speculated that the rapid stellar rotation scenario is the favored explanation of the multiple sequences of NGC 1856 rather than eSFH scenario.
3.2.2 Rapid rotation scenario
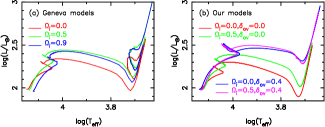
We computed rapid rotation models with and with the rotational mixing efficiency for the Sun (Pinsonneault et al., 1989; Yang & Bi, 2007). In Figure 8, we compare the evolutionary tracks of our models with those of Geneva models (Georgy et al., 2013), which shows that our rotating and non-rotating models with are comparable with Geneva models. Figure 8 shows that the effects of the OVCC with on the end point of central H-burning phase cannot be mimicked by the effects of the rapid rotation. When both the OVCC and the rapid rotation exist in a star, the effects of the OVCC will play a dominant role because the OVCC can mix all material in the overshooting region with that in the convective core but the rotational mixing only brings a small part of material in the shell on the top of the overshooting region into the convective core.
Due to the centrifugal effect, rotating models are fainter and redder than non-rotating overshooting models in the early stage of MS. However, in the late stage of MS, due to the fact that slightly more H-rich material is brought into H-burning core by rotational mixing, rotating models produce slightly more nuclear energy. Thus, they exhibit slightly brighter than non-rotating overshooting models (see the panel of Figure 8). However, the rotational mixing in the radiative region also leads to an increase in the mean density of the region, i.e. a decrease in radius of stars, which results in the fact that rotating models have a higher effective temperature at the end of central H-burning phase. As a consequence, rotating overshooting models are slightly brighter and bluer than non-rotating overshooting models at the end of the central H-burning phase.
In panels , , and of Figure 9, we compare rotating and non-rotating models with different to the data of NGC 1856, which show that the effects of the rotation of are not enough to explain the eMSTOs of NGC 1856 in our calculations. Due to the fact that the centrifugal effect plays a dominant role in the early stage of MS phase of stars whose envelope is radiative (with masses ) and leads to the fact that rotating models are fainter and redder than non-rotating models, the MS of rotating models is almost parallel with that of non-rotating models between and . The separation between the MS of rotating models and that of non-rotating models is about mag. A higher rotation rate will lead to a larger separation. But the characteristic of the parallel separation seems to be not in good agreement with that of NGC 1856.
If there exist a large and a rapid rotation in stars, the elements produced in the core can be easily brought to the surface of the stars. For the model with and in young clusters, the surface nitrogen abundance at the end of MS is about times as large as the initial abundance. But for the models with and and the models with without rotation, the surface nitrogen abundance is almost invariable in MS phase. If there is a nitrogen spread in MSTO stars that would reflect the coexistence of rapid rotation and large . Due to the mixing effect of deep convective envelope, the surface nitrogen abundance in RGB is about times as large as the initial abundance. But for the cluster with an age of Myr, the envelopes of RGB stars with and are radiative. Their nitrogen abundance cannot be enhanced. For RGB stars with an age Gyr, the surface nitrogen abundance of models with is about times as large as that of models with in non-rotation case, but is about times in rotation case.
3.2.3 Variable overshooting scenario
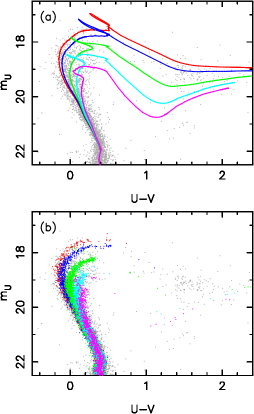
In Figure 10, we compare overshooting models with the same age but with different to the data of NGC 1856. Panel of Figure 10 shows that the eMSTOs of NGC 1856 can be explained well by the effects of between 0 and 0.7. The separation between the isochrone with and that with is about 0.1 mag at and is around 0.014 mag at .
In order to understand whether or not overshooting models can produce the eMSTOs and the split MSs of NGC 1856, we performed a stellar population synthesis by way of Monte Carlo simulations following the initial mass function of Salpeter (1955). Milone et al. (2015) found that about and of stars belong to the blue- and red-MS in NGC 1856, respectively. We assumed % of population with , % of population with , % of population with , % of population with , and % of population with . In the synthesized population, we included observational errors taken to be a Gaussian distribution with a standard deviation of 0.03 in magnitude and color. Panel of Figure 10 shows that the eMSTO of NGC 1856 is reproduced well by the simulated coeval population.
Moreover, panel of Figure 10 shows that the bottom of the RGB of our variable models is located at U-V and . Both the observational and the simulated results show that there are many stars. These stars cannot appear in the simulations of eSFH models and rapid rotation models.
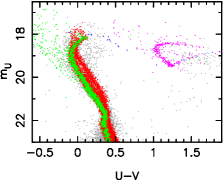
The intermediate-age star clusters have a relatively tight SGB (Li et al., 2014, 2016a). The subgiants of NGC 1856 seem to be not reproduced well by the simulation. The larger the , the shorter the timescale of subgiants. Moreover, the number of stars with and are less than that of stars with . Thus, it is hard for the subgiants with and to occur in the CMD. The number of stars with are much less than that of stars with . Therefore, the number of subgiants obtained by the simulation are also rare. In order to understand why there are many stars with U-V between about 0.6 and 1.2 in the CMD of NGC 1856, we calculated a binary-star stellar population following Yang et al. (2011) by using the Hurley rapid binary evolution codes (Hurley et al., 2002). The calculation shows that the effects of binary stars are not enough to explain the eMSTOs of NGC 1856. However, the calculation clearly shows that there are many interacting binary stars with core-helium burning (CHeB) whose luminosity and the effective temperature are very close to that of subgiants (see Figure 11). The subgiant branch of NGC 1856 could be polluted by the CHeB interacting binary stars. Many of stars of NGC 1856 with U-V between about and and with around mag might be the CHeB interacting binaries. Moreover, the CHeB interacting binaries could make us misunderstand that the “subgiants” of NGC 1856 mainly concentrate towards the end of the blue-MS expected from the MSTOs of the cluster.
When both the effects of a rapid rotation and that of different OVCCs exist in the star cluster NGC 1856, Figure 12 clearly shows that the effects of the rapid rotation of on the eMSTOs are negligible compared with the effects of the different . The eMSTOs of the isochrones mainly result from the effects of the OVCC. The separation between the isochrone with and and that with and is about mag at and is around mag at . The centrifugal effect increases with an increase in rotation rate. A higher rotation rate will lead to the more significant split at , which cannot be mimicked by the effects of OVCC. Thus, the determinations of rotation rates of stars and the split of MS of young clusters at aid in determining the effects of rotation.
The split MS of NGC 1856 was not reproduced by OVCC models. This could not rule out OVCC scenario because variable and rapid rotation could coexist in a star cluster. Moreover, the blue MS could be affected by interacting binaries (see Figure 11).
3.2.4 A prediction of OVCC models
There is a pulsation constant
| (1) |
for pulsating stars, where is a period of pulsating stars, or a large frequency separation
| (2) |
for stars with solar-like oscillations. In a star cluster, the radii of MSTO stars with a large are much larger than those of MSTO stars with a small . Thus, the periods of the former could be about times as long as those of the latter. For example, at the end of the central H-burning phase of a star with , the period of the model with is about times as long as that of the model with . In other words, if the variable exists in a star cluster, long-periodic pulsating/variable stars (in bright MSTO) and short-periodic pulsating stars (in faint MSTO) would be observed in the star cluster. This case cannot occur in rotation scenario and eSFH scenario. For example, a difference of Myr in age can only lead to a change of about , depending on the age, in frequencies or periods of pulsation of MSTO stars. Gravity darkening caused by the angle of view cannot result in any change in the frequencies or periods. Thus, asteroseismical observation for the young- and intermediate-age star clusters would directly rule out or confirm OVCC scenario, and show what plays a dominant role in the origin of the eMSTO.
4 DISCUSSION AND SUMMARY
Figures 5 and 10 show that the OVCC can lead to the observed eMSTOs. The variable OVCC is a good potential mechanism for explaining the eMSTOs of star clusters. However, it is dependent on the fraction of stars with a large that whether or not the OVCC is responsible for the observed eMSTOs of star clusters. Asteroseismology only tells us that the value of can be different for different stars with an approximatelly equal mass. It has not revealed the fraction of stars with a large . Why there are different for stars is another open question for asteroseismology and stellar physicists.
The OVCC is more efficient than rotation at bringing H-rich material into the H-burning core. The effects of the OVCC with on the MSTO of star clusters is hard to be mimicked by the effects of a rapid rotation. In order to reproduce the stars of NGC 1856 at the end of central H-burning phase, an overshooting of around 0.4 is required for our models. When both the OVCC and a rapid ratation exist in stars, the MSTO is mainly affected by the effects of the OVCC. However, the centrifugal effect of the rapid rotation playing a role in the MS stars whose envelope is radiative leads to the fact that the split of MS is more significant.
The points C and D of the rotating isochrones with can be matched by those of non-rotating isochrones with the same but with different ages. The equivalent age spread obtained by comparing points C and D of a rotating isochrone to those of non-rotating isochrone with the same is twice more than that obtained through comparing points A and B of the rotating isochrone to those of non-rotating isochrone. Niederhofer et al. (2015b) might overestimate the equivalent age spreads caused by rotation. Moreover, the higher the efficiency of the rotational mixing, the more the H-rich material brought into the H-burning core, the larger the luminosity of the rotating models at the end of central H-burning phase, which can lead to an increase in the equivalent age spread caused by rotation. These may be the reason why the equivalent age spread of Niederhofer et al. (2015b) rotating models can match that of NGC 1856 but that of our rotating models cannot. However, a high efficiently rotational mixing in the radiative region of stars can hinder stellar expansion and lead to the fact that the evolutionary tracks of the stars move towards the upper left of the Hertzsprung-Russell diagram. Thus, the effects of a large are different from that of rotation.
The equivalent age spread between the isochrone with and that with in panel of Figure 10 is Myr, and the spread between the isochrone with and that with is Myr, which are close to the spread of 150 Myr determined by Milone et al. (2015). The equivalent age spread between the isochrone with and that with is Myr, which is larger than that determined by Milone et al. (2015). However, Figure 10 shows that the width between the MSTO of the isochrone with and that with does not exceed that of NGC 1856.
Due to the fact that the lifetimes of the SGB of the stars with a large are much shorter than those of the stars without overshooting or with a small , the population of SGB is not only dependent on the number of stars but also dependent on . Moreover, the SGB of young star clusters could be polluted by the CHeB interacting binaries. Thus, the SGB of young star clusters cannot be used to study the origin of the eMSTOs.
The effects of OVCC on the MSTO of young- and intermediate-age star clusters are similar to that of rotation. The equivalent age spread caused by rotation has a peak at age Gyr (Yang et al., 2013), which is dependent on the efficiency of rotational mixing. The observationally inferred age spread also has a peak at age Gyr (Niederhofer et al., 2016; Li et al., 2016b). This characteristic does not occur in OVCC models. The eMSTO caused by the OVCC is still present in star clusters with age Gyr. The eMSTO is hard to be exactly described by the equivalent age spreads relative to the same age isochrone with , especially for star clusters with age Gyr. Our models show that the width of the eMSTO caused by a of or at age Gyr is about times as wide as that at age Gyr. The width of the eMSTO caused by the OVCC has a peak in color V-I of CMD of star clusters at age Gyr, and then decreases with an increase or decrease in age, which cannot be reflected by the equivalent age spreads. In rotation models of Yang et al. (2013), the eMSTO can occurs in star clusters with age larger than Gyr because rotational mixing exists in stars like the Sun (Yang & Bi, 2007; Yang, 2016a). Thus the eMSTO of star clusters with age Gyr cannot be used to differentiate OVCC models and rotation models. If eMSTO does not exist in star clusters with ages between and Gyr that is hard to be explained by OVCC scenario. Perhaps, that is due to the fraction of stars with a large being small in the star clusters.
At the end of the central H-burning phase of rapid rotation models, the surface nitrogen abundance can be enriched by in young star clusters for a between 0.4 and 0.6. This does not happen in the rotating models with and the non-rotating models. Moreover, the pulsating periods of bright MSTO stars would be longer than those of faint MSTO stars in OVCC scenario because the former has a low mean density, which also does not occur in rotation scenario and eSFH scenario. These characteristics could aid us in differentiating OVCC scenario and rotation scenario.
Asteroseismology has shown that the value of overshooting parameter of the convective core is variable for stars with an approximatelly equal mass. We calculated the effects of the OVCC on the MSTO of young- and intermediate-age star clusters, and found that the observed eMSTOs of young- and intermediate-age star clusters can be explained well by the effects of the OVCC with different . The equivalent age spread caused by the OVCC increases with an increase in age of star clusters and an increase in . Due to the fact that the convective core of stars can shrink during the late stage of MS, the equivalent age spread cannot increase continuously with an increase in age of star clusters. The eMSTOs of NGC 1856 can be reproduced well by the coeval populations with different . The effects of a rotation with and the rotational mixing efficiency for the Sun on the MSTO of a cluster with an age of Myr are negligible compared with the effects of the OVCC. However, the presence of the rotation can result in the fact that the split of MS of the cluster is more significant. The eMSTOs of star clusters may be related to the effects of the OVCC with different . But keep in mind that a single value of cannot produce any eMSTO in the CMD of clusters. Asteroseismical observation would confirm or rule out OVCC scenario.
References
- Alexander & Ferguson (1994) Alexander, D. R., & Ferguson, J. W. 1994, ApJ, 437, 879
- Bastian et al. (2013) Bastian, N., Cabrera-Ziri, I., Davies, B., & Larsen, S. S. 2013, MNRAS, 436, 2852
- Bastian et al. (2017) Bastian, N., Cabrera-Ziri, I., Niederhofer, F., et al. 2017, MNRAS, arXiv: 1611.06705
- Bastian & de Mink (2009) Bastian, N., & de Mink, S. E. 2009, MNRAS, 398, L11
- Bastian& Niederhofer (2015) Bastian, N., & Niederhofer, F. 2015, MNRAS, 448, 1863
- Bastian et al. (2016) Bastian, N., Niederhofer, F., Kozhurina-Platais, V., et al. 2016, MNRAS, 460, L20
- Bond et al (2015) Bond, H. E., Gilliland, R. L., Schaefer, G. H. et al. 2015, ApJ, 813, 106
- Brandt & Huang (2015) Brandt, T. D., Huang, C. X. 2015, ApJ, 807, 25
- Cabrera-Ziri et al (2014) Cabrera-Ziri, I., Bastian, N., Davies, B., Magris, G., Bruzual, G., Schweizer, F. 2014, MNRAS, 441, 2754
- Cabrera-Ziri et al (2016) Cabrera-Ziri, I., Bastian, N., Hilker, M., et al. 2016, MNRAS, 457, 809
- Correnti et al (2014) Correnti, M., Goudfrooij, P., Kalirai, J. S., et al. 2014, ApJ, 793, 121
- Correnti et al (2015) Correnti, M., Goudfrooij, P., Puzia, T. H., de Mink, S. E. 2015, MNRAS, 450, 3054
- D’Antona et al. (2015) D’Antona, F., Di Criscienzo, M., Decressin, T., et al. 2015, MNRAS, 453, 2637
- Georgy et al. (2013) Georgy, C., Ekström, S., Granada, A., et al. 2013, A&A, 553, A24
- Girardi et al. (2009) Girardi, L., Rubele, S., & Kerber, L. 2009, MNRAS, 394, L74
- Glatt et al. (2008) Glatt, K., Grebel, E. K., & Sabbi, E. et al. 2008, AJ, 136, 1703
- Goudfrooij et al. (2014) Goudfrooij, P., Girardi, L., Kozhurina-Platais, V., et al. 2014, ApJ, 797, 35
- Goudfrooij et al. (2015) Goudfrooij, P., Girardi, L., Rosenfield, P., et al. 2015, MNRAS, 450, 1693
- Goudfrooij et al. (2011) Goudfrooij, P., Puzia, T. H., Chandar, R., & Kozhurina-Platais, V. 2011, ApJ, 737, 4
- Goudfrooij et al. (2009) Goudfrooij, P., Puzia, T. H., Kozhurina-Platais, V., & Chandar, R. 2009, AJ, 137, 4988
- Guenther et al. (2015) Guenther, D. B., Demarque, P., Gruberbauer, M. 2014, ApJ, 787, 164
- Hurley et al. (2002) Hurley, J. R., Tout, C. A., & Pols, O. R. 2002, MNRAS, 329, 897
- Iglesias & Rogers (1996) Iglesias, C., Rogers, F. J. 1996, ApJ, 464, 943
- Keller et al. (2012) Keller, S. C., Mackey, A. D., & Da Costa, G. S. 2012, ApJ, 761, 5
- Lejeune et al. (1998) Lejeune, T., Cuisinier, F., & Buser, R. 1998, A&A, 130, 65
- Li et al. (2016a) Li, C., de Grijs, R., Bastian, N., et al. 2016a, MNRAS, 461, 3212
- Li et al. (2014) Li, C., de Grijs, R., Deng, L. 2014, Nature, 516, 367
- Li et al. (2016b) Li, C., de Grijs, R., Deng, L. 2016b, RAA, 16, 179
- Li et al. (2016c) Li, C., de Grijs, R., Deng, L., & Milone, A. P. 2016c, ApJ, arXiv: 1611.04659
- Li et al. (2015) Li, Z., Mao, C., Chen, L. 2015, ApJ, 802, 44
- Li et al. (2012) Li, Z., Mao, C., Chen, L., Zhang, Q. 2012, ApJ, 761, 22
- Li et al. (2016) Li, Z., Mao, C., Zhang, L., Zhang, X., Chen, L. 2016, ApJS, 255, 7
- Liu et al. (2014) Liu, Z., Yang, W., Bi, S., et al. 2014, ApJ, 780, 152
- Mackey & Broby Nielsen (2007) Mackey, A. D., & Broby Nielsen, P. 2007, MNRAS, 379, 151
- Mackey et al. (2008) Mackey, A. D., Broby Nielsen, P., Ferguson, A. M. N., & Richardson, J. C. 2008, ApJ, 681, L17
- Milone et al. (2009) Milone, A. P., Bedin, L. R., Piotto, G., & Anderson, J. 2009, A&A, 497, 755
- Milone et al. (2015) Milone, A. P., Bedin, L. R., Piotto, G., et al. 2015, MNRAS, 450, 3750
- Milone et al. (2016a) Milone, A. P., Marino, A. F., D’Antona, F., et al. 2016a, MNRAS, 458, 4368
- Milone et al. (2016b) Milone, A. P., Marino, A. F., D’Antona, F., et al. 2016b, arXiv:1611.06725
- Niederhofer et al. (2015a) Niederhofer, F., Georgy, C., Bastian, N., Ekström, S. 2015a, MNRAS, 453, 2070
- Niederhofer et al. (2015b) Niederhofer, F., Hilker, M., Bastian, N., Silva-Villa, E. 2015b, A&A, 575, 62
- Niederhofer et al. (2016) Niederhofer, F., Bastian, N., Kozhurina-Platais, V., et al. 2016, A&A, 586, A148
- Piatti (2013) Piatti, A. E. 2013, MNRAS, 430, 2358
- Piatti & Bastian (2016) Piatti, A. E., & Bastian, N. 2016, MNRAS, 463, 1632
- Pinsonneault et al. (1989) Pinsonneault, M. H., Kawaler, S. D., Sofia, S., & Demarqure, P. 1989, ApJ, 338, 424
- Rogers & Nayfonov (2002) Rogers, F. J., & Nayfonov, A. 2002, ApJ, 576, 1064
- Rubele et al. (2010) Rubele, S., Kerber, L., & Girardi, L. 2010, MNRAS, 403, 1156
- Salpeter (1955) Salpeter, E. E. 1955, ApJ, 121, 16
- Thoul et al. (1994) Thoul, A. A., Bahcall, J. N., Loeb, A. 1994, ApJ, 421, 828
- Yang (2015) Yang, W. 2015, arXiv:1508.00955
- Yang (2016a) Yang, W. 2016a, ApJ, 821, 108
- Yang (2016b) Yang, W. 2016b, ApJ, 829, 68
- Yang & Bi (2007) Yang, W., & Bi, S. 2007, ApJL, 658, L67
- Yang et al. (2013) Yang, W. M., Bi, S. L., Meng, X. C., Liu, Z. 2013, ApJ, 776, 112
- Yang et al. (2011) Yang, W. M., Meng, X. C., Bi, S. L., et al. 2011, ApJ, 731, L37
- Yang et al. (2015) Yang, W., Tian, Z., Bi, S., Ge, Z., Wu, Y., & Zhang, J. 2015, MNRAS, 453, 2094