Physical Structures of the Type Ia Supernova Remnant N103B
Abstract
N103B is a Type Ia supernova remnant (SNR) projected in the outskirt of the superbubble around the rich cluster NGC 1850 in the Large Magellanic Cloud (LMC). We have obtained H and continuum images of N103B with the Hubble Space Telescope (HST) and high-dispersion spectra with 4m and 1.5m telescopes at Cerro Tololo Inter-American Observatory. The HST H image exhibits a complex system of nebular knots inside an incomplete filamentary elliptical shell that opens to the east where X-ray and radio emission extends further out. Electron densities of the nebular knots, determined from the [S II] doublet, reach 5300 cm-3, indicating an origin of circumstellar medium, rather than interstellar medium. The high-dispersion spectra reveal three kinematic components in N103B: (1) a narrow component with [N II]6583/H 0.14 from the ionized interstellar gas associated with the superbubble of NGC 1850 in the background, (2) a broader H component with no [N II] counterpart from the SNR’s collisionless shocks into a mostly neutral ambient medium, and (3) a broad component, 500 km s-1, in both H and [N II] lines from shocked material in the nebular knots. The Balmer-dominated filaments can be fitted by an ellipse, and we adopt its center as the site of SN explosion. We find that the star closest to this explosion center has colors and luminosity consistent with a 1 surviving subgiant companion as modelled by Podsiadlowski. Follow-up spectroscopic observations are needed to confirm this star as the SN’s surviving companion.
Subject headings:
circumstellar matter — ISM: supernova remnants — Magellanic Clouds1. Introduction
While Type Ia supernovae (SNe) are widely known as standardizable candle for cosmological distances, the nature of their progenitor systems is still in debate. Owing to the absence of strong hydrogen lines in their spectra, it has been suggested that their progenitors should be hydrogen-deficient stars. The most plausible candidates for the progenitors are the compact and degenerate stellar remnants of low mass stars known as white dwarfs (WDs). It is believed that Type Ia is the only SN type that results from the thermonuclear disruption of a carbon-oxygen WD. Two main scenarios have been suggested: a single-degenerate (SD) origin in which a WD has accreted matter from a non-degenerate binary companion until its mass reaches the Chandrasekhar limit of 1.4 M☉ (Whelan & Iben, 1973; Nomoto, 1982), and a double-degenerate (DD) origin that requires the merger of two WDs (Iben & Tutukov, 1984; Webbink, 1984).
In the SD scenario, the non-degenerate companion may be a main-sequence (MS) star, a red giant (RG), or a helium star. The close binary interactions between the non-degenerate companion and the WD may result in mass loss and produce a dense circumstellar medium (CSM). The non-degenerate companion can survive the SN explosion and may even be bright enough to be detected (Marietta et al., 2000; Pan et al., 2014). In the DD scenario, no dense CSM or detectable surviving companion is expected. Therefore, if a surviving companion or a dense CSM is detected, the SD origin of a Type Ia SN can be affirmed. While no surviving companions of Type Ia progenitors have been unambiguously identified, a dense CSM has been detected in the Type Ia Kepler SN remnant (SNR) and used to suggest a SD origin (Van den Bergh et al., 1973; Van den Bergh & Kamper, 1977; Dennefeld, 1982; Blair et al., 1991; Williams et al., 2012).
The SNR 0509-68.7, also known as N103B, in the Large Magellanic Cloud (LMC) has been suggested to be an old cousin of the Kepler SNR (Williams et al., 2014). The SNR nature of N103B was first identified by its nonthermal radio emission and later confirmed by its diffuse X-ray emission (Mathewson et al., 1983). As N103B is projected near the ionized superbubble around the cluster NGC 1850, it has been suggested to be associated with a core-collapse SN (Chu & Kennicutt, 1988). However, the X-ray spectra of N103B show SN ejecta abundances consistent with those of Type Ia SNe (Hughes et al., 1995); furthermore, optical spectra of the light echo of N103B’s SN exhibit Type Ia spectral characteristics, i.e., lacking hydrogen lines (Rest et al., 2005, 2016). It is now well recognized that N103B is a Type Ia SNR.
N103B has been included in our study of Type Ia SNRs in the LMC. We have obtained Hubble Space Telescope (HST) H (F656N) images to study the physical structure of the SNR, as well as (F475W, F555W, and F814W) images to search for surviving companions of the SN progenitors and to study the underlying stellar population. We have also obtained high-dispersion echelle spectra of N103B to use its kinematic properties to differentiate between the CSM and interstellar medium (ISM) and to diagnose SNR shocks. This paper reports our analysis of the physical structure of the SNR N103B and search for a surviving companion of its SN progenitor.
The paper is organized as follows. Section 2 describes observations used in this study, Section 3 examines the environment and morphology of N103B, Section 4 presents a quantitative analysis of surface brightnesses and densities of nebular knots in the SNR interior, and Section 5 uses detailed kinematic properties to differentiate between the SNR and background gas components. Section 6 discusses the structure and formation of the N103B SNR, a possible candidate for surviving companion, and a comparison with the Kepler SNR. Finally, a summary is given in Section 7.
2. Observations
2.1. HST Observations
The HST H images of N103B were obtained in Program 13282 (PI: Chu) on 2013 July 11, using the UVIS channel of Wide Field Camera 3 (WFC3) and the F656N filter. The 162′′162′′ field of view is large enough to cover not only the entire N103B SNR but also part of the nearby superbubble around the NGC1850 cluster. The pixel size, 004, corresponds to 0.01 pc in the LMC (at 50 kpc distance).
The H imaging observations were dithered with the WFC3-UVIS-GAP-LINE pattern for 3 points and point spacings of 2414. The total exposure time for each position in N103B was 1350 s. All exposures used the FLASH=11 option to make sure a background of roughly 10-12 e- was present to compensate for charge transfer efficiency (CTE) issues in WFC3.
Using the HST we have also obtained F475W , F555W and F814W band images of N103B to study it’s underlying stellar population. The UVIS channel of WFC3 was used for continuum-band images. All continuum-band observations have a 162′′162′′ field of view as F656N observation. The F475W and F814W observations each had a total exposure time of 1050 s. The F555W observation had a total exposure time of 1117 s. The FLASH=5 option was used for the F475W observation, and the FLASH=4 option was used for the F814W observation to mitigate the CTE issues in WFC3.
We used DOLPHOT, a version of HSTPHOT with HST-specific modules (Dolphin, 2000), to carry out point-spread-function photometry on each of the HST images. The photometric parameters were selected following the recommendations of Williams et al. (2014). The catalog of detected objects was filtered to include only well-measured stars using the criteria of signal-to-noise ratio 5, , and , as recommended by Williams et al. (2014). Definitions of these parameters can be found in Dolphin (2000). These photometric measurements were used to construct color-magnitude diagrams (CMDs) in order to study the stellar population.
2.2. CTIO Observations
2.2.1 Imaging
The Cerro Tololo Inter-American Observatory (CTIO) Blanco 4m H image of N103B was taken from the Magellanic Cloud Emission-Line Survey 2 (MCELS2), which used the MOSAIC II camera and covered the entire LMC. The MOSAIC II camera consists of eight SITe 40962048 CCDs with a pixel size of 027 pixel-1 and a total field-of-view 36′36′. For MCELS2, each field was imaged with 1 and 10 s short exposures and 3300 s long exposures dithered to compensate the gaps between CCDs. The SuperMACHO pipeline software was used for bias subtraction, flat fielding, and distortion correction. The MCELS2 survey was made in the H line only, as opposed to multiple lines and continuum bands for MCELS1 (Smith and MCELS team 1999).
2.2.2 Long-Slit Echelle Spectroscopic Observations
High-dispersion, long-slit spectra of N103B were obtained with the echelle spectrograph on the CTIO Blanco 4m telescope on 1995 January 19. A 79 line mm-1 echelle grating was used. A post-slit H filter ( 6563 Å and 75 Å) was inserted and the cross-disperser was replaced by a flat mirror to isolate a single order and to allow a maximum (4′) slit coverage. The H filter was wide enough to transmit both the H and the neighboring [N II] 6548, 6583 lines. The long-focus red camera and a Tek 2048 2048 CCD were used to record data. The pixel size was 24 m, corresponding to 0.082 Å pixel-1 (3.75 km s-1 pixel-1) along the direction of dispersion and 0267 pixel-1 perpendicular to the dispersion. A 250 m (165) slit width was used, resulting in an instrumental FWHM of about 14 km s-1.
Two slit positions were observed, along position angles 0° and 44°, respectively. The slit was long enough to cover not only the entire SNR N103B but also part of the nearby superbubble around the NGC1850 cluster. The journal of echelle observations is given in Table 1.
| RA | Dec | Date | Position Angle | Exposure |
|---|---|---|---|---|
| (degree) | (s) | |||
| 5:09:11.96 | -68:47:14.60 | 1995 Jan 19 | 44 | 600 |
| 5:09:12.26 | -68:47:14.60 | 1995 Jan 19 | 44 | 600 |
| 5:08:58.94 | -68:43:36.20 | 1995 Jan 19 | 0 | 300 |
| 5:08:59.05 | -68:43:38.80 | 1995 Jan 19 | 0 | 1200 |
| 5:08:58.93 | -68:43:37.50 | 1995 Jan 19 | 0 | 1200 |
Note. — Position angles were measured counterclockwise from the north.
The data were bias subtracted and flat-field corrected at the telescope, and later processed using the IRAF software for cosmic ray rejection, geometric distortion correction, and wavelength calibration. The solutions for geometric distortion and wavelength calibration were derived from Th-Ar lamp observations. Finally, the telluric H emission in each frame was used as reference to fine-tune the absolute wavelength calibration. Heliocentric velocities are used in this paper.
2.2.3 Multi-Order Echelle Spectroscopic Observations
High-dispersion multi-order echelle observations of N103B were obtained with the CHIRON spectrometer (Tokovinin et al., 2013) on the SMARTS 1.5 m telescope at CTIO on 2015 February 11. Chiron is fed by a fiber with a 2.7 arcsec diameter on the sky. Only the brightest group of nebular knots in N103B was observed. Three 15 min exposures were made with the fiber centered on these bright nebular knots. The sky background was observed for 15 min with the fiber centered at about 11 arcsec west of the nebular knots.
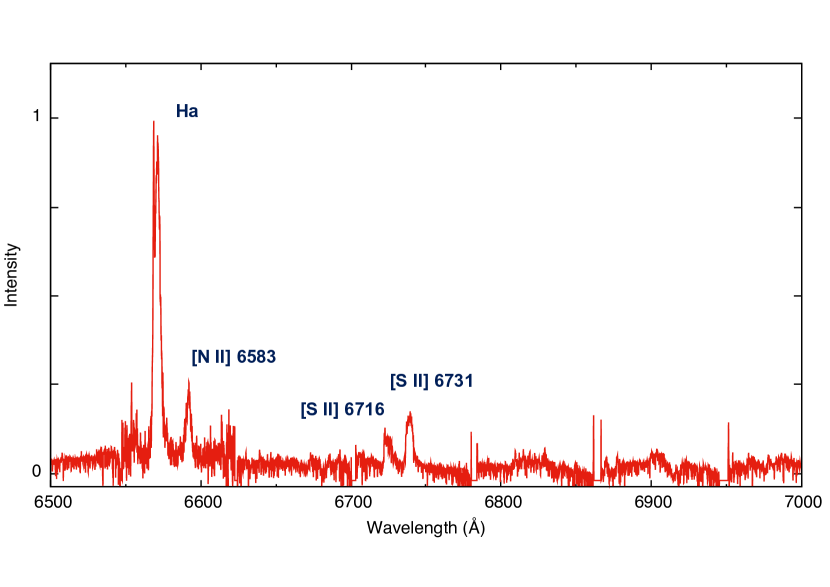
The multi-order spectrum of the nebular knot, extracted with sky subtraction, covers a wavelength range of 4500 – 8900 Å. Nebular emission lines detected include H, [N II]6583, [S II]6716, 6731, [O I]6300, 6364, [O II]7318, and [O III]4595, 5007. The H line is detected with a low S/N.
3. Environment and Morphology of N103B
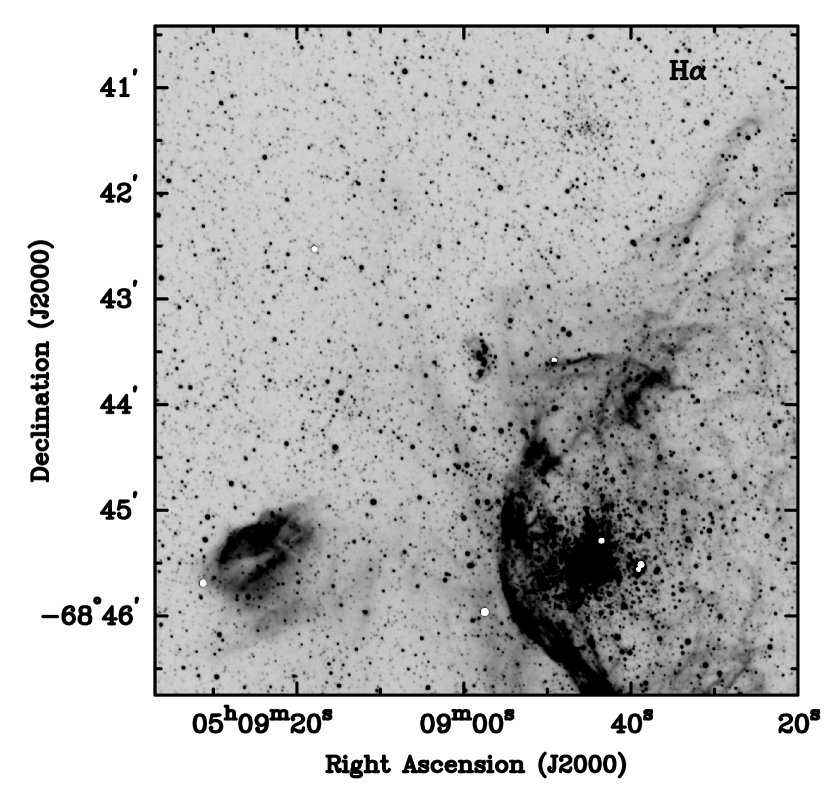
N103B is superposed on diffuse H emission in the outskirt of the superbubble around NGC 1850, as shown in the left panel of Figure 1. In the H-emitting nebula catalog of Henize (1956), the bright eastern rim of the superbubble was designated as nebula N103B, while the small H II region to the east of the superbubble was designated as nebula N103A. In this naming scheme, “N103B” would be a misnomer for the SNR, as the SNR is just a small part of the nebula N103B. For brevity, we will continue using the name “N103B” for the SNR in this paper, although its proper name should be SNR B0509-68.7 or J050854-684447.
N103B is projected at 40 pc from the rich cluster NGC 1850. The superbubble around NGC 1850 appears to show a breakout structure at the rim closest to N103B. Exterior to the superbubble, H emission shows a complex structure with various streamer-like features superposed on a diffuse component. N103B is projected between two streamer-like features. As N103B is closer to the western feature, the diffuse H background is the strongest to the southwest and west of the SNR, and fades away on the east side of the SNR.
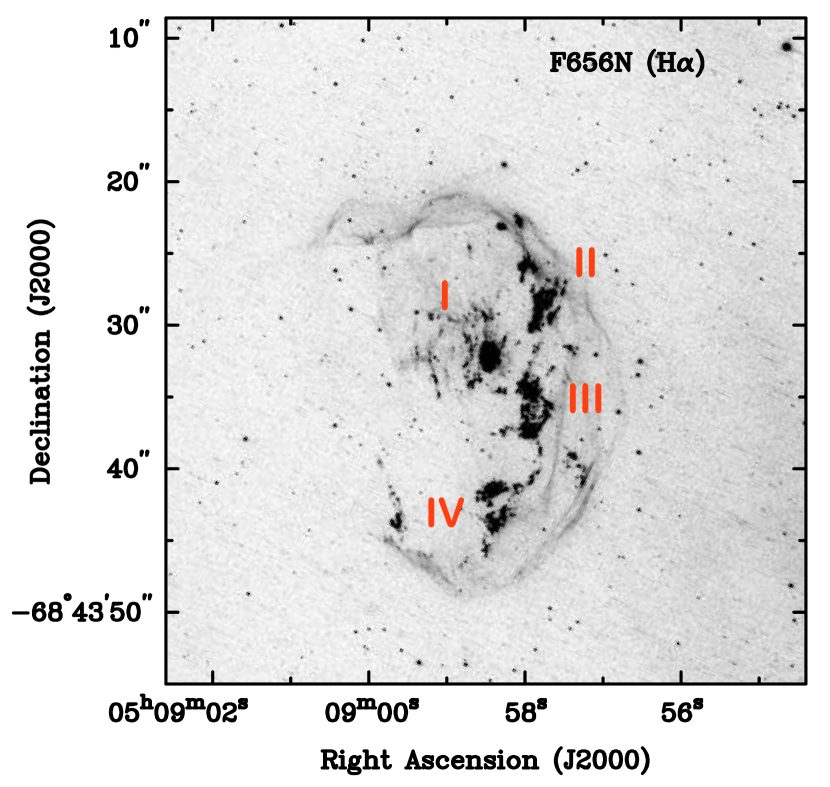
In deep ground-based H images, the SNR N103B appears like the letter “C” opening toward the east where no detectable H emission exists but radio and X-ray emissions extend further by 15″ (Lewis et al., 2003) , as seen in Figure 2. The HST H image resolves N103B into an elliptical shell delineated by fine filaments with an opening to the east and prominent groups of nebular knots in the shell interior, as shown in the right panel of Figure 1.
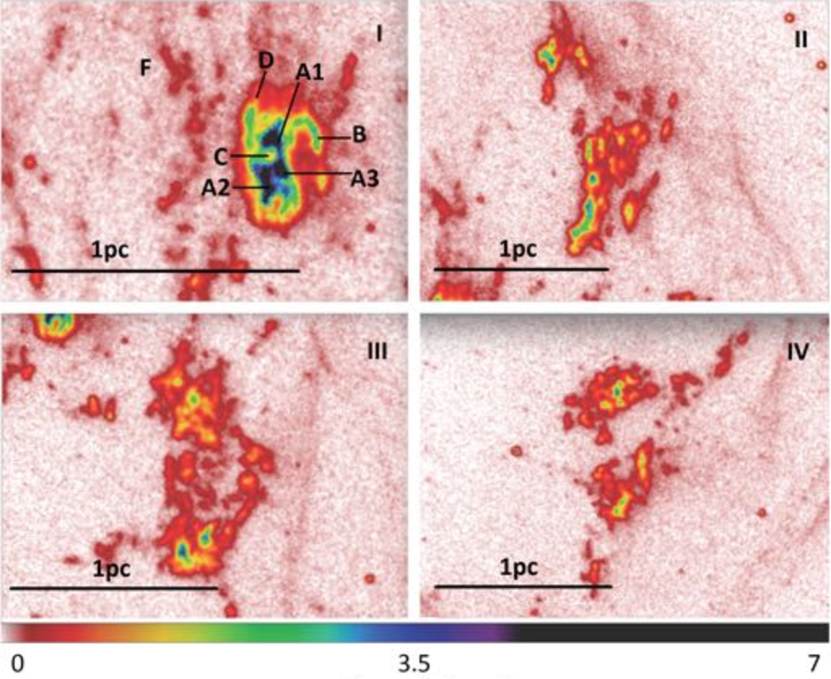
Four major groups of nebular knots exist in the shell interior, all located in the western half of the shell. Among these four, Group I is the most prominent and the closest to the shell center, only offset by 3′′ NW. Its complex internal structure consists of both knots and arcs. It appears to be connected with strings of fainter knots and structured diffuse emission that extend to the eastern side of the shell center. Groups II–IV, located to the west of Group I, all show multiple concentrations of knots; furthermore, they appear to be connected with a curved string of knots. Close-up H images of these four group of knots are shown in Figure 3. In addition to these four major groups of knots, a network of faint filaments extends from the shell center to 6′′ north, and a small number of knots are projected near the filaments along the shell rim. No prominent nebular knots are seen toward the eastern part of the remnant, except a small U-shaped feature near the southeast rim of the shell. It is particularly curious that the interior of the southeast quadrant appear to be totally devoid of nebular knots.
4. Surface Brightness and Densities of Nebular Knots
The HST H image can be used to determine surface brightness and rms density of nebular features, if their emitting path lengths can be reasonably assumed. We use the complex features in Group I to illustrate our analyses. The overall structure of Group I may be described as small dense knots embedded in a broader diffuse gas component (see Figure 3). We select the three brightest knots, designated as A1–A3, and assume that their emitting path lengths are similar to their diameters. The northwest arc is designated as B, and the width and length of the arc have been adopted as the emitting path lengths to assess a possible range of electron densities. The central region not covered by bright knots is still very bright, and we designate it as C and adopt the spatial extent of its isophote as the emitting path length. The diffuse knots in the immediate outskirts of Group I are designated as D, and their emitting path lengths are assumed to be the same as the diameters of the knots. The faint diffuse filaments to the east of Group I are designated as F, and the width and length of each filament are adopted as emitting path lengths to derive the upper and lower limits of its rms density.
| ID | Position | Surface Brightness | ne | Mass | |
|---|---|---|---|---|---|
| (10-13 erg cm-2 s-1 arcsec-2) | (cm | (10-3M☉) | |||
| ISM1 | 30′′SE | 0.02 | |||
| ISM2 | 30′′NE | 0.02 | |||
| ISM3 | 30′′NW | 0.03 | |||
| ISM4 | 30′′SW | 0.04 | |||
| Group I | |||||
| A1 | 6.9 | 2250 200 | 2.2 0.2 | ||
| A2 | 6.5 | 2000 600 | 3.9 1.2 | ||
| A3 | 6.5 | 2150 250 | 2.2 0.3 | ||
| B | 1.3–2 | 600–1000 | 240 | ||
| C | 4.6 | 750–1000 | |||
| D | 0.3 | 300–400 | |||
| F | 0.1–0.5 | 250–500 | 100 | ||
| Group II | |||||
| Knots | 0.6–1.7 | 600–900 | 200 | ||
| Group III | |||||
| Knots | 0.4–1.5 | 500–1000 | 240 | ||
| Group IV | |||||
| Knots | 0.5–1.5 | 600–900 | 130 |
The H surface brightness (SB) of a 104 K ionized gas region can be expressed as
| (1) |
where is rms electron density and is the emitting path length along the line of sight. We assume that the structure of Group I can be described as dense knots in a diffuse gas region; thus, the emission from the knots and arc features is superposed on a “local background” component emitted by the diffuse gas. We have measured the background-subtracted surface brightnesses of the knots and arc features, converted them to emission measures (EM ), and listed them in Table 2. The C feature is between knots, so it represents emission from the diffuse gas component, and the surface brightness of the regions surrounding Group I is used as background and subtracted from that of the C feature. Note that the global background due to the ionized gas associated with the superbubble of NGC 1850 has been measured in four locations at 30′′ from the center of the H shell, denoted as ISM1-4 in Table 2; this global background has been interpolated and subtracted from all measurements. The rms densities of the features, derived using the emitting path lengths described above, are also given in Table 2.
Inside the brightest concentration of knots (Group I), the brightest emission comes from the A1–A3 knots with surface brightness up to 6.910-13 erg cm-2 s-1 arcsec-2. The densities derived for these knots are high, 2000 600 cm-3. The diffuse component near the center of Group I, feature C, has 750–1000 cm-3. The knots outside the main body of Group I, feature D, has 300–400 cm-3. The knots in Groups II–IV all have in the range of 500–1000 cm-3. The faint filaments to the east of Group I have the lowest , 250–500 cm-3. Such high densities and nebular morphology are more consistent with a CSM than an ISM (see Table 1.3 of Draine 2011).
Using the high-dispersion spectra obtained with the CHIRON spectrometer on the SMARTS 1.5 m telescope, we have derived an electron density of 5300 cm-3 from the [S II] 6716/6731 ratio of the Group I feature (a blend of the knots and the diffuse component) as shown in Figure 4. Electron densities derived from [S II] doublet are expected to be higher than the rms densities, as forbidden line emission is weighted toward high-density regions. The rms densities of the knots being lower than that derived from the [S II] doublet indicate that the physical sizes of the knots are actually smaller than we assumed, i.e., the filling factor is smaller than 1.
We may conclude that the nebular knots in N103B have densities ranging from 500 to 5000 H-atom cm-3. The diffuse gas surrounding the knots has rms densities ranging from a few hundred to 1000 H-atom cm-3. Using the rms densities and the approximate sizes of the features, we can estimate the gas mass in each feature. These masses are given in the last column of Table 2. The total mass of the ionized gas is 1 .
The recombination timescale for an ionized gas is ()-1 7.6104 yr, where is the electron density in units of cm-3 and is the recombination coefficient, 4.1810-13 cm3 s-1 at 104 K (Seaton, 1959; Burgess, 1964; Pengelly, 1964; Hummer & Storey, 1987) . It is interesting to note that the recombination timescales for the nebular knots in N103B are as short as 15 to 150 yr, much shorter than the age of the SNR itself, which is 860 yr derived from the SN light echos (Rest et al., 2005). Such short recombination timescale indicates that the ionization of the knots occurred only recently, and are most likely caused by the passage of shocks. It is conceivable that some dense circumstellar material in the form of nebular knots has already recombined and become invisible. The total mass in the CSM can be much higher than the 1 estimated above.
5. Spatiokinematically Differentiating SNR and Background Components
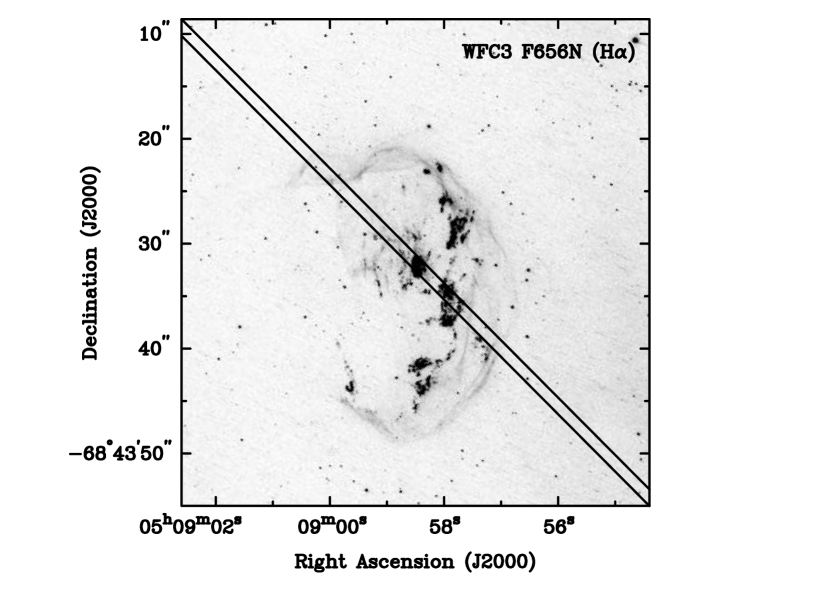
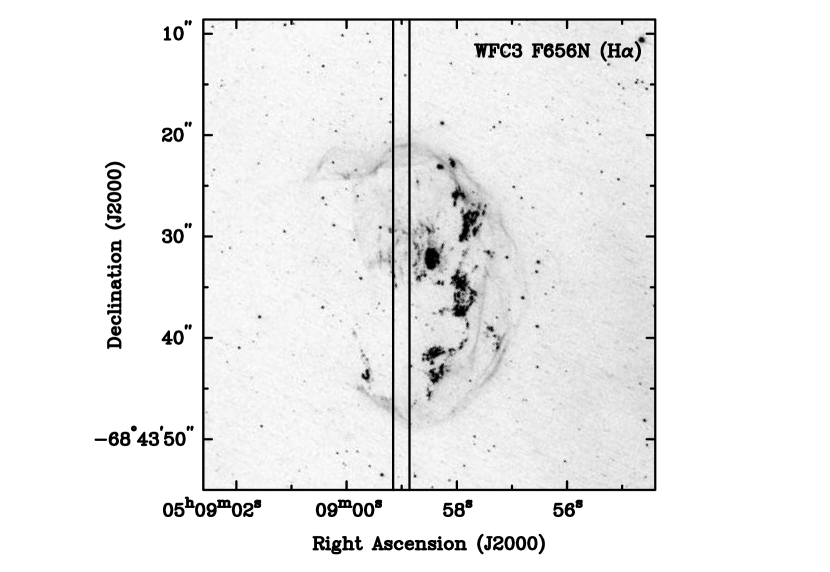
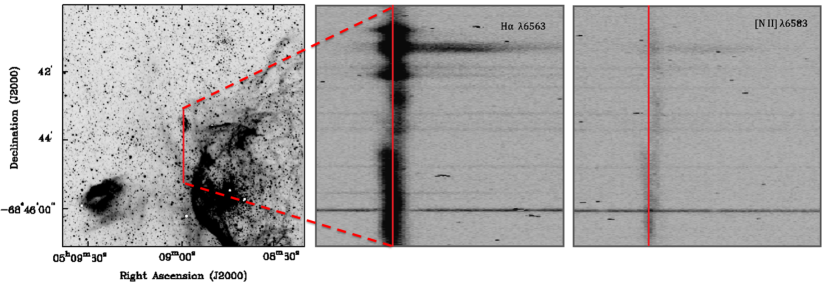
The long-slit high-dispersion echelle observations provide not only kinematic information of ionized gas, but also the [N II]/H ratio information for the different kinematic components. We can compare the long-slit echelle spectral images with the HST H images to make associations between kinematic features in the echelle data and morphological features in the HST H images. Figures 5 and 6 show the H and [N II] 6583 line images alongside an HST H image overlaid with the corresponding slit positions at position angles of 44° and 0°, respectively.
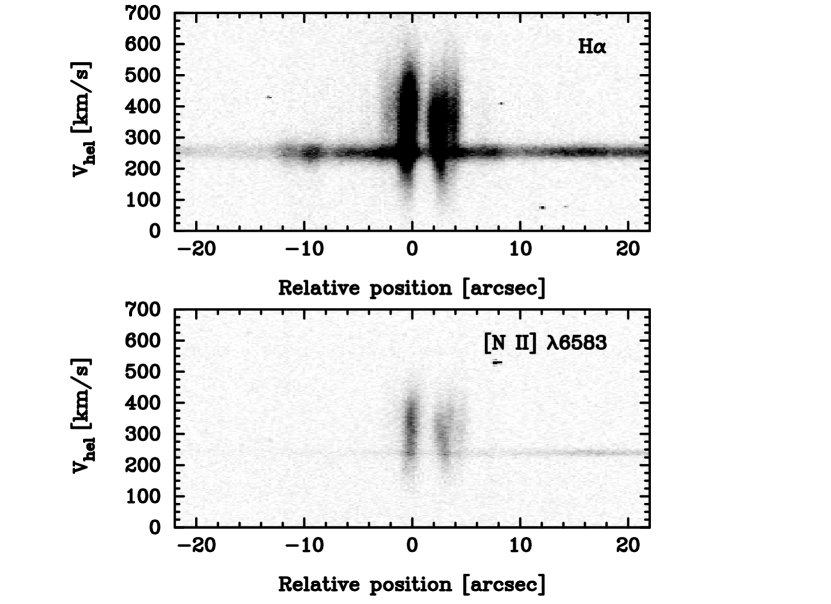
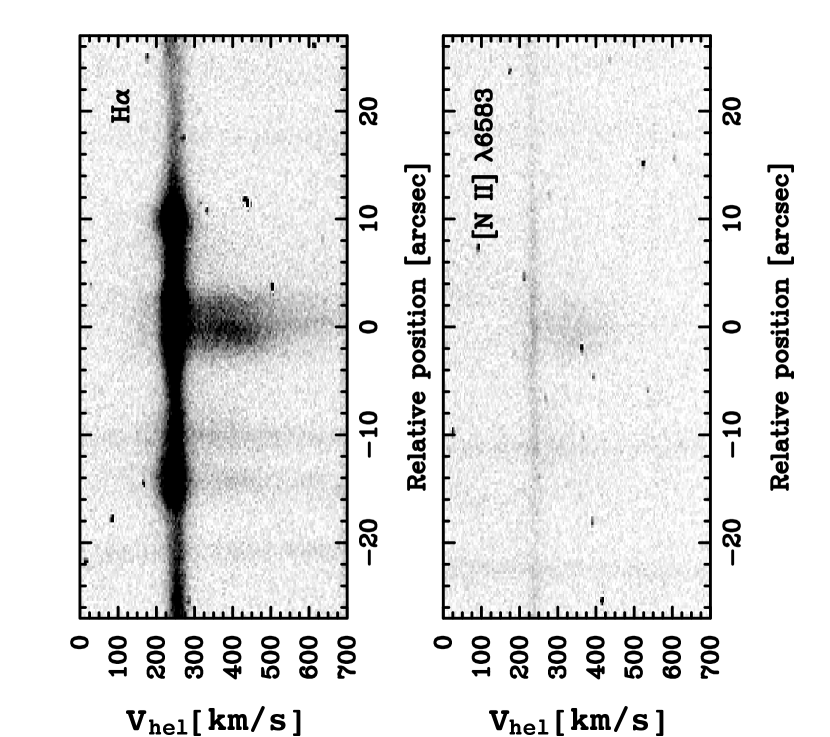
Comparisons between the echelle line images and the H image clearly suggest three distinct gaseous components: background interstellar gas, Balmer-dominated SNR shell, and shocked nebular knots in the SNR interior. A close inspection of echelle line images along the NS slit (Figure 6) shows that the background interstellar gas actually shows an incomplete expanding shell structure that appears to be centered at the SNR. These four components are detailed below.
5.1. Background Interstellar Gas
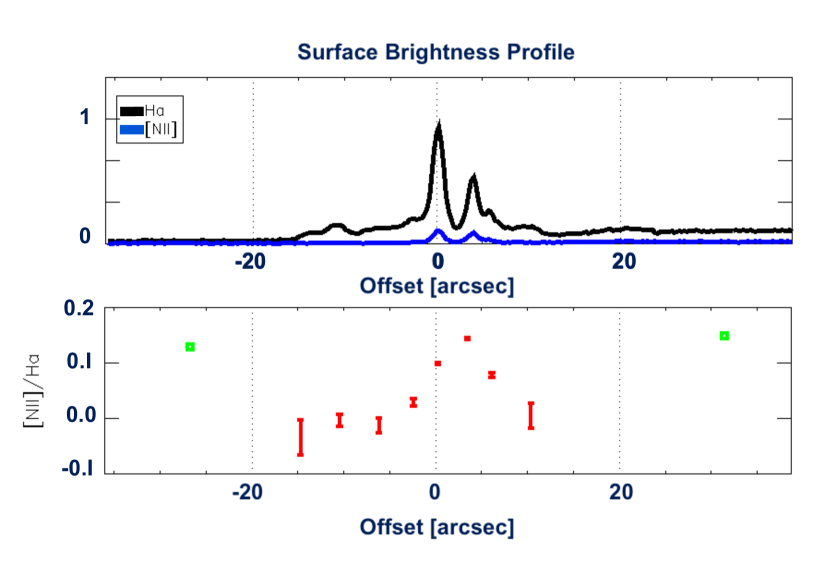
The echelle line images in Figures 5 and 6 show a narrow, nearly constant-velocity H component that is present both inside and outside the SNR boundaries. The narrow velocity profile and the spatial distribution indicate that this ionized gas component has an extended distribution and is not interacting with the SNR N103B. The surface brightness gradient along the slit (Figure 5) is consistent with the large-scale H surface brightness variation shown in Figure 1, brighter toward the superbubble of NGC 1850.
The SNR N103B, however, may not be physically associated with this ionized gas component, as its Balmer-dominated shell (discussed in the next subsection) requires the SNR to be in a mostly neutral ISM (Chevalier et al., 1980). We identify this narrow, nearly constant-velocity H component as the background interstellar gas. The average [N II]/H ratio of this background gas is 0.14 0.01, and the average H velocity profiles have FWHM 30 km s-1.
5.2. Balmer-Dominated SNR Shell
Within the SNR boundary, there exists enhanced H emission at velocities similar to that of the background ionized interstellar gas, but its velocity profiles have broader FWHM, 40 km s-1, and its surface brightness variations correlate well with that of the filamentary elliptical H shell of N103B. Unlike the background interstellar gas, this broad H shell component does not have [N II] counterparts (Figures 5, 6, 7). This is a characteristic of Balmer-dominated Type Ia SNR (Tuohy et al., 1982), and has been reproduced by models of collisionless SNR shocks into a mostly neutral medium (Chevalier et al., 1980). A Balmer-dominated component should exhibit a core and very broad wings as shown in low-dispersion spectra (Smith et al., 1991); however, our high-dispersion echelle spectra are not sensitive enough to detect the broad wings. Our intermediate-dispersion spectra of N103B did detect the broad wings, and these will be presented in a future paper.
5.3. Shocked Nebular Knots
The most spectacular kinematic features in the echelle line images are discrete regions of H emission over velocity spreads up to 500 km s-1 (Figure 5). These regions correspond to the nebular knots resolved in the HST H images. These broad H components have [N II] counterparts, although the velocity spreads of the [N II] line appear smaller due to their lower signal-to-noise ratios. The [N II]/H ratios of these broad components are up to 0.18.
It is remarkable that most of the shocked material in the nebular knots are red-shifted with respect to the background or the Balmer shell component. The distribution of the CSM is clearly not spherically symmetric; it is one-sided along the line-of-sight, as well as along the east-west direction.
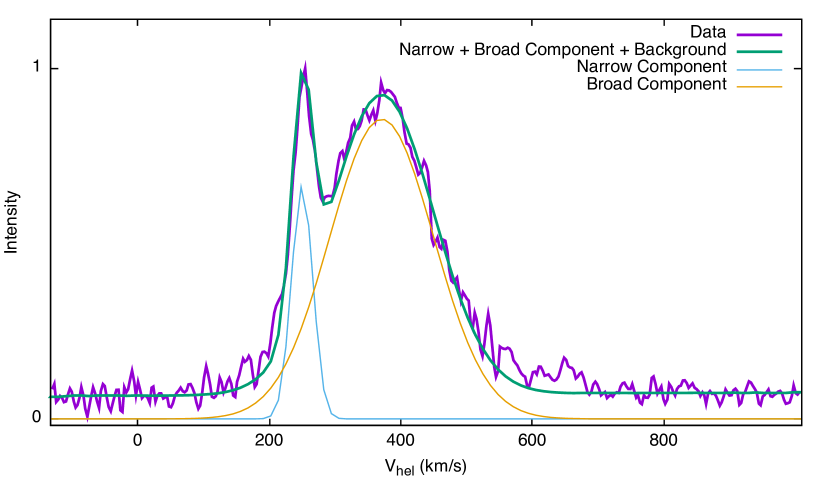
To illustrate the asymmetric distribution of the CSM, we display in Figure 8 the high-dispersion CHIRON spectrum at the H line of the bright nebular knots in Group I. This H line profile can be fitted with two Gaussian components, a narrow one centered near V km s-1 with FWHM 40 km s-1 and a broad one centered near V km s-1 with FWHM 190 km s-1. The two Gaussian components are also plotted in Figure 8. It can be seen that the broad Gaussian component can describe the bulk of shocked gas but not near the highest velocities, as there is still emission near V km s-1.
5.4. Large Incomplete Interstellar Shell
The [N II] 6583 line, due to nitrogen’s larger atomic weight, has a smaller thermal width than the H line, and thus reveals slowly expanding structures more clearly. Figure 9 shows a stretched echelle image of the [N II] line along the NS slit. It can be seen that the small velocity variations in the interstellar component follow a curve that is characteristic for an expanding shell. While the receding side of the shell is regular and complete, the approaching side is incomplete by more than 50% of the spatial extent. The expansion velocity of this shell is 10 km s-1. This incomplete shell structure is reminiscent of the incomplete filamentary elliptical shell of N103B, and the preferential existence of red-shifted material is similar to what is observed in the shocked nebular knots. However, a comparison of its spatial extent and the features in H image shows that this expanding shell structure is bounded by two curved filaments extending outwards from the superbubble around NGC 1850. Therefore, this expanding shell is likely a blister on the rim of the superbubble, and its large size precludes its physical association with the SNR N103B.
6. Discussion
6.1. Structure and Formation of the SNR N103B
To formulate a feasible model for the structure and formation of the SNR N103B, we need to explain the following observed features: (1) the apparently elliptical Balmer-dominated shell, (2) dense knots projected within the Balmer shell interior, and (3) the eastern extension of diffuse X-ray and radio emission that does not have optical counterparts.
The presence of the Balmer-dominated shell is indicative of collisionless shocks in a mostly neutral ISM (Chevalier et al., 1980). N103B’s Balmer shell thus suggests that the SNR is not in the ionized ISM surrounding NGC 1850’s superbubble. However, the Balmer line emission peaks at velocities that are similar to those of the background ionized gas, suggesting that the medium surrounding N103B and the ionized superbubble of NGC 1850 are likely associated with the same interstellar complex.
The Balmer filaments represent the shock fronts and their curvatures can be used to assess the SN explosion centre. As the projection of a sphere is always a sphere, the apparently elliptical shape of the Balmer shell indicates that the shock fronts have run into a non-uniform medium and are no longer spherically symmetric. The elliptical shape can be produced by the projection of an elliptical shell or a tilted round torus (or short cylinder). As the Balmer shell is open to the east, it is unlikely that the Balmer shell is a uniform elliptical shell. Instead, it is more likely that the Balmer “shell” is actually a torus or a short cylinder with the eastern section missing. The projection of a short cylinder appears elliptical and the center of the cylinder is projected at the center of the ellipse. Therefore, we identify the geometric center of the Balmer shell as the site of SN explosion in N103B.
The dense knots seen in the interior of the SNR shell consist of CSM (Williams et al., 2014) that has been impacted by the SNR shocks. The distribution of the knots shows clearly that the circumstellar material is not spherically symmetric; furthermore, the CSM appears to be distributed in a plane. This geometry is similar to that expected from the model of Hachisu et al. (2008) for Type Ia SNe. In this model, a WD accretes mass from a main sequence companion, and generates a fast wind that evacuates material in the polar directions and strips the surface material of the companion into a torus in the orbital plane. This model naturally explains the distribution of the CSM in N103B.
The CSM is missing towards the east, and the preferentially redshifted velocities of the shocked dense knots indicate a lack of CSM in the direction towards us as well. This highly asymmetric distribution of CSM can be caused by a large proper motion of a mass-losing system through the ISM, such as a fast-moving Asymptotic Giant Branch (AGB) star (Villaver et al., 2012). As described above, the Balmer shell opens to the east with no H emission, but X-ray and radio emission extends much further east. This asymmetric distribution of the mostly neutral ISM can also be naturally explained by the proper motion of the progenitor binary system. In fact, the radio morphology of N103B is reminiscent of the H image of the planetary nebula Sh 2-188, whose morphology has been explained by the nebula’s high-velocity motion through the ISM (Wareing et al., 2007).
We propose that the progenitor of N103B’s Type Ia SN has a normal star companion, and the binary system has a proper motion through the ISM. The WD’s powerful wind strips the companion’s envelope to form a circumstellar torus that is compressed to higher densities in the direction of proper motion. The compressed CSM breaks up and forms knots due to Rayleigh-Taylor instabilities, while the CSM in the trailing side has low densities and is thus undetected.
6.2. Search for Surviving Companion
The surviving companion of N103B’s SN progenitor, if exists, should be at a finite distance from the explosion center, and the distance depends on its kick velocity at the explosion. In a previous surviving companion search, Pagnotta & Schaefer (2015) adopted the average geometric center N103B’s images in radio (Dickel & Milne, 1995) and X-ray (Lewis et al., 2003) wavelengths, although these images show very uneven surface brightnesses, with the eastern half much fainter than the western half. They found 8 stars within 4′′ from this explosion center; however, an unambiguous identification of the surviving companion still awaits spectroscopic data demonstrating anomalous chemical abundance or kinematic properties, such as high velocity or fast rotation.
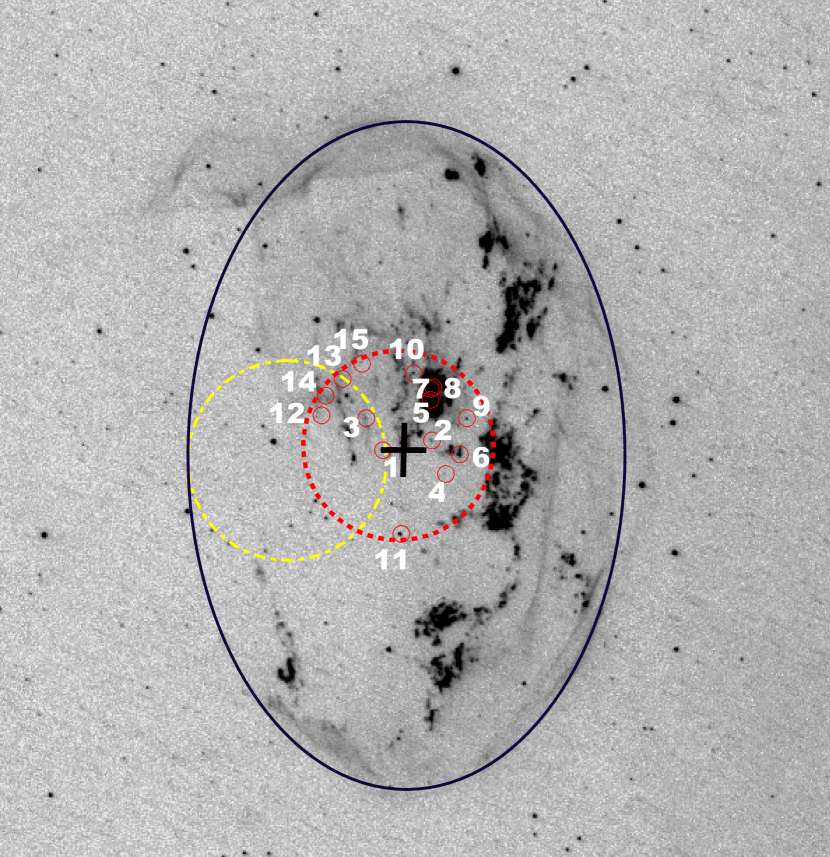
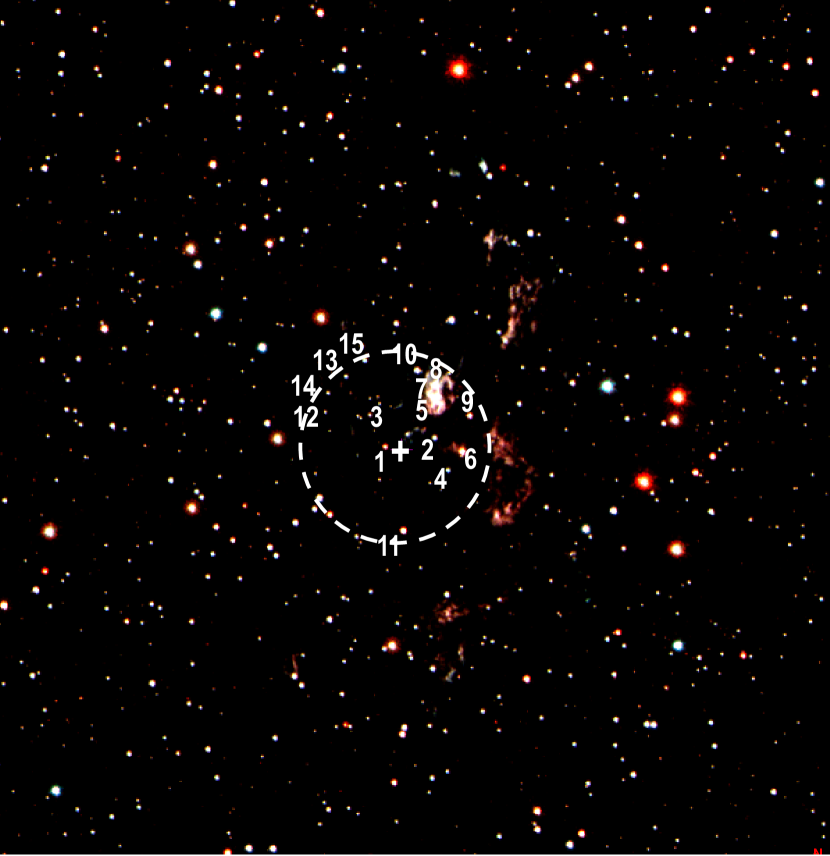
Our analysis of the physical structure of N103B, taking into account both the CSM and ISM, concludes a different explosion center. In our study, the Balmer-dominated filamentary shell in the HST H image is used to determine the site of SN explosion. The Balmer-dominated shell is visually fitted by an ellipse with a dimension of 28″ 18″ and a center at 05h08m58.8s, 68∘43′347 (J2000) (see left panel in Figure 10). The apparent ellipticity can be reproduced by a short round cylinder inclined by 50∘ against the sky plane.
Adopting the center of the Balmer-dominated elliptical shell as the explosion center, we have compiled all stars with 22.7 within 4′′ from the center. Adopting the age 860 yr derived from the SN light echos (Rest et al., 2005), these limits correspond to a F8V – G0V star and a kick velocity of (1 pc) / (860 yr) 1140 km s-1, respectively. These stars are listed in Table 3 in order of increasing distance from the explosion center.
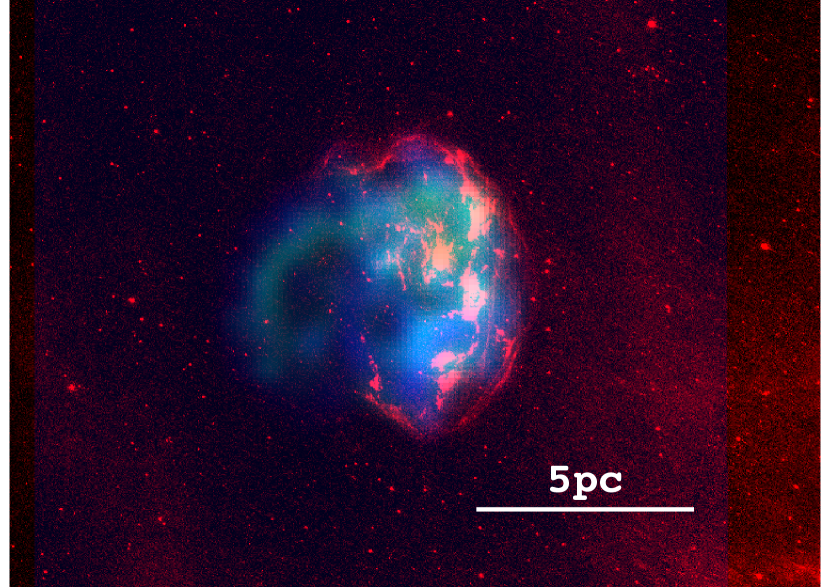
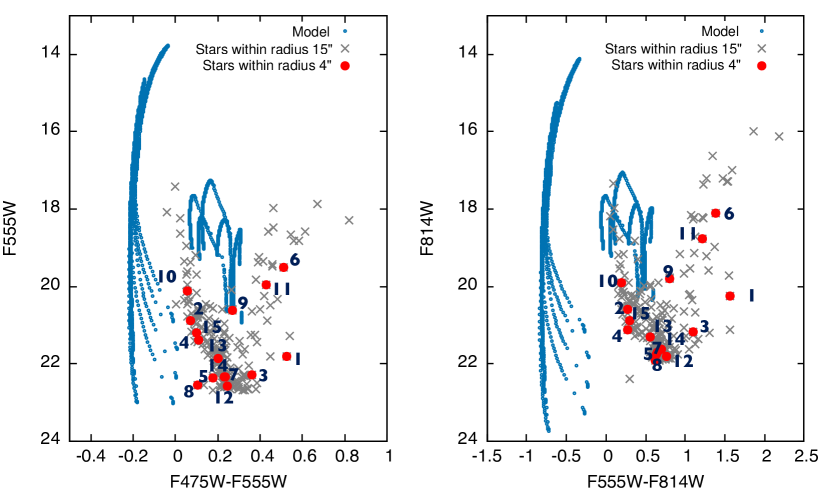
To identify candidates for surviving companion of N103B’s SN progenitor, we have plotted in Figure 11 all stars with within 15′′ from the explosion center in the versus and versus CMDs, with the stars within 4′′ from the center marked and numbered in the CMDs as well as in the H and color composite images in Figure 10. We have also overplotted the post-impact evolutionary tracks of surviving companions for cases of He stars and main sequence stars (Pan et al., 2014).
It can be seen that within 4′′ from the explosion center, no stars match the expectation of models of Pan et al. (2014). Only star 9 is close to the base of the tracks for MS companions in the versus CMD, but not in the versus CMD; furthermore, star 9 is 3′′ from the explosion center and it would need a very high kick velocity, 850 km s-1, which is unlikely.
In the SD scenario for Type Ia SNe, the companions may be MS stars, RGs, or He stars. Pan et al. (2014) modelled post-impact evolution of MS and He companions, but not RG companions. Podsiadlowski (2003), on the other hand, considered a 1 subgiant companion which had been stripped of 0.2–0.8 envelope mass and heated by the impact of SN ejecta, and found that the surviving companion would be a 5,000 K subgiant with 1–100 . Interestingly, the star closest to the explosion center, star 1, appears to have temperature and luminosity consistent with this prediction. Assuming negligible extinction, star 1’s 0.53 suggests a spectral type of late F to early G type, and its 1.56 suggests a spectral type of late K type; in the band, star 1 is 4 times brighter than the Sun, while in the band star 1 is 9 times as bright as the Sun. The mass of the CSM in N103B, as determined in Section 4, is 1 , of similar order of magnitude as that of stripped envelope of a subgiant or a giant. Furthermore, as shown in Figure 11, the location of star 1 in the CMDs is not well populated by LMC or Galactic stars, implying a less likelihood to be a popular background star. Thus, we suggest that star 1 is the most likely candidate for the surviving companion of the SN progenitor of N103B. Physical properties of post-impact companion stars have been modelled, as shown in Table 4 (Pan et al., 2013). Spectroscopic observations of star 1 in N103B should be made to search for high radial velocity and/or fast rotation to confirm or reject its identification as a surviving companion of the SN progenitor.
| Star | RA (J2000) | Dec. (J2000) | B | V | I | B-V | V-I | |
|---|---|---|---|---|---|---|---|---|
| 1 | 05:08:58.95 | -68:43:34.7 | 22.33 0.01 | 21.81 0.01 | 20.24 0.01 | 0.53 0.01 | 1.56 0.01 | 08 |
| 2 | 05:08:58.56 | -68:43:34.3 | 20.95 0.00 | 20.87 0.00 | 20.59 0.01 | 0.07 0.01 | 0.28 0.01 | 13 |
| 3 | 05:08:59.06 | -68:43:33.3 | 22.64 0.01 | 22.28 0.01 | 21.18 0.01 | 0.36 0.02 | 1.10 0.01 | 20 |
| 4 | 05:08:58.46 | -68:43:35.8 | 21.51 0.01 | 21.40 0.01 | 21.12 0.01 | 0.11 0.01 | 0.28 0.01 | 22 |
| 5 | 05:08:58.57 | -68:43:32.6 | 22.55 0.01 | 22.38 0.01 | 21.75 0.02 | 0.18 0.02 | 0.63 0.07 | 24 |
| 6 | 05:08:58.33 | -68:43:35.0 | 20.01 0.00 | 19.50 0.00 | 18.12 0.00 | 0.51 0.00 | 1.38 0.00 | 25 |
| 7 | 05:08:58.56 | -68:43:32.2 | 22.58 0.01 | 22.34 0.01 | 21.70 0.02 | 0.24 0.02 | 0.64 0.02 | 29 |
| 8 | 05:08:58.54 | -68:43:32.1 | 22.66 0.01 | 22.56 0.01 | 21.97 0.02 | 0.11 0.02 | 0.63 0.02 | 29 |
| 9 | 05:08:58.27 | -68:43:33.4 | 20.89 0.00 | 20.61 0.00 | 19.81 0.00 | 0.27 0.01 | 0.80 0.00 | 30 |
| 10 | 05:08:58.69 | -68:43:31.6 | 20.16 0.00 | 20.11 0.00 | 19.91 0.00 | 0.05 0.00 | 0.20 0.01 | 32 |
| 11 | 05:08:58.80 | -68:43:38.4 | 20.40 0.00 | 19.97 0.00 | 18.76 0.00 | 0.43 0.00 | 1.21 0.00 | 36 |
| 12 | 05:08:59.40 | -68:43:33.3 | 22.82 0.01 | 22.58 0.01 | 21.82 0.01 | 0.24 0.01 | 0.76 0.02 | 36 |
| 13 | 05:08:59.24 | -68:43:31.8 | 22.07 0.01 | 21.87 0.01 | 21.31 0.01 | 0.20 0.01 | 0.55 0.01 | 38 |
| 14 | 05:08:59.38 | -68:43:32.5 | 22.56 0.01 | 22.33 0.01 | 21.63 0.01 | 0.23 0.01 | 0.71 0.01 | 39 |
| 15 | 05:08:59.10 | -68:43:31.1 | 21.29 0.01 | 21.19 0.01 | 20.89 0.01 | 0.10 0.01 | 0.30 0.01 | 40 |
| He-Star | MS-Star | Giant-Star | |
|---|---|---|---|
| Linear velocity (km s-1) | 500 - 1000 | 100 - 200 | < 100 |
| Rotational speed (km s-1) | > 50 - 200 | < 100 | very low |
| Color | Very blue | ||
| Effective Temperature (K) | 10,000 - 100,000 | 5,000 - 10,000 | ? |
| Stripped Mass (M☉) | < 0.1 | 0.1 - 0.4 | 0.5 - 1.0 |
References. — Pan et al. (2013)
6.3. Comparison with Kepler’s SNR
Kepler’s SNR, in the Milky Way at a distance 5 kpc, resulted from the SN discovered by Johannes Kepler in 1604. Optical images of Kepler’s SNR display a complex network of knots and filaments within a radius of 100″. Although the type of Kepler’s SN was debated at first, X-ray, optical, and IR observations of the SNR have pointed toward a Type Ia origin (Blair et al., 2007; Reynolds et al., 2007), and demonstrated the existence of a dense CSM from the progenitor system (Van den Bergh et al., 1973; Van den Bergh & Kamper, 1977; Dennefeld, 1982; Blair et al., 1991).
N103B and Kepler’s SNR share many similar properties. In X-rays, both SNRs show prominent Si, S, Ar, Ca, and Fe K emission and a notable absence of O in the spectra of their SN ejecta, as expected for Type Ia SNe (Hughes et al., 1995; Reynolds et al., 2007). In nebular lines at optical wavelengths, both SNRs show similar knots-and-filaments morphological characteristics: both have Balmer-dominated filaments delineating the outer boundary of the SNR but only along 1/3 to 1/2 of the periphery, and both exhibit dense knots distributed within the SNR shell as well as close to the Balmer filaments (Sankrit et al., 2008). The dense knots in Kepler’s SNR have electron densities of 2,000–10,000 cm-3 (Blair et al., 1991), and those in N103B 5,300 cm-3. The dense knots in Kepler’s SNR have been suggested to be CSM ejected by the SN progenitor system because of the enhanced N abundance implied by the high [N II]/H ratio, 2 (Dennefeld, 1982; Dodorico et al., 1986). The high densities of N103B’s knots have been used to argue for a CSM origin, similar to Kepler’s knots; however, the [N II]/H ratios of the dense knots in N103B are only 0.2, not as high as those of Kepler’s SNR. This factor of 10 difference in [N II]/H ratio cannot be explained completely by the low N abundance in the LMC, 0.16 times that of the Sun or 0.37 times that of the solar neighborhood (Russell & Dopita, 1992). The CSM originates from the envelope of the non-degenerate companion in the SN progenitor system (Hachisu et al., 2008). As the CNO process can build up N abundance and the processed material can be mixed into the envelope through convection, it is possible that the non-degenerate companion of Kepler’s SN progenitor has a higher mass than that for N103B, and Kepler’s CSM contains CNO-processed material.
A search for surviving companion of Kepler’s SN progenitor has been conducted by Kerzendorf et al. (2014) using spectroscopic observations of the 24 brightest stars near the center of Kepler’s SNR. From the radial velocities of these stars, they ruled out a RG companion with high certainty, and found no candidates for a donor star with luminosity 10 , although follow-up astrometric observations for proper motion and high-dispersion spectra for stellar rotation are needed for further search. In this paper, we identify a possible candidate for surviving companion of N103B’s SN progenitor near the explosion center of the SNR. This candidate was likely a solar-mass sub-giant that had no significant CNO cycle burning of H in its interior (Podsiadlowski, 2003). It also needs follow-up spectroscopic observations of radial velocity, rotational velocity, and abundances to verify its association with N103B’s SN progenitor.
7. Summary
N103B is a Type Ia SNR in the LMC. We have obtained HST images of N103B in the H and bands in order to study the physical structure of the SNR and to search for candidates of surviving companion of the SN progenitor. We have also obtained CTIO 4m high-dispersion, long-slit echelle and 1.5m high-dispersion, multi-order echelle observations of the SNR in order to kinematically differentiate between interstellar and circumstellar gas components and to detect SNR shocks.
The SNR N103B is projected against the diffuse ionized interstellar gas in the outskirts of the superbubble around the NGC 1985 cluster. The HST H image shows delicate filaments that form an incomplete elliptical ring, and groups of dense knots interior to the ring. Both the filaments and knots are distributed preferentially on the west side, and exhibit an opening to the east where X-ray and radio emission extends further by .
The H and [N II] lines from the echelle data show that the filaments are dominated by Balmer lines (no forbidden lines) characteristic of collisionless shocks advancing into a mostly neutral ISM, while the knots have electron densities as high as 5300 cm-3 and are shocked CSM. We suggest that the asymmetric distribution of the CSM is caused by a large proper motion of the progenitor binary system toward the west. The mass loss from the progenitor system is compressed by the ISM to higher densities on the leading side, and is dispersed and diluted by the void in the trailing side.
As the Balmer-dominated filaments delineate the SNR shock front into the ISM, they can be used to trace the location of SN explosion. The Balmer-dominated filaments are distributed roughly along an ellipse, and we adopt its center as the site of SN explosion. We have constructed CMDs and compare the locations of stars projected within 4′′ (1 pc) from the explosion center with the post-shock evolutionary tracks of surviving companions calculated by Pan et al. (2012, 2013, 2014). No stars projected near the explosion center are coincident with these tracks. On the other hand, the star closest to the explosion center appears to have the colors and luminosity predicted by Podsiadlowski (2003) for a 1 subgiant companion with 0.2–0.8 of envelope stripped and heated by the SN shock. Future spectroscopic observations of radial velocity and rotational velocity of this star are needed to confirm or reject its identification as N103B SN progenitor’s surviving companion.
References
- Blair et al. (1991) Blair, W. P., Long, K. S., & Vancura, O. 1991, ApJ, 366, 484
- Blair et al. (2007) Blair, W. P., Ghavamian, P., Long, K. S., et al. 2007, ApJ, 662, 998
- Burgess (1964) Burgess, A. 1964, Mem. R.A.S. 69, 1
- Chevalier et al. (1980) Chevalier, R. A., Kirshner, R. P., & Raymond, J. C. 1980, ApJ, 235, 186
- Chu & Kennicutt (1988) Chu, Y.-H., & Kennicutt, R. C., Jr. 1988, AJ, 96, 1874
- Dennefeld (1982) Dennefeld, M. 1982, A&A, 112, 215
- Dickel & Milne (1995) Dickel, J. R., & Milne, D. K. 1995, AJ, 109, 200
- Dodorico et al. (1986) Dodorico, S., Bandiera, R., Danziger, J., & Focardi, P. 1986, AJ, 91, 1382
- Dolphin (2000) Dolphin, A. E. 2000, PASP, 112, 1383
- Draine (2011) Draine, B. T. 2011, Physics of the Interstellar and Intergalactic Medium by Bruce T. Draine. Princeton University Press, 2011. ISBN: 978-0-691-12214-4,
- Hachisu et al. (2008) Hachisu, I., Kato, M., & Nomoto, K. 2008, ApJ, 679, 1390-1404
- Henize (1956) Henize, K. G. 1956, ApJS, 2, 315
- Hughes et al. (1995) Hughes, J. P., Hayashi, I., Helfand, D., et al. 1995, ApJ, 444, L81
- Hummer & Storey (1987) Hummer, D. G., & Storey, P. J. 1987, MNRAS, 224, 801
- Iben & Tutukov (1984) Iben, I., Jr., & Tutukov, A. V. 1984, ApJS, 54, 335
- Kerzendorf et al. (2014) Kerzendorf, W. E., Childress, M., Scharwächter, J., Do, T., & Schmidt, B. P. 2014, ApJ, 782, 27
- Lewis et al. (2003) Lewis, K. T., Burrows, D. N., Hughes, J. P., et al. 2003, ApJ, 582, 770
- Marietta et al. (2000) Marietta, E., Burrows, A., & Fryxell, B. 2000, ApJS, 128, 615
- Mathewson et al. (1983) Mathewson, D. S., Ford, V. L., Dopita, M. A., et al. 1983, ApJS, 51, 345
- Nomoto (1982) Nomoto, K. 1982, ApJ, 257, 780
- Pagnotta & Schaefer (2015) Pagnotta, A., & Schaefer, B. E. 2015, ApJ, 799, 101
- Pan et al. (2012) Pan, K.-C., Ricker, P. M., & Taam, R. E. 2012, ApJ, 760, 21
- Pan et al. (2013) Pan, K.-C., Ricker, P. M., & Taam, R. E. 2013, ApJ, 773, 49
- Pan et al. (2014) Pan, K.-C., Ricker, P. M., & Taam, R. E. 2014, ApJ, 792, 71
- Pengelly (1964) Pengelly, R. M. 1964, MNRAS, 127, 145
- Podsiadlowski (2003) Podsiadlowski, P. 2003, arXiv:astro-ph/0303660
- Reynolds et al. (2007) Reynolds, S. P., Borkowski, K. J., Hwang, U., et al. 2007, ApJ, 668, L135
- Rest et al. (2005) Rest, A., Suntzeff, N. B., Olsen, K., et al. 2005, Nature, 438, 1132
- Rest et al. (2016) Rest, A., et al. 2016, in preparation
- Russell & Dopita (1992) Russell, S. C., & Dopita, M. A. 1992, ApJ, 384, 508
- Sankrit et al. (2008) Sankrit, R., Blair, W. P., Frattare, L. M., et al. 2008, AJ, 135, 538
- Seaton (1959) Seaton, M. J. 1959, MNRAS, 119, 81
- Smith et al. (1991) Smith, R. C., Kirshner, R. P., Blair, W. P., & Winkler, P. F. 1991, ApJ, 375, 652
- Tokovinin et al. (2013) Tokovinin, A., Fischer, D. A., Bonati, M., et al. 2013, PASP, 125, 1336
- Tuohy et al. (1982) Tuohy, I. R., Dopita, M. A., Mathewson, D. S., Long, K. S., & Helfand, D. J. 1982, ApJ, 261, 473
- Van den Bergh et al. (1973) Van den Bergh, S., Marscher, A. P., & Terzian, Y. 1973, ApJS, 26, 19
- Van den Bergh & Kamper (1977) Van den Bergh, S., & Kamper, K. W. 1977, ApJ, 218, 617
- Villaver et al. (2012) Villaver, E., Manchado, A., & García-Segura, G. 2012, ApJ, 748, 94
- Wareing et al. (2007) Wareing, C. J., Zijlstra, A. A., & O’Brien, T. J. 2007, MNRAS, 382, 1233
- Webbink (1984) Webbink, R. F. 1984, ApJ, 277, 355
- Williams et al. (2014) Williams, B. F., Lang, D., Dalcanton, J. J., et al. 2014, ApJS, 215, 9
- Williams et al. (2012) Williams, B. J., Borkowski, K. J., Reynolds, S. P., et al. 2012, ApJ, 755, 3
- Williams et al. (2014) Williams, B. J., Borkowski, K. J., Reynolds, S. P., et al. 2014, ApJ, 790, 139
- Whelan & Iben (1973) Whelan, J., & Iben, I., Jr. 1973, ApJ, 186, 1007