Analysis of Proportional Fair Scheduling
Under Bursty On-Off Traffic
Abstract
Proportional fair scheduling (PFS) has been adopted as a standard solution for fair resource allocation in modern wireless cellular networks. With the emergence of heterogeneous networks with widely varying user loads, it is of great importance to characterize the performance of PFS under bursty traffic, which is the case in most wireless streaming and data transfer services. In this letter, we provide the first analytical solution to the performance of PFS under bursty on-off traffic load. We use the Gaussian approximation model to derive a closed-form expression of the achievable user data rates. In order to further improve the accuracy of our baseline analytical solution for multi-cell networks, we design a hybrid approximation by employing multi-interference analysis. The simulation results verify that our model guarantees extremely low data rate estimation error, which is further insensitive to changes in session duration, traffic load and user density.
Index Terms:
Proportional fair scheduling, bursty on-off traffic, data rate estimation, multi-interference analysis.I Introduction
Opportunistic scheduling provides an effective mechanism to improve transmission performance by exploiting channel fluctuations in multiuser wireless communication networks [1]. Among various scheduling schemes, proportional fair scheduling (PFS) has been widely adopted since it provides an excellent balance between high throughput and user fairness [2]. Thus performance analysis of PFS is important to provide guidelines for its optimization and application. In particular, analytical results can be used for admission control, radio resource management, network planning, and so on [3].
There have been several related works in the literature which focus on the performance analysis of PFS under saturated traffic, where the active user set is static because users always have data to transmit. We can broadly classify the existing approaches into two major groups according to their analytical models of user data rates. The first group is designed for the single-cell network based on either symmetric relative fluctuation of user channels [4] or Gaussian approximation of instantaneous data rates [2]. The second group considers stochastic signal-to-interference-plus-noise ratio (SINR) distribution of each user in multi-cell networks and computes throughput with the conditional probability distribution of the scheduled SINR under PFS. The stochastic SINR model in [5] is carefully designed using multi-interference analysis (MIA) and achieves more accurate estimation of user throughput in multi-cell networks compared to the single-cell analysis.
Compared to the saturated traffic model, the bursty traffic model is more realistic especially for the analysis of dynamic service quality. It is important for modeling the increasing web usage which is becoming dominant in mobile networks nowadays. The packet-level performance has been investigated in [6] by using processor sharing methodology. However, their analytical results are limited to the scenarios where the relative fluctuations of user channels are symmetric. On the other hand, high speed streaming services, such as video on demand (VOD) and video conferencing, have become more popular recently. The wireless transmission of these service types can be modeled as bursty on-off traffic at session level, which has not yet been considered for the performance analysis of PFS. Therefore, in this letter, we present the first analytical solution for the performance of PFS under bursty on-off traffic. We derive a closed-form expression of user data rates based on GA. In order to improve the accuracy of analytical results in multi-cell networks, we then design a hybrid approximation model by carefully combining GA and MIA approaches. We compare the analytical performance of PFS with the results obtained from simulations to verify the accuracy of our models.
II System Model
We consider a downlink network containing multiple base stations (BSs). We denote the BS in the considered cell as and the set of user terminals associated to it as
| (1) |
In each transmitted frame, the BS distributes resource blocks (RBs) to the associated users with PFS [7]. The PFS considered in this paper uses the data rate-based scheduling metric, i.e., the ratio between the instantaneous and long-term averaged user data rate. We assume flat fading channels such that the RBs within the considered bandwidth undergo identical Rayleigh fading. Without loss of generality, we focus on the performance analysis of PFS with one certain RB. Thus, the instantaneous received power of the reference signal (RS) at user from BS is modeled as
| (2) |
where is the RS transmit power of BS , is the channel gain of path loss and shadow fading, and is the normalized Rayleigh fading gain of user from BS which is modeled as a circularly symmetric complex Gaussian random variable with mean value 0 and covariance 1. Thus, is a random variable with the exponential distribution and its mean value is given as
| (3) |
This can be estimated by the detection of RS-received-power (RSRP) which is the average power of the symbols that carry cell-specific RSs [7]. A user reports RSRPs to its serving BS for channel quality detection. Thus, the BSs can make system decisions, such as for resource allocation and inter-cell handover, according to the reported information.
The total instantaneous received RS power of user is
| (4) |
where is the interfering BS set of user , including independent inter-cell interferers, and is the noise power. The mean value of the total received power is denoted as , which can be estimated according to the received signal strength indicator (RSSI). The feedback of RSRPs and RSSIs from user terminals can be used to estimate the probability distributions of user SINRs [5]. The instantaneous SINR is expressed as
| (5) |
The data traffic is modeled as a semi-Markov on-off process that is assumed to be the independent and identically distributed (i.i.d.) among users. We assume that users can fully utilize the link capacity during session periods, and hence they always have data to transmit when they are active under on states. We use Pareto distribution for modeling the duration of the on state and exponential distribution for the duration of the off state, which are denoted as follows [8]:
| (6) |
| (7) |
Here parameters , and decide the characteristics of the on-off duration distributions. Accordingly, the mean durations of the two states are given as
| (8) | ||||
| (9) |
The traffic load is defined as the duty cycle of the on-off process, which can be calculated as
| (10) |
Specifically, when , the traffic in the system is saturated.
III Analysis of PFS Using GA
Under bursty on-off traffic, the active user set is dynamic due to the constant changes of user states. However, it keeps steady within the session duration which is still relatively much larger than the RB scheduling period. Thus, we can calculate the achievable date rate of a user under every possible combinations of the active users and their corresponding probabilities. The average throughput of the user is the weighted sum of these data rates in terms of the probabilities, which is calculated as
| (11) |
where is the average data rate of user while it is scheduled alone, is the PFS performance gain over the round-robin (RR) scheduling under saturated traffic when user is active along with other users in . When the total number of users is high, the computational complexity of (11) is large since is different for each subset that satisfies . Therefore, it needs to be calculated independently for each of the possible cases.
With the aim of tractable analysis, can be approximated so that the effect of on is only through the number of users in it. To this end, the instantaneous user data rates are modeled with the Gaussian distribution in [2]. An alternative approach is assuming that the normalized rates are i.i.d and linear in SINR [6]. The former one is referred to as GA and is adopted in this paper due to its higher estimation accuracy for multi-cell networks, which is compared with the latter one below.
The performance gain of PFS over RR under saturated traffic is estimated with GA as
| (12) |
where is the cumulative distribution function (CDF) of the standard normal distribution, is the standard deviation of the user data rate. and are calculated according to (3) and (4) in [2].
estimation under bursty on-off traffic.
estimation under saturated traffic.
the model in [6].
Denoting the integral in (12) as , i.e.,
| (13) |
the estimated performance gain in (12) is rewritten as
| (14) |
Substituting this into (11), we solve the closed-form expression of user throughput as
| (17) | ||||
| (18) |
where represents
| (19) |
Specially, under saturated traffic, i.e., , we have
| (20) |
The average data rate with RR scheduling is calculated as
| (21) |
According to (III) and (21), we obtain the performance gain of PFS over RR under bursty on-off traffic as
| (22) |
Specially, while , i.e., under saturated traffic,
| (23) |
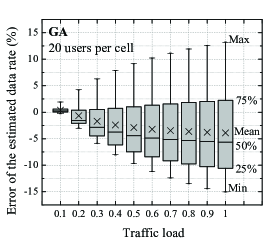
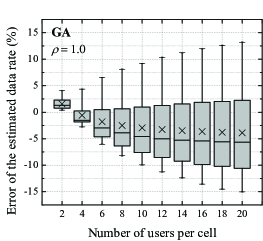
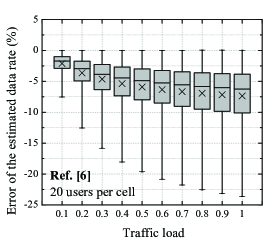
We use system-level simulations to evaluate the accuracy of the GA-based data rate estimation. The network configurations are identical with those in [5], and the scenario is analogous to the urban area of Berlin. The average number of user terminals per cell is 20 and they are uniformly randomly distributed over the cell areas. We set and for the on state, and thus . is set according to the test traffic load . The error of the GA-based data rate estimation is presented in Fig. 3. When the traffic load is low, the estimation error is very small. However, it increases significantly with the traffic load. We calculate the estimation error with various numbers of users per cell under saturated traffic as shown in Fig. 3. The GA-based approach results in larger deviation when there are more users. The chance of on state is large when the traffic load is high in the busty traffic scenario. Therefore, more users are likely to be active simultaneously and the estimation error increases in Fig. 3. The error of the estimated data rate by using the model in [6] is also presented in Fig. 3. This model results in worse estimation performance that has both an underestimation bias and much larger deviation compared to the GA-based analysis.
IV Analysis of PFS Using Hybrid Approximation
In order to remedy the shortcomings of GA under heavy traffic load and improve the estimation accuracy in multi-cell networks, we use the more accurate analytical model in [5]. This model is developed based on the multi-interference analysis and outperforms GA in terms of estimation accuracy under saturated traffic. Different from the GA model, MIA calculates the performance gain of a subset considering the specific users in it instead of only the number of users. Therefore, it cannot be extended directly for bursty traffic analysis due to the combinatorial complexity problem that we explained after (11). We design a hybrid approximation (HA) by using MIA in the saturated traffic case () and combining it with the GA-based estimation under bursty traffic ().
Before formulating the HA model, we briefly introduce MIA. It considers multiple independent interference signals separately. The CDF and probability distribution function (PDF) of instantaneous user SINR under Rayleigh fading channel are derived in [5] as
| (24) |
| (25) |
Based on this stochastic SINR model, we calculate the average user data rate under saturated traffic with MIA as
| (26) |
where is the data rate mapping function which is based on the Shannon capacity as in the GA-based estimation [2].
| (25) |
By combining the GA- and MIA-based approaches, we design a hybrid approximation (HA) as follows. We denote the increment part of the estimated performance gain in (22) as , i.e.,
| (27) |
We consider a hybrid strategy which uses the GA-based results under low traffic load and the MIA-based ones under high traffic load. In this way, the inaccuracy of GA can be remitted while the number of active users is high. Thus, the proposed HA model is formulated as in (25), where is the performance gain calculated by MIA under saturated traffic, i.e.,
| (26) |
In (25), the performance increment estimated by GA, i.e., , is weighted by . Item (a) is a ratio of the performance increment between unsaturated and saturated traffic, while item (b) is the performance increment estimated by MIA under saturated traffic. The combination of (a) and (b) is weighted by .
Specifically, we have the limiting values as
| (27) | ||||
| (28) |
Thus, HA yields identical results under extremely low and high traffic load with GA and MIA models, correspondingly.
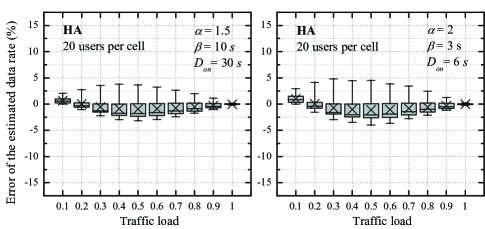
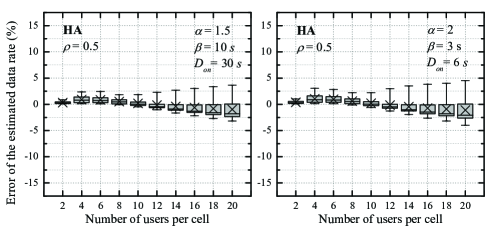
The simulation results of our HA model are shown in Fig. 4. It achieves significant improvement in terms of data rate estimation accuracy, especially under high traffic load. In addition, the HA model is tested with more transient session periods, i.e., . In comparison with the case where , the estimation errors vary only slightly, indicating that the accuracy of the HA model is not sensitive to the change of session duration. We further investigate the estimation accuracy with since the estimation error is larger under median traffic load as shown in Fig. 4. The simulation results with various numbers of users are presented in Fig. 5. The estimation error is always within with various numbers of users per cell, which is a significant reduction in comparison with the pure GA-based approach. Thus, the HA model is much more accurate for practical applications.
V Conclusions
In this letter, we derived the first analytical solution for estimating user data rates of PFS under bursty on-off traffic. We used Gaussian approximation to solve the closed-form expression of user data rates. The simulation results show that GA-based analysis is accurate under low traffic load. However, the estimation accuracy declines significantly as the number of active users increases. In order to improve the accuracy of data rate estimation in multi-cell network, we developed a hybrid approximation by employing MIA combined with GA as the traffic load increases. The simulation results verify that this approach increases the estimation accuracy significantly. The errors of the analytical results are lower than and are shown to be insensitive to changes in session duration, traffic load and user density.
References
- [1] L. Lei, C. Lin, J. Cai, and X. Shen, “Flow-level performance of opportunistic OFDM-TDMA and OFDMA networks,” IEEE Transactions on Wireless Communications, vol. 7, no. 12, pp. 5461-5472, Dec. 2008.
- [2] E. Liu and K. K. Leung, “Proportional fair scheduling: Analytical insight under rayleigh fading environment,” in Proc. IEEE WCNC, pp. 1883-1888, Mar. 2008.
- [3] D. Parruca and J. Gross, “On the interference as noise approximation in OFDMA/LTE networks,” in Proc. of IEEE ICC, pp. 2519-2525, Jun. 2014.
- [4] S. E. Sagkriotis, K. Kontovasilis, and A. D. Panagopoulos, “Proportional fair scheduling gains for AMC-aware systems under heterogeneous radio conditions,” IEEE Commun. Lett., vol. 16, no. 12, pp. 1984-1987, Dec. 2012.
- [5] F. Liu, J. Riihijärvi, and M. Petrova, “Robust data rate estimation with stochastic SINR modeling in multi-interference OFDMA networks,” in Proc. of IEEE SECON, pp. 211-219, Jun. 2015.
- [6] S. Borst, “User-level performance of channel-aware scheduling algorithms in wireless data networks,” IEEE/ACM Transactions on Networking, vol.13, no.3, pp. 636- 647, Jun. 2005.
- [7] 3GPP TS 36.211, “E-UTRA physical channels and modulation,” Jun. 2016.
-
[8]
N. Basher et al., “A comparative analysis of web and peer-to-peer traffic,” in Proc. of the 17th international conference on World Wide Web, pp. 287-296, Apr. 2008.