Forward-backward asymmetry of photoemission in excited by few-cycle laser pulses
Abstract
We theoretically analyze angle-resolved photo-electron spectra (ARPES) generated by the interaction of with intense, short laser pulses. In particular, we focus on the impact of the carrier-envelope phase (CEP) onto the angular distribution. The electronic dynamics is described by time-dependent density functional theory, and the ionic background of is approximated by a particularly designed jellium model. Our results show a clear dependence of the angular distributions onto the CEP for very short pulses covering only very few laser cycles, which disappears for longer pulses. For the specific laser parameters used in a recent experiments, a very good agreement is obtained. Furthermore, the asymmetry is found to depend on the energy of the emitted photoelectrons. The strong influence of the angular asymmetry of electron emission onto the CEP and pulse duration suggests to use this sensitivity as a means to analyze the structure of few-cycle laser pulses.
I Introduction
With the advance in laser technology, it has become possible to generate femtosecond laser pulses which cover only few optical cycles Nisoli et al. (1997); Paulus et al. (2001), and this has rapidly found a broad range of applications in many disciplines, such as the generation of attosecond pulses and precision control of chemical process. In this context, one of the most intriguing aspects is that these extremely short pulses may give access to time-resolved electronic dynamics in atoms and molecules. This paves the way to a multiplicity of interesting phenomena, such as high-order harmonic generation (HOHG), above-threshold ionization (ATI), and laser-induced molecular fragmentation, as has been seen already in several earlier experimental and theoretical studies Tempea et al. (1999); Paulus et al. (2001); Baltuška et al. (2003); Chelkowski and Bandrauk (2005); Kling et al. (2006); Liu et al. (2011); Xie et al. (2012); Suárez et al. (2015), for reviews see Refs. Brabec and Krausz (2000); Becker et al. (2002); Milošević et al. (2006); Haessler et al. (2011). It has also been shown that structural information of the target can be retrieved using short light pulses Morishita et al. (2008); Kang et al. (2010).
The carrier-envelope phase (CEP) is the phase of the fast oscillations of the laser field relative to its envelope. For few-cycle lasers, this CEP becomes a decisive laser parameter because the CEP offsets modify the pattern of the pulse dramatically, which, in turn, can have a strong impact on laser-induced electron dynamics. For example, photoelectron emission induced by few-cycle laser fields can be controlled by the CEP, leading to a pronounced forward-backward (also called “right-left”) asymmetry in the photoelectron spectra (PES). This has been experimentally reported in Paulus et al. (2003) where it was found that the outcome depends on the photoelectrons’ kinetic energy. The energy dependence has been explained within a semiclassical model by different electron emission processes in the low- and high-energy regimes Corkum (1993). In the low-energy regime, electrons are directly emitted with a kinetic energy of up to the , where (in atomic units) is the ponderomotive energy of the laser field.
In the high-energy regime, electron recollision with the target system dominates, forming a plateau-like structure in the PES delimited by a well-defined cutoff. The rescattered electrons can be accelerated to energies of roughly up to the Paulus et al. (1994) provided that the tail of the laser field is still sufficiently high which is, however, rather critical for few-cycle laser fields. Interestingly, a couple of theoretical calculations have shown that the parts of PES related to electron recollisions are more sensitive to CEP than those parts related to electrons emitted directly Milošević et al. (2003); Chelkowski and Bandrauk (2005); Tong et al. (2006); Liao et al. (2008); Suárez et al. (2015). Experimentally, the dependence of high-energy PES on the CEP has been explored for atoms, e.g., xenon Paulus et al. (2003); Kling et al. (2008), argon Lindner et al. (2005), krypton Kling et al. (2008), as well as for small-sized dimer molecules, e.g., N2 and O2 Gazibegović-Busuladžić et al. (2011). Recently, it has been studied in solids, such as tungsten Krüger et al. (2011) and gold nanotips Park et al. (2012) which were found to be efficient and controllable nanoemitters of extreme ultraviolet (XUV) electrons, thus allowing to investigate ultrafast electron dynamics in solids at an attosecond time scale, for a recent review see Ref. Krüger et al. (2012).
Compared to atoms and dimers, the fullerene is a typical example for a large system on the way from molecules to solids. Thus the study of might help toward understanding dynamical properties of nanosystems. The advantage of is its stability and accessibility which renders it a useful laboratory for the study, e.g., of thermal electron emission, charge migration, fragmentation channels, HHG, and ATI, see Refs. Hertel et al. (2005); Campbell et al. (2006); Ganeev (2011); Lépine (2015). From a geometrical point of view, is similar to the outermost part of capped-carbon nanotips which are promising XUV electron nanoemitters. In a previous work Gao et al. (2016), we have theoretically investigated the PES of in strong fields using a near-infrared laser pulse (=912 nm). In that study, CEP effects were neglected since we considered comparatively long pulses comprising about 8 optical cycles. Recently, experiments on using intense few-cycle infrared laser pulses (720 nm and 4 fs) Li et al. (2015) were reported, in which a dramatic dependence of the PES on CEP was observed and qualitatively reproduced by Monte Carlo (MC) and Quantum Dynamical (QD) simulations.
The aim of this article is to study the dependence of the PES on the CEP for illuminated by intense, infrared, few-cycle laser pulses in a fully quantum-mechanical framework. Our modeling is based on Time-Dependent Density-Functional Theory Runge and Gross (1984) with the time-dependent local-density approximation using the jellium approximation for the ionic background Gao et al. (2016). We will focus on the dependence of the CEP effect on pulse length and on the forward-backward asymmetry of photoemission due to electron rescattering.
II Formal framework
We describe the electronic dynamics of by time-dependent density functional theory (TDDFT) at the level of the time-dependent local density approximation (TDLDA) Dreizler and Gross (1990) using the exchange-functional from Perdew and Wang (1992). For an appropriate modeling of electron emission, we augment TDLDA by a self-energy correction (SIC) Perdew and Zunger (1981). As a full SIC treatment is computationally cumbersome Messud et al. (2008), we use it in a simplified, but reliable and efficient version as an average density SIC (ADSIC) Legrand et al. (2002). The ADSIC suffices to put the single-particle energies into right relation to continuum threshold such that the ionization potential (IP) is correctly reproduced in a great variety of systems Klüpfel et al. (2013) from simple atoms to large organic molecules. In this context, a correct description of IP is crucial for photoemission excited by external fields, in particular by strong fields as it is assumed to be dominated by electrons in the highest occupied molecular orbitals (HOMO) Müller and Fedorov (1996).
The ionic background (here carbon ions) is modeled within the jellium approximation by a sphere of positive charge with a void at the center Puska and Nieminen (1993); Bauer et al. (2001); Cormier et al. (2003). The jellium potential reads (in atomic units) :
| (1a) | |||||
| (1b) | |||||
| (1c) | |||||
| (1d) | |||||
| (1e) | |||||
Here denotes the Woods-Saxon profile, providing a soft transition from bulk shell to the vacuum. The jellium potential ) is augmented by an additional potential which is tuned to obtain reasonable values of the single-particle energies Reinhard et al. (2013). The shell radius is taken from experimental data as Hedberg et al. (1991). The other parameters are the same as those in Ref. Gao et al. (2016). With the present scheme, we reproduce rather well the electronic properties of : an IP at eV, a HOMO-LUMO gap of 1.77 eV, and a reasonable description of the photo-absorption spectrum Reinhard et al. (2013). This is in nice agreement with experimental values Lichtenberger et al. (1990); Sattler (2010).
It should be noted that the bulk density is determined such that . Note that this number of electrons is different from 240 for a real . This is because no jellium model so far manages to place the electronic shell at as it should be. Most have the closure at Puska and Nieminen (1993); Bauer et al. (2001); Cormier et al. (2003). The present model with soft surfaces comes to which is much closer to the reality. Nevertheless, we have to keep in mind that a jellium model is a rough approximation to a detailed ionic structure. But it is a powerful approximation as it allows to appropriately describe many features of electronic structure and dynamics in solids Ashcroft and Mermin (1976); Lemell et al. (2003) and cluster physics, see Refs. Kreibig and Vollmer (2013); Brack (1993). Recently, the present model has been validated as one of efficient and reliable tools to describe electron recollisions in strong fields in , see Ref. Gao et al. (2016). The jellium model stands naturally for a frozen ionic background. It is justified for the present study where the laser pulses considered are so short that the nuclear dynamics can be neglected.
Within the dipole approximation, and assuming a linearly polarized laser pulse with the polarization vector along the -axis , the interaction with the laser field (in atomic units) is given by
| (2) |
with the electric field chosen to be
| (3) |
for . Here, denotes the peak electric field, the carrier frequency, and the total pulse duration. The CEP is comprised in the parameter which defines the phase between oscillations at frequency and the maximum of the envelope. In what follows, we use laser parameters close to those in recent experiments Li et al. (2015): laser frequency eV (a wavelength of 720 nm), intensity , corresponding to field amplitude eV/a0, and total duration =4 fs, 6 fs, and 8 fs, corresponding to 1.7, 2.5, and 3.3 optical cycles (1 optical cycle = 2.4 fs). Note that these laser parameters are associated with a ponderomotive energy eV. Figure 1 illustrates the temporal part of the laser field for the three under consideration, each one for the CEP at (black curves) and (red curves).
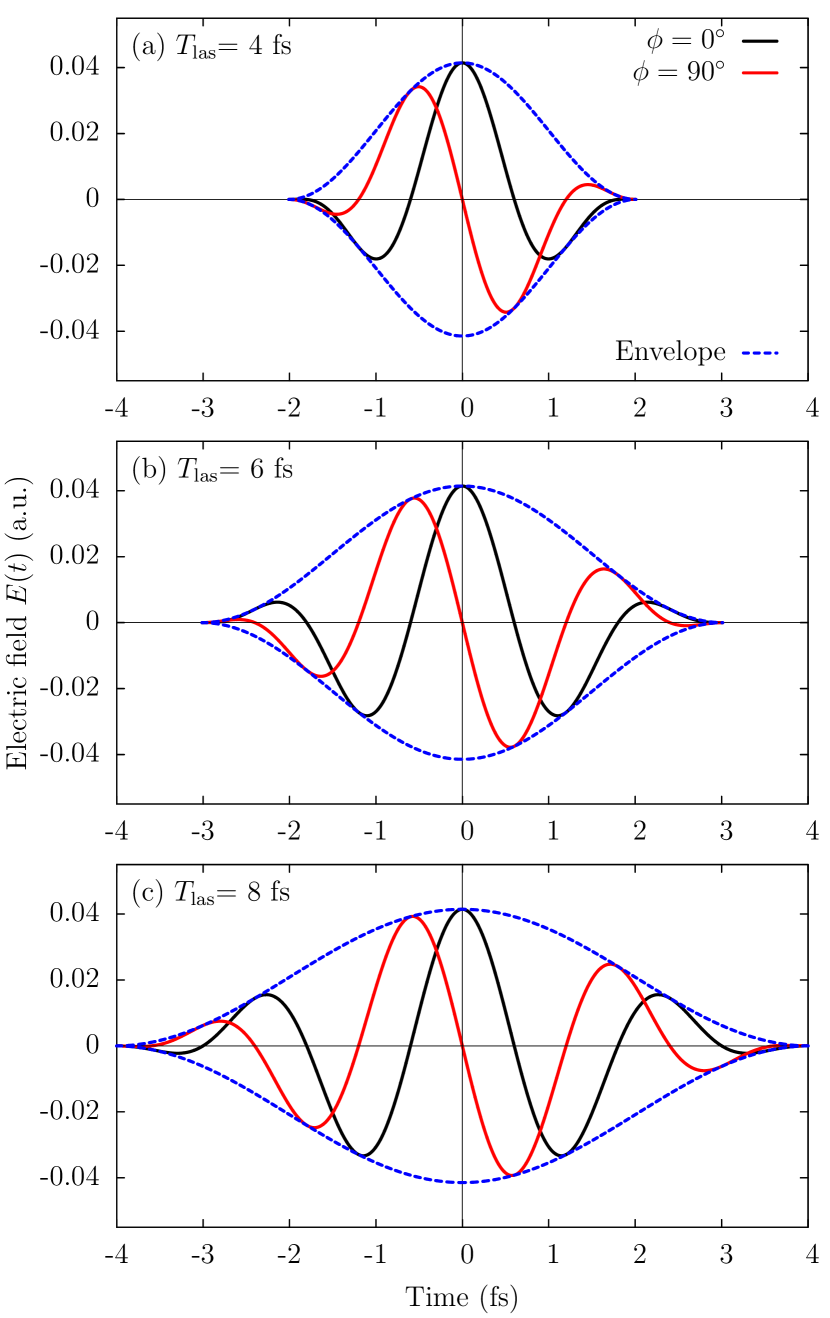
For , the center of the envelope coincides with a maximum of the oscillations, while for , it is shifted to match with the nodal points of the electric field. Clearly, we see a substantial change of the electric field due to the different CEP in each case.
II.1 Numerical details
The TDLDA equations are solved numerically on a cylindrical grid in coordinate space Montag and Reinhard (1995). The static iterations towards the electronic ground state are done with the damped gradient method Reinhard and Cusson (1982) and time evolution employs the time-splitting technique Feit et al. (1982). For details of the numerical methods, see Calvayrac et al. (2000); Reinhard and Suraud (2003); Wopperer et al. (2015). We use a numerical box which extends in direction (along the laser polarization) and orthogonal to it (radial coordinate), with a grid spacing of in both directions. Time propagation is followed up to after 44 fs with a small time step of fs. Box size and time span are sufficiently large to track completely the rescattering of electrons in the laser field (ponderomotive motion). To account for ionization, absorbing boundary conditions are implemented using a mask function Reinhard et al. (2006). The absorbing margin extends over 35 (70 grid points) at each side.
The central observable of electron emission in our analysis are angle-resolved photoelectron spectra (ARPES), i.e., the yield of emitted electrons [] as function of kinetic energy and emission angle . We calculate ARPES by recording at each time step the single-electron wave functions {, } at selected measuring points near the absorbing layer and finally transforming this information from time- to frequency-domain, see Pohl et al. (2001); De Giovannini et al. (2012); Dinh et al. (2013); Dauth and Kümmel (2016). Finally, the PES is written as
| (4) |
where are the transformed wave functions in energy domain. In case of strong fields, as we encounter here, the are to be augmented by a phase factor accounting for the ponderomotive motion, for technical details see Dinh et al. (2013). The angle is defined with respect to , i.e. means electronic emission in the direction of . A detailed ARPES analysis requires a fine resolution. To that end, we use an increment of 0.04 eV in energy and for the angular bins.
III Results and discussions
III.1 CEP-averaged PES
We first look at CEP-averaged photoelectron spectra, simply denoted by PES, of C60 in a forward emission cone as measured in the experiments of Li et al. (2015). The computed PES are thus averaged over CEP in a range of - with and collected in a forward cone with opening angle of . Figure 2 shows the calculated results for the three pulse lengths together with the experimental results (black solid circles) Li et al. (2015).
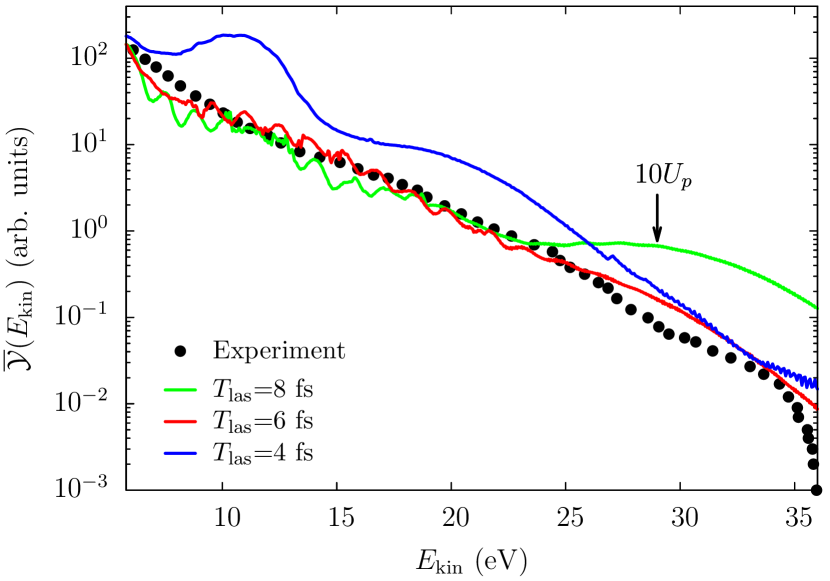
The patterns of the CEP-averaged PES are found to depend sensitively on the pulse length . At low energies ( eV), the photoelectron yield decreases with increasing . It is interesting to note that the PES for =4 fs reaches a maximum around 10 eV. This coincides approximately with 3.2 which is the maximal energy upon the first return of rescattered electrons. A similar pattern has been obtained in C60 by quantum dynamical (QD) calculations Li et al. (2015) under the same laser conditions. For the longest pulse considered, =8 fs, we find pronounced peaks which are the ATI peaks separated by the photon energy. For shortest pulse lengths, these structures vanish because the pulse does not have sufficient energy resolution any more. In the high-energy regime ( eV), we see a reverse dependence on , where the longest pulse (=8 fs) leads to the highest yield because there is more time to accelerate emitted electrons in the still ongoing laser field. The most satisfactory agreement between TDLDA results and experimental data is found for =6 fs, which can nearly reproduce the measured PES data in the full energy range. This strong dependence of PES on pulse length may provide an opportunity to characterize the experimental pulse duration by comparing the pattern of PES to calculated results.
III.2 Angle-resolved PES (ARPES)
In a next step, we analyze the full ARPES at fixed CEP values for the pulse length =6 fs where computed CEP-averaged PES agree best with experiments, as seen in the previous section.
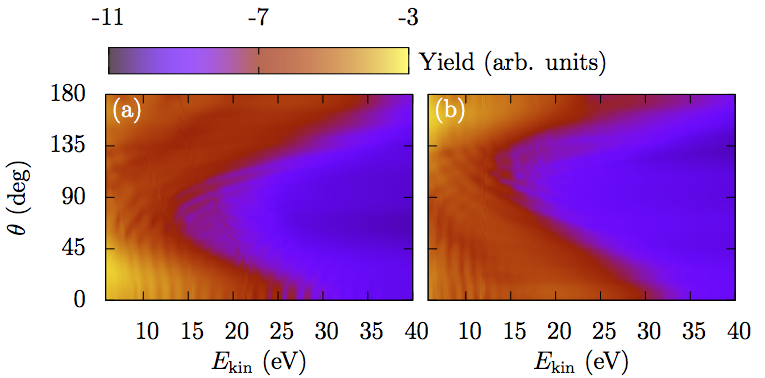
Figure 3 shows ARPES for two typical CEP values, in panel (a) and in (b). The most prominent feature in both cases is the remarkable asymmetry of the PES, particularly for electrons in the high-energy regime ( eV). At in Fig. 3(a), high-energy photoelectrons are emitted favorably in the direction towards , which is characterized by a rather broad ramp extending to 35 eV. In contrast, low-energy electrons ( eV) are emitted preferentially towards . The observed ARPES pattern is consistent with angular-integrated asymmetry maps in experiments Li et al. (2015) for the CEP analyzed here. The preferences of electron emission change for in Fig. 3(b), in which the low-energy electrons have more weight towards while the high-energy electrons prefer the other way towards . A similar asymmetry of the PES is also observed for 4 fs and 8 fs (not shown). The example demonstrates that strong few-cycle laser pulses can effectively control the ARPES.
This behavior has been observed also in experiments for xenon atoms Paulus et al. (2003) and has been theoretically analyzed in Milošević et al. (2003); Chelkowski and Bandrauk (2005) based on the strong-field approximations and on the integration of three-dimensional time-dependent Schrdinger equation. A semiclassical explanation is that the generation of high-energy electrons originate from the electron recolliding with the target, thus depending on the two time instants at which electrons were released and scattered off, respectively. It is difficult for few-cycle laser pulses to fulfill this condition simultaneously in and directions. However, it is possible to realize it in one of the two directions by tuning the CEP offset of the laser field, as shown in Fig. 3. This has been first suggested in Paulus et al. (2001) as a phase-meter to determine the absolute phase of an ultrashort laser pulse. We shall show in the next step that such a phase-meter strongly depends on pulse duration and that it becomes invalid with increasing pulse length.
III.3 Asymmetry versus CEP
The dominant feature of the ARPES in Fig. 3 is the strong influence of CEP on the energy resolved forward-backward asymmetry. This was also found in the previous work where the asymmetry often produces regular oscillations for the CEP as function of kinetic energy Milošević et al. (2006). To investigate such oscillations for the present example, we define the asymmetry as
| (5) |
where denotes in brief the integration in the energy interval and and stand for cones of emission angles. In most experiments, photoelectron yields are collected in a cone angle of . This means that corresponds to and to . We use the same convention for our theoretical analysis.
Figure 4 compares the asymmetry parameter between experiments (black solid circles) Li et al. (2015) and calculated results for various pulse lengths .
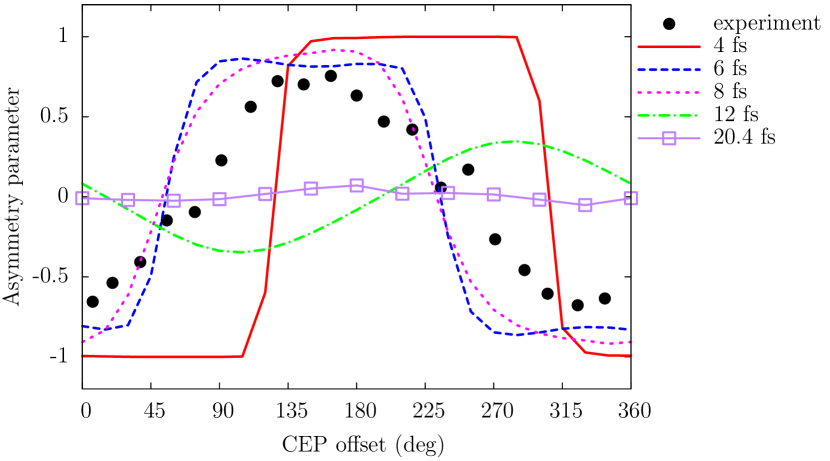
We find a good agreement between experimental data and present results for 6 fs (blue dashes) as well as 8 fs (magenta dots) regarding the width and position of the maxima of . Yet, slight differences remain for the shape of. The experimental curve shows softer transitions than the two theoretical curves. The cos2 envelope of the theoretical pulse, see Eq. (3), is surely more confined than the experimental pulse which is often assumed to have Gaussian envelope, but may easily be plagued by prepulses Giulietti et al. (2006).
The pattern of differ substantially from the experiment for other (smaller than 6-8 fs and larger ones) concerning position of maxima/minima, amplitude of oscillations, and softness on . Clear trends are seen for the amplitude which decreases with increasing and the softness which increases with , both together eventually wiping out the signal for long pulses. The trends are plausible. Very short pulse shrink basically to one oscillation and so become extremely sensitive to the CEP while more and more comparably high oscillations in longer pulses render the CEP less crucial. This strong sensitivity of the signal to pulses parameters raises the question how sensitive the result is to details of the pulse profile. To check that, we have also run calculations with a Gaussian envelope for the laser pulse instead of the cos2 envelope used above, see Eq. (3). The results are practically the same if the same FWHM is used. Therefore, we conclude that pulse length is the decisive parameter and measuring can give access to this parameter. However, emerges from combined action of laser pulses and responding system. This aspect, i.e., the influence of the system, will be addressed in future work.
Although it is plausible that the impact of CEP fades away for longer pulses, CEP-dependent asymmetry of the PES can be recovered also for longer pulses by a collinear, two-color pump-probe scheme, namely, a combination of a fundamental laser () and its -th order harmonic () typically represented by a - laser setup. The presence of a second harmonic is used to twist the field strength of the fundamental mode by varying the delay phase, resulting in the asymmetry in the field amplitude influencing ionization as well as the rescattering. The - scheme has previously been proposed in Paulus et al. (1995), and has later been used to explore the PES asymmetry in sodium clusters (Na4 and Na) excited by intense 7-cycle laser fields Nguyen et al. (2004). A more recent experimental application of - combined laser pulses on rare gas atoms and CO2 molecule is found in Ref. Skruszewicz et al. (2015). On this basis, the comparison of controlling efficiency of CEP-dependent asymmetry between one-color few-cycle fields and two-color multiple-cycle fields is an intriguing topic, yet this is beyond the scope of present study, thus we postpone it to the next exploration.
Since the asymmetry parameter (5) depends on the kinetic energy of the photoelectrons, it is also interesting to study its dependence on the energy. Figure 5 shows as a function of the kinetic energy and the , using 6 fs.
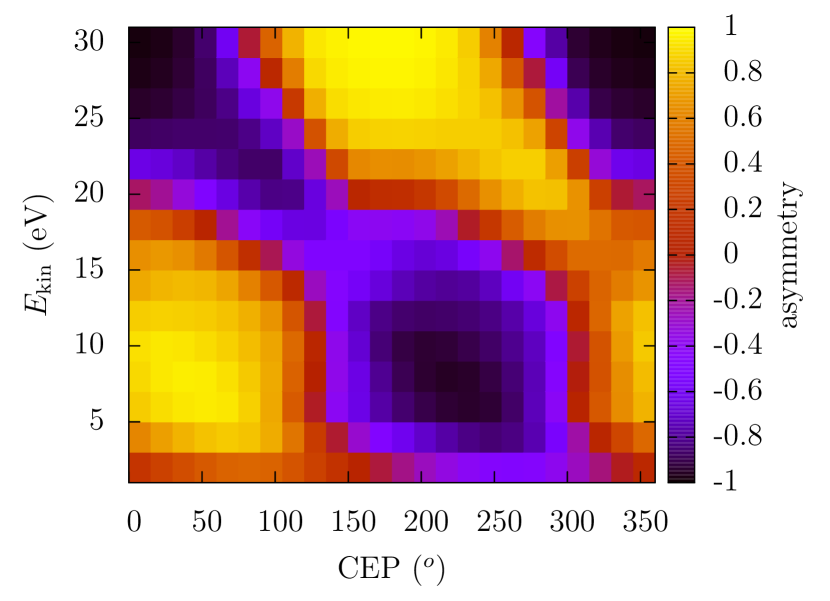
As most striking result, we find the the anisotropy parameter strongly depends both on the CEP and the kinetic energy of the emitted photoelectrons. For high energy electrons, i.e, between and , we find the strong CEP dependence already visible in Fig. 4. For low energy electrons, those less than , we find an opposite behavior. This reflects the complex electron dynamics taking place during the interaction with the ultrashort laser pulse, which changes drastically for different CEP’s.
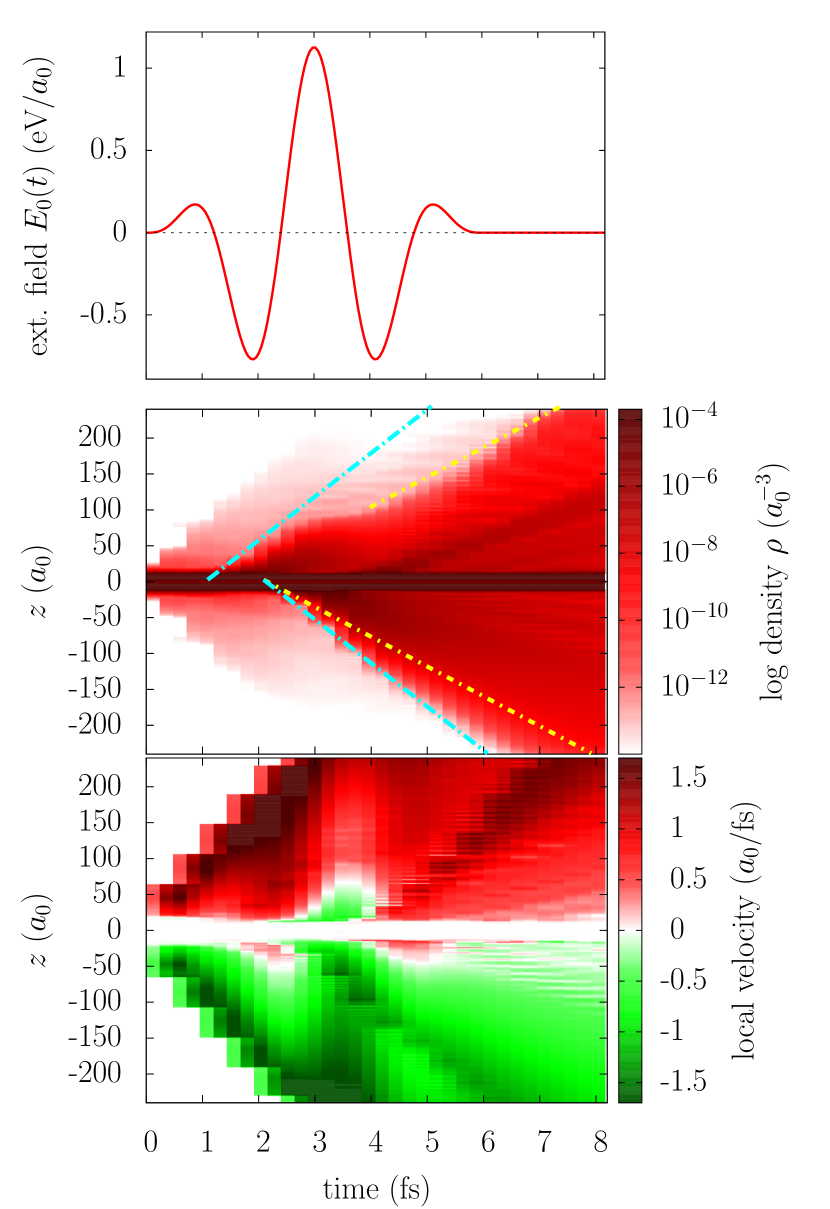
To explain these features in more detail, we have analyzed the electron dynamics in the case of . These results are depicted in Fig. 6 It shows the time evolution of the density (middle panel) and the velocity distribution (bottom panel), together with the electric field of the laser pulse (top panel). In analyzing the results, one has to concentrate on the low-density tail corresponding to the finally emitted flow. The velocities need to be looked together with the density because velocity alone does not indicate the importance of a contribution (which is weighted, of course, with the density). As soon as the electric field sets on, both the density and the velocity show oscillations synchronous with the external field. A bunch of high positive velocities (cyan line with positive slope) develops followed by a density shift to positive short after the first negative peak in at 2 fs. This turns into opposite direction following the strong positive peak in after 3 fs and a last swap back with the counter peak after 4 fs. A particularly interesting process takes places with the largest peak at 3 fs. The negative peak before has triggered a strong flow to positive . This is abruptly stopped and counter-weighted by the subsequent large positive field (exerting a force in the negative direction). The positive flow recovers only with the second negative peak and leaves the system with a kinetic energy of about 13.6 eV (yellow line with positive slope). The large positive peak, on the other hand, releases a bunch of fast electrons towards negative direction which escapes eventually with the higher kinetic energy of 27.2 eV (cyan line with negative slope). The detailed time-resolved picture so nicely elucidates the peaks on and direction in the previous figure.
IV Conclusions
We have investigated the impact of the carrier-envelope phase (CEP) of very short laser pulses on the angle-resolved photo-electron spectra (ARPES) of the cluster. To this end, we used as a tool time-dependent density-functional theory at the level of the time-dependent local-density approximation. This was augmented by self-interaction correction to achieve a correct ionization potential which is crucial for an appropriate description of photoemission dynamics. The ionic background is assumed to be frozen during the femtosecond dynamics. For , it is approximated by a jellium model which is particularly tuned to its special geometry. Absorbing boundary conditions are used to describe electron emission and ARPES are computed with sampling the time evolution of the single-electron wave functions at selected measuring points close to the absorbing margins.
Our results depend sensitively on the laser pulse length. This holds already for the global signal of CEP-averaged photo-electron spectra where we find a good agreement with experimental results when using the appropriate pulse length (and huge deviations from data for other pulse lengths). Particular attention was paid to the angular asymmetry of ARPES. A short glance at the full ARPES distribution and a detailed evaluation of asymmetry as a function of energy show that the asymmetry behaves different in low- and high-energy regime. This is explained in detail by analyzing the time-dependent density and velocity distributions of the accelerated electrons.
Following experimental data, we have focused then on the dependence of asymmetry on CEP in the regime of high-energy emission. For very short pulses, we find a strongly varying function oscillating with steep slopes between the forward/backward extremes of asymmetry. These patterns change significantly with the pulse parameters. The amplitude of oscillations shrinks with increasing pulse length while the pattern become softer. In particular, the signal practically disappears for longer pulses covering 8 laser cycles or more. We find again a good agreement with experimental data for the appropriate pulse length, the same which also allowed to reproduce the CEP-averaged photo-electron spectra.
We have studied the sensitivity of the results to the detailed profile of the laser pulse (Gaussian versus cos2). The differences are so small that pulse profiles cannot be identified clearly from the asymmetry signal.
This study emphasizes the amount of detailed information that can be gained from a systematic scan of the ARPES as a function of the CEP. For example, the high sensitivity of asymmetry versus CEP to the laser pulse may be used for an independent measurement of pulse parameters. This may constitute an interesting aspect for ultrashort pulse characterization. However, in order to develop the shown methodology in this direction, one needs to carefully disentangle pulse properties from system properties, as resonances. Research along these lines are currently being undertaken.
Acknowledgments:
We thank Institut Universitaire de France, European ITN network CORINF
and French ANR contract LASCAR (ANR-13-BS04-0007) for support during
the realization of this work. One of authors (C.-Z.G.) is grateful for
the financial support from China Scholarship Council (CSC) (No.
[2013]3009). It was also granted access to the HPC resources of CalMiP
(Calcul en Midi-Pyrénées) under the allocation P1238, and of RRZE
(Regionales Rechenzentrum Erlangen).
References
- Nisoli et al. (1997) M. Nisoli, S. De Silvestri, O. Svelto, R. Szipöcs, K. Ferencz, C. Spielmann, S. Sartania, and F. Krausz, Opt. Lett. 22, 522 (1997).
- Paulus et al. (2001) G. Paulus, F. Grasbon, H. Walther, P. Villoresi, M. Nisoli, S. Stagira, E. Priori, and S. De Silvestri, Nature 414, 182 (2001).
- Tempea et al. (1999) G. Tempea, M. Geissler, and T. Brabec, JOSA B 16, 669 (1999).
- Baltuška et al. (2003) A. Baltuška, T. Udem, M. Uiberacker, M. Hentschel, E. Goulielmakis, C. Gohle, R. Holzwarth, V. Yakovlev, A. Scrinzi, T. Hänsch, et al., Nature 421, 611 (2003).
- Chelkowski and Bandrauk (2005) S. Chelkowski and A. D. Bandrauk, Phys. Rev. A 71, 053815 (2005).
- Kling et al. (2006) M. Kling, C. Siedschlag, A. J. Verhoef, J. Khan, M. Schultze, T. Uphues, Y. Ni, M. Uiberacker, M. Drescher, F. Krausz, et al., Science 312, 246 (2006).
- Liu et al. (2011) Y. Liu, X. Liu, Y. Deng, C. Wu, H. Jiang, and Q. Gong, Phys. Rev. Lett. 106, 073004 (2011).
- Xie et al. (2012) X. Xie, K. Doblhoff-Dier, S. Roither, M. S. Schöffler, D. Kartashov, H. Xu, T. Rathje, G. G. Paulus, A. Baltuška, S. Gräfe, et al., Phys. Rev. Lett. 109, 243001 (2012).
- Suárez et al. (2015) N. Suárez, A. Chacón, M. F. Ciappina, J. Biegert, and M. Lewenstein, Phys. Rev. A 92, 063421 (2015).
- Brabec and Krausz (2000) T. Brabec and F. Krausz, Rev. Mod. Phys. 72, 545 (2000).
- Becker et al. (2002) W. Becker, F. Grasbon, R. Kopold, D. Milosevic, G. Paulus, and H. Walther, Adv. Atom Mol. Opt. Phys. 48, 35 (2002).
- Milošević et al. (2006) D. Milošević, G. Paulus, D. Bauer, and W. Becker, J. Phys. B: At. Mol. Opt. Phys. 39, R203 (2006).
- Haessler et al. (2011) S. Haessler, J. Caillat, and P. Salieres, J. Phys. B: At. Mol. Opt. Phys. 44, 203001 (2011).
- Morishita et al. (2008) T. Morishita, A.-T. Le, Z. Chen, and C. D. Lin, Phys. Rev. Lett. 100, 013903 (2008).
- Kang et al. (2010) H. Kang, W. Quan, Y. Wang, Z. Lin, M. Wu, H. Liu, X. Liu, B. B. Wang, H. J. Liu, Y. Q. Gu, et al., Phys. Rev. Lett. 104, 203001 (2010).
- Paulus et al. (2003) G. G. Paulus, F. Lindner, H. Walther, A. Baltuška, E. Goulielmakis, M. Lezius, and F. Krausz, Phys. Rev. Lett. 91, 253004 (2003).
- Corkum (1993) P. B. Corkum, Phys. Rev. Lett. 71, 1994 (1993).
- Paulus et al. (1994) G. G. Paulus, W. Becker, W. Nicklich, and H. Walther, J. Phys. B: At. Mol. Opt. Phys. 27, L703 (1994).
- Milošević et al. (2003) D. Milošević, G. Paulus, and W. Becker, Opt. Express 11, 1418 (2003).
- Tong et al. (2006) X. M. Tong, K. Hino, and N. Toshima, Phys. Rev. A 74, 031405 (2006).
- Liao et al. (2008) Q. Liao, P. Lu, P. Lan, W. Cao, and Y. Li, Phys. Rev. A 77, 013408 (2008).
- Kling et al. (2008) M. Kling, J. Rauschenberger, A. Verhoef, E. Hasović, T. Uphues, D. Milošević, H. Muller, and M. Vrakking, New J. Phys. 10, 025024 (2008).
- Lindner et al. (2005) F. Lindner, M. G. Schätzel, H. Walther, A. Baltuška, E. Goulielmakis, F. Krausz, D. B. Milošević, D. Bauer, W. Becker, and G. G. Paulus, Phys. Rev. Lett. 95, 040401 (2005).
- Gazibegović-Busuladžić et al. (2011) A. Gazibegović-Busuladžić, E. Hasović, M. Busuladžić, D. B. Milošević, F. Kelkensberg, W. K. Siu, M. J. J. Vrakking, F. Lépine, G. Sansone, M. Nisoli, et al., Phys. Rev. A 84, 043426 (2011).
- Krüger et al. (2011) M. Krüger, M. Schenk, and P. Hommelhoff, Nature 475, 78 (2011).
- Park et al. (2012) D. J. Park, B. Piglosiewicz, S. Schmidt, H. Kollmann, M. Mascheck, and C. Lienau, Phys. Rev. Lett. 109, 244803 (2012).
- Krüger et al. (2012) M. Krüger, M. Schenk, M. Förster, and P. Hommelhoff, J. Phys. B: At. Mol. Opt. Phys. 45, 074006 (2012).
- Hertel et al. (2005) I. Hertel, T. Laarmann, and C. Schulz, Adv. Atom Mol. Opt. Phys. 50, 219 (2005).
- Campbell et al. (2006) E. E. Campbell, K. Hansen, M. Hedén, M. Kjellberg, and A. V. Bulgakov, Photochem. Photobiol. Sci. 5, 1183 (2006).
- Ganeev (2011) R. Ganeev, Laser Phys. 21, 25 (2011).
- Lépine (2015) F. Lépine, J. Phys. B: At. Mol. Opt. Phys. 48, 122002 (2015).
- Gao et al. (2016) C.-Z. Gao, P. M. Dinh, P. Klüpfel, C. Meier, P.-G. Reinhard, and E. Suraud, Phys. Rev. A 93, 022506 (2016).
- Li et al. (2015) H. Li, B. Mignolet, G. Wachter, S. Skruszewicz, S. Zherebtsov, F. Süßmann, A. Kessel, S. Trushin, N. G. Kling, M. Kübel, et al., Phys. Rev. Lett. 114, 123004 (2015).
- Runge and Gross (1984) E. Runge and E. K. Gross, Phys. Rev. Lett. 52, 997 (1984).
- Dreizler and Gross (1990) R. M. Dreizler and E. K. U. Gross, Density Functional Theory: An Approach to the Quantum Many-Body Problem (Springer-Verlag, Berlin, 1990).
- Perdew and Wang (1992) J. P. Perdew and Y. Wang, Phys. Rev. B 45, 13244 (1992).
- Perdew and Zunger (1981) J. P. Perdew and A. Zunger, Phys. Rev. B 23, 5048 (1981).
- Messud et al. (2008) J. Messud, P. M. Dinh, P.-G. Reinhard, and E. Suraud, Ann. Phys. (N.Y.) 324, 955 (2008).
- Legrand et al. (2002) C. Legrand, E. Suraud, and P.-G. Reinhard, J. Phys. B: At. Mol. Opt. Phys. 35, 1115 (2002).
- Klüpfel et al. (2013) P. Klüpfel, P. M. Dinh, P.-G. Reinhard, and E. Suraud, Phys. Rev. A 88, 052501 (2013).
- Müller and Fedorov (1996) H.-G. Müller and M. Fedorov, Super-intense laser-atom physics IV, vol. 13 (Springer Science & Business Media, 1996).
- Puska and Nieminen (1993) M. Puska and R. M. Nieminen, Phys. Rev. A 47, 1181 (1993).
- Bauer et al. (2001) D. Bauer, F. Ceccherini, A. Macchi, and F. Cornolti, Phys. Rev. A 64 (2001).
- Cormier et al. (2003) E. Cormier, P.-A. Hervieux, R. Wiehle, B. Witzel, and H. Helm, Eur. Phys. J. D 26, 83 (2003).
- Reinhard et al. (2013) P.-G. Reinhard, P. Wopperer, P. M. Dinh, and E. Suraud, in ICQNM 2013, The Seventh International Conference on Quantum, Nano and Micro Technologies (2013), pp. 13–17.
- Hedberg et al. (1991) K. Hedberg, L. Hedberg, D. S. Bethune, C. A. Brown, H. C. Dorn, R. D. Johnson, and M. de Vries, Science 254, 410 (1991).
- Lichtenberger et al. (1990) D. L. Lichtenberger, M. E. Jatcko, K. W. Nebesny, C. D. Ray, D. R. Huffman, and L. D. Lamb, Mater. Res. Soc. Symp. Proc. 206, 673 (1990).
- Sattler (2010) K. Sattler, Handbook of Nanophysics: Clusters and Fullerenes, Handbook of Nanophysics (CRC Press, 2010).
- Ashcroft and Mermin (1976) N. W. Ashcroft and N. D. Mermin, Solid State Physics (Saunders College, Philadelphia, 1976).
- Lemell et al. (2003) C. Lemell, X.-M. Tong, F. Krausz, and J. Burgdörfer, Phys. Rev. Lett. 90, 076403 (2003).
- Kreibig and Vollmer (2013) U. Kreibig and M. Vollmer, Optical properties of metal clusters, vol. 25 (Springer Science & Business Media, 2013).
- Brack (1993) M. Brack, Rev. Mod. Phys. 65, 677 (1993).
- Montag and Reinhard (1995) B. Montag and P.-G. Reinhard, Z. Phys. D: At., Mol. Clusters 33, 265 (1995).
- Reinhard and Cusson (1982) P.-G. Reinhard and R. Cusson, Nucl. Phys. A 378, 418 (1982).
- Feit et al. (1982) M. Feit, J. Fleck, and A. Steiger, J. Comput. Phys. 47, 412 (1982).
- Calvayrac et al. (2000) F. Calvayrac, P.-G. Reinhard, E. Suraud, and C. A. Ullrich, Phys. Rep. 337, 493 (2000).
- Reinhard and Suraud (2003) P.-G. Reinhard and E. Suraud, Introduction to Cluster Dynamics (Wiley, New York, 2003).
- Wopperer et al. (2015) P. Wopperer, P. M. Dinh, P.-G. Reinhard, and E. Suraud, Phys. Rep. 562, 1 (2015).
- Reinhard et al. (2006) P.-G. Reinhard, P. D. Stevenson, D. Almehed, J. A. Maruhn, and M. R. Strayer, Phys. Rev. E 73, 036709 (2006).
- Pohl et al. (2001) A. Pohl, P.-G. Reinhard, and E. Suraud, J. Phys. B 34, 4969 (2001).
- De Giovannini et al. (2012) U. De Giovannini, D. Varsano, M. A. L. Marques, H. Appel, E. K. U. Gross, and A. Rubio, Phys. Rev. A 85, 062515 (2012).
- Dinh et al. (2013) P. M. Dinh, P. Romaniello, P.-G. Reinhard, and E. Suraud, Phys. Rev. A 87, 032514 (2013).
- Dauth and Kümmel (2016) M. Dauth and S. Kümmel, Phys. Rev. A 93, 022502 (2016).
- Giulietti et al. (2006) A. Giulietti, P. Tomassini, M. Galimberti, D. G. L. A. Gizzi, P. Koester, L. Labate, T. Ceccotti, P. D’Oliveira, T. Auguste, P. Monot, et al., Phys. Plasmas 13, 093103 (2006).
- Paulus et al. (1995) G. Paulus, W. Becker, and H. Walther, Phys. Rev. A 52, 4043 (1995).
- Nguyen et al. (2004) H. Nguyen, A. Bandrauk, and C. A. Ullrich, Phys. Rev. A 69, 063415 (2004).
- Skruszewicz et al. (2015) S. Skruszewicz, J. Tiggesbäumker, K.-H. Meiwes-Broer, M. Arbeiter, T. Fennel, and D. Bauer, Phys. Rev. Lett. 115, 043001 (2015).