Terahertz Dielectric Analysis and Spin-Phonon Coupling in Multiferroic \ceGeV4S8
Abstract
We present an investigation of the multiferroic lacunar spinel compound \ceGeV4S8 using time-domain terahertz spectroscopy. We find three absorptions which either appear or shift at the antiferromagnetic transition temperature, T K, as S=1 magnetic moments develop on vanadium tetrahedra. Two of these absorptions are coupled to the magnetic state and one only appears below the Néel temperature, and is interpreted as a magnon. We also observe isosbestic points in the dielectric constant in both the temperature and frequency domains. Further, we perform analysis on the isosbestic features to reveal an interesting collapse into a single curve as a function of both frequency and temperature, behavior which exists throughout the phase transitions. This analysis suggests the importance of spectral changes in the terahertz range which are linear in frequency and temperature.
I Introduction
The lacunar spinel family of materials (\ceAM4X8) hosts many compelling phases of matter, including an insulating, Néel-type skyrmion,Kézsmárki et al. (2015); Ruff et al. (2015) superconductivity under pressure, Abd-Elmeguid et al. (2004) heavy-fermion behavior, Rastogi et al. (1983); Rastogi and Wohlfarth (1987) and theoretically predicted two-dimensional topological insulation. Kim et al. (2014) In these materials, spin-orbit coupling and electronic correlations can play a pivotal role. The lacunar spinel crystal structure differs from the typical spinel (\ceAM2X4) as every second A-site is removed, resulting in an \ceNaCl arrangement of tetrahedral ( and cubane structures (see figure 1 in reference (7)). The tetrahedra can support magnetic moments and act as hopping centers. Sahoo and Rastogi (1993); Rastogi and Niazi (1996) Further, intracluster electronic arrangement, Coulombic interactions, and intercluster distances all support the insulating state, resulting in a novel type of Mott insulator. Johrendt (1998); Müller et al. (2006)
The skyrmion-host \ceGaV4S8 is perhaps the most similar within this family to the material studied here, \ceGeV4S8. Both materials undergo Jahn-Teller driven structural transitions from the cubic phase in the 30-45 K range and magnetic transitions in the 10-20 K range. Hlinka et al. (2016); Pocha et al. (2000); Ruff et al. (2015); Yadav et al. (2008); Sahoo and Rastogi (1993); Müller et al. (2006); Chudo et al. (2006); Bichler et al. (2008); Singh et al. (2014); Widmann et al. (2016) While much of the magnetism in these compounds, including the novel insulating skyrmionic state in \ceGaV4S8, is driven by ferromagnetic (FM) interactions, \ceGeV4S8 is antiferromagnetic (AFM). Yadav et al. (2008); Chudo et al. (2006)
Prior work on \ceGeV4S8 has revealed a multitude of couplings that drive the two phase transitions. A Jahn-Teller distortion (T K) drives a symmetry change from a high-temperature, cubic F3m structure to orthorhombic, Imm2 ferroelectric (FE) state. Bichler et al. (2008) We note that recent work has suggested that the high-temperature, paraelectric phase is actually the (perhaps dynamically appearing) tetragonal space group Im2. Cannuccia et al. (2017) Orbital ordering also occurs at TJT, where charge is reorganized within the vandium tetrahedral cluster.Singh et al. (2014) The lower AFM transition (T K) results from the coupling between the two unpaired electrons (S=1) that reside in the V4 clusters. Johrendt (1998) Spin-phonon coupling has been previously reported in this material, as the tetrahedra are known to distort at TN. Bichler et al. (2008)
As this material undergoes FE and AFM transitions, it is classified as a multiferroic. Further, as ferroelectricity and antiferromagnetism occur at distinct temperatures, \ceGeV4S8 is a type-I multiferroic. Singh et al. (2014) note that \ceGeV4S8 displays an unusual combination of strong magnetoelectric coupling with distinct electric and magnetic ordering temperatures, making it a candidate for interesting device physics.Singh et al. (2014)
We use THz spectroscopy to study \ceGeV4S8 since it has been a powerful tool in the investigation of the electrodynamic properties of novel magnetic materials in the last years. It has led to the discovery of new elementary excitations, Pimenov et al. (2006); Sushkov et al. (2007); Mai et al. (2016) electromagnons in multiferroics, as well as to the furthering of our understanding of spin-phonon coupling in frustrated magnets.Sushkov et al. (2005); Hemberger et al. (2006) In this work, we find absorptions coupled to the magnetic state in the THz frequency range. We also provide evidence for the observation of a magnetic absorption. Lastly, we investigate two parameter-independent points in our data, known as isosbestic points, with a technique from Greger et al. (2013) to reveal intrinsic parameter dependence and collapsed behavior, which in one case persist through the phase transitions.
II Experimental Methods
Polycrystalline \ceGeV4S8 was synthesized by solid state reaction. Stoichiometric amounts of germanium (99.999), vanadium (99.5) and sulfur (99.9995) were ground under an inert atmosphere and sealed in a silica tube. The tube was heated slowly to 750∘C and held at that temperature for 24 hours. The mixture was then ground again in an inert atmosphere and pressed into a pellet. This pellet was sealed in a silica tube and then heated to 800∘C for 20 hours. The phase purity of the powder was checked with powder X-ray diffraction and no signs of an impurity phase were found.
Magnetic measurements were carried out in a SQUID magnetometer from Quantum Design from 2 K to 300 K. The magnetic susceptibility and low temperature inverse magnetic susceptibility are plotted in figure 1. After zero-field cooling, the measurements were made upon warming from 2 K to 300 K under an applied magnetic field of 500 Oe. The susceptibility shows Curie-Weiss behavior above the 31.5 K structural transition. The anomalies seen at temperatures 31.5 K and 17 K represent the structural and magnetic transitions, respectively. The 17 K AFM transition appears as a cusp in the susceptibility curve. The observed Néel temperature is consistent with previous reports that have ranged from 13 to 18 K. Müller et al. (2006); Bichler et al. (2008); Singh et al. (2014) The step-like transition observed at 31.5 K has been shown to be the consequence of a structural transition from cubic (possibly tetragonal, as noted above) to orthorhombic. Singh et al. (2014) Above the structural transition at 31.5 K, the inverse susceptibilities are studied to discuss the Curie-Weiss behavior.
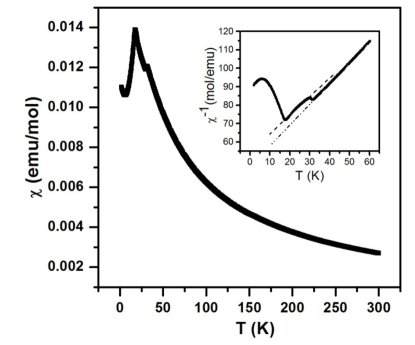
A Curie-Weiss fit from 40 K to 300 K yields an effective moment of 2.7 B and a Curie-Weiss temperature of -44 K. A fit to the data between the transitions at 17 K and 31.5 K yields an effective moment of 2.86 B and a Weiss temperature of -55 K. These observed Curie-Weiss parameters are comparable to previously reported values. Widmann et al. (2016); Bichler et al. (2008) The negative value of Curie-Weiss temperature is consistent with AFM exchange interactions. The fitted moments are consistent with spin-1 V3+.
Time-domain terahertz spectroscopy (TDTS)Fattinger and Grischkowsky (1989) was performed at temperatures down to 7.6 K, within frequency range 0.2 -– 1.5 THz. The high frequency limit is determined by the absorption of the cryostat windows (z-cut quartz). In TDTS, a 20 fs pulse of 800 nm central frequency is split into two pulses via a beamsplitter and a delay stage is used to create a path length difference between the two pulses. One pulse travels to a biased photoconductive THz emitter and the other to a non-biased photoconductive THz detector. At both the emitter and detector, carriers of 1 ps lifetime are created. The generated carriers at the emitter accelerate due to the bias, creating a current which emits THz radiation into free space. After this THz pulse is focused through a sample via off-axis parabolic mirrors, it arrives at the photoconductive detector. The electric field of the transmitted THz pulse generates a current in the photoconductive detector, which is sent to a pre-amplifier and lock-in detector. This sectional measurement of the THz pulse via optical path length variation thus constitutes a full characterization of the electric field of the THz pulse in the time-domain.
The complex transmission is experimentally determined by taking the ratio of the Fourier transforms of a pulse transmitted through the sample and a pulse transmitted through an empty aperture. Since we are measuring a pressed powder and thus all crystal orientations at once, we obtain pseudo-optical constants from the transmission coefficient. However, we omit the prefix pseudo in the following. The powder measurement allows us to see all polarization/magnetization dependent absorptions without needing access to multiple single crystals cut along different planes.
In a slab geometry, the transmission is calculable from the Fresnel coefficients at normal incidence. The resulting equation is numerically solved for the complex index of refraction, , and the index may then be converted to a frequency-dependent conductivity () or dielectric constant (). As the conductivity and dielectric constant are related by , we present the dissipative optical constant and the dissipationless term , resulting in a full description of the linear optical response of the material.
III Results and Discussion
III.1 Optical Constants
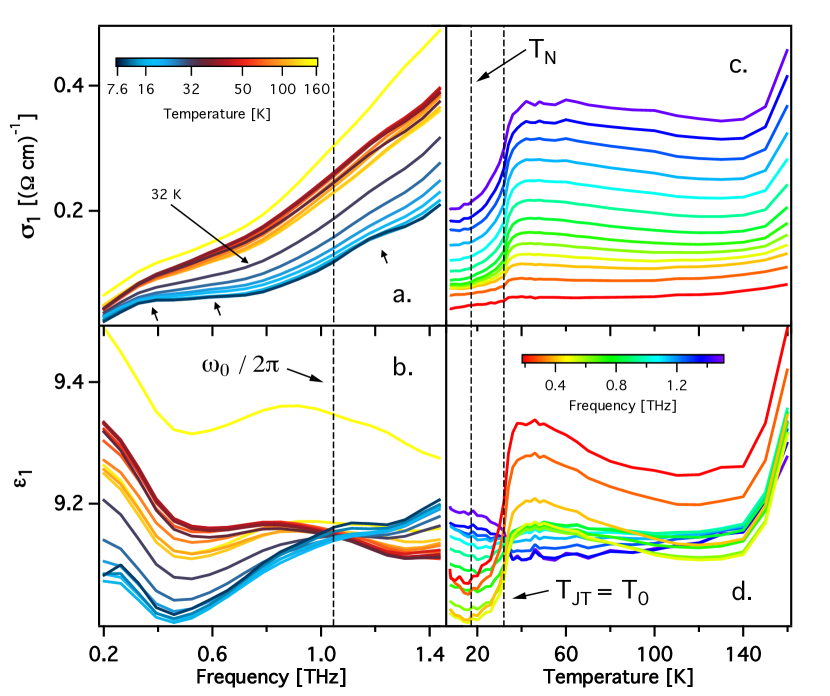
In figure 2a., we notice several features in the real part of the conductivity, , versus frequency. A strong low-frequency absorption around 350 GHz, and weaker features at 600 GHz (which only appears below TN) and 1.2 THz (see also figure 3) are clearly observed. These features appear, shift, and/or sharpen below TN, suggesting that they are either magnetic or couple to the magnetic state. The most prominent feature, at 350 GHz exists above and below both TN and TJT, as does the 1.2 THz absorption. Importantly, as these two absorptions are present above TN, they are not magnons. Also, all three absorptions sit on a background of increasing conductivity with frequency, which is interpreted as the contribution from the low-frequency tails of all THz-active phonons whose resonant frequency is above the available bandwidth. The effect of these phonons is observable as we are measuring a pressed powder and viewing all crystal orientations at once. Finally, we note an overall jump in at TJT which will be discussed further below.
In figure 2b., we examine the real part of the dielectric constant, , versus frequency, and note the following. First, there is a low-frequency, low temperature feature which corresponds, via Kramers-Kronig relations, to the peak seen around 350 GHz in . Secondly, upon cooling, there is an abrupt decrease in the low-frequency ( 1 THz) value of below the Jahn-Teller structural transition, perhaps due to reduced fluctuations of polarization at the onset of FE order. Lastly, there is a frequency (marked 1.04 THz) where the value of remains mostly unchanged throughout both phase transitions. We refer to this as a temperature-independent isosbestic point.
In figure 2c., which displays the constant frequency cuts of figure 2a., we present vs. T, in which we similarly note the jump in conductivity as temperature is increased past the Jahn-Teller transition, indicating that THz conduction is more dissipative in the higher-temperature structure. A qualitatively similar jump is seen in \ceGaV4S8. Wang et al. (2015) The prominent change in observed at high frequencies in our data for \ceGeV4S8 is believed to result from the phononic behavior above the available bandwidth, similar to the \ceGaV4S8 phonon behavior observed in ref. (11).
In figure 2d., which contains the constant frequency cuts of figure 2b., a nearly frequency-independent isosbestic point is clearly seen in at the Jahn-Teller transition. Also, we note a minimum at the first temperature we measured below TN (16 K), for frequencies below 500 GHz, which is the region where the low-frequency absorption is expected to have most contribution. This is comparable with the behavior of through TN in \ceGaV4S8 where there is a change in slope. Wang et al. (2015) Above K, we see an increase in both and which is unexpected as there is no known phase transition in \ceGeV4S8 at this temperature.
III.2 Spin-Phonon Coupling
 , multiplied by 2) and .85-1.44 THz (
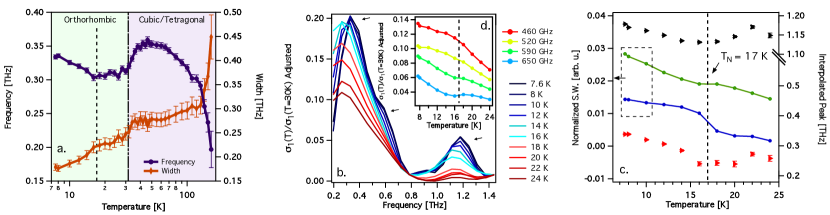
 ) regions and also the interpolated peaks from panel b. (
 : 350 GHz absorption;
  : 1.2 THz absorption; error bars are from Gaussian fits to 100 GHz around each peak). The Néel temperature is marked by a vertical dashed line to emphasize the significance of the magnetic transition. Panel d. shows selected fixed frequency cuts of panel b. The emergence of the magnon is clearly seen below the Néel temperature marked as a vertical dash line.
As we observe all crystal orientations at once, modeling the absorptions at 350 GHz, 600 GHz and 1.2 THz with traditional forms can be suggestive, but not exact. Rigorous modeling can be especially challenging when separating the response of features in the bandwidth from the tails of unseen features outside of our bandwidth. In fact, without knowing the parameters of the relevant high-frequency phonons, it is essentially impossible to distinguish an inherently asymmetric phonon from a symmetric phonon whose apparent asymmetry is introduced by the increasing background. We, however, address this problem of parameter extraction in two ways: first, we make gaussian fits to the 350 GHz peak observed in (). We are here primarily concerned with two results: the gaussian center frequency and width. These results are shown in 3a. and allow us to analyze frequency shift of the absorption, as well as sharpening.
We find the expected anharmonic behavior of a phonon hardening upon cooling in the center frequency at high temperatures in figure 3a. Around T 50 K 1.5 TJT, we begin to see softening of this excitation. This is possibly due to magnetic fluctuations coupling to the phonon, similarly to what has been observed in other systems Sushkov et al. (2005); Hemberger et al. (2006); Valdés Aguilar et al. (2006, 2008, 2007). Below TJT the frequency flattens, suggesting that the effect of these magnetic fluctuations has been reduced due to a transition to a new crystal structure. In this picture, finally, magnetic ordering ends the fluctuation-based softening and standard phonon hardening resumes below TN.
We make special note of the relation between our 350 GHz phonon and those observed in the infrared by Cannuccia et al. (2017). In particular, we draw comparison to the 325 cm-1 and 455 cm-1 (9.7 and 13.6 THz, respectively) phonons, where these phonon frequencies are seen to increase when cooling to about 50 K, below which the phonons begin to soften. These modes are attributed to V4 intra-cluster bond length changes. Below TJT, the frequencies remain temperature independent down to their lowest measured temperature of 22 K, as does our 350 GHz absorption. This is in complete agreement with our temperature-dependent modeling of the 350 GHz peak, and strongly suggests that the absorption we measure is related to the V4 cluster dynamics.
In the width of the gaussian fits we see evidence for near monotonic phonon sharpening. There are three clear regions of sharpening defined by the transition temperatures. This further emphasizes that both transitions govern the behavior of this mode. It has been suggested that the 350 GHz absorption is restricted to the V4 clusters, perhaps as a breathing-type mode, or an electronic/many-body excitation.Reschke et al. (2017) As the frequency of this absorption is seen to shift upon the phase transitions, where the lattice is known to distort, we find all of these explanations to convey the same message of a THz frequency absorption sensitive to spin and lattice dynamics. However, the strong similarity between the temperature dependence of the 350 GHz mode and the infrared phonons observed by Cannuccia et al. (2017), clearly indicates that this is a phonon and not an electronic excitation. In addition, these authors also suggest that the high temperature crystallographic structure is not cubic, but tetragonal as pointed out above. They find that distinguishing between these symmetries is extremely hard using scattering experiments. It is therefore possible that the 350 GHz phonon we observe is a signature of the structure being tetragonal and not cubic, as the lowest phonon in the cubic structure is not expected to have such a low frequency.
Our second approach to isolating the absorptions from the background is done by computing the ratio of to and subtracting away a linear term (defined by the line that joins frequencies 0.79 and 1.44 THz; subtraction of a quadratic term shows the same qualitative results). Here, we lastly add a small uniform offset to keep all resulting curves positive. The resulting data for temperatures at and below 24 K are plotted in figure 3b. We then examine the quantity d associated to these features in figure 3c. to understand the temperature-dependent strength of the absorptions. Although this integral is not strictly the spectral weight of these modes, it is closely associated to it, and we use this terminology in what follows. We find the same qualitative conclusions when using reference temperatures above TJT or using a subtraction technique to find the difference in conductivity between temperatures above and below TJT, which shows the robustness of the conclusions.
In figure 3b., we again find evidence that this 350 GHz absorption sharpens with decreasing temperature and its peak undergoes an abrupt shift in frequency below TN. Around 600 GHz, we note a feature that appears only below TN, and as can be seen from figure 2, this feature is the weakest of the three observed. For these reasons, we suggest that it is a magnon. Its normalized spectral weight, shown in figure 3c., increases in the region 0.52 - 0.72 THz. While this mode sits on the shoulder of the 350 GHz phonon, it clearly protrudes from it with decreasing temperature and thus is regarded as an additional feature. In figure 3d. we show constant frequency cuts of the adjusted conductivity ratios to display the distinct behavior of the magnon from the shoulder of the 350 GHz phonon; only within the frequency range of the magnon does the conductivity increases abruptly. Finally, we observe a frequency increase of the peak of the 1.2 THz absorption below TN, suggesting that this absorption is also coupling to the magnetic state. This coupling is further evidenced by the increase of spectral weight in the .85 - 1.44 THz region. This absorption is not strong enough to appear isolated as the 350 GHz absorption is, meaning that the same high-temperature analysis will not work as ambiguities in background become significant. Thus, we cannot say if the same softening below 50 K occurs for the 1.2 THz absorption.
III.3 Isosbestic Points
Isosbestic points occur when many curves of a parameter-dependent quantity display the same, or nearly the same, value at a fixed point of an independent variable. They are known to occur in correlated systems where data is taken over at least two different parameters, such as temperature, frequency, or doping. Uchida et al. (1991); Kovaleva et al. (2010); Wang et al. (2016, 2014) For example, as seen in this work, when there is a nearly equal value of for many frequencies at temperature T0 (figure 2d., T0=TJT). These curves can be interpreted and analyzed in a manner similar to a Taylor-expansion around a central curve.Greger et al. (2013) The nearly flat, =1.04 THz curve is found to be a valid central curve. When only the linear term is significant, this expansion takes the form (we refer to the measured as here to emphasize the role of the experimentally taken data which is displayed in figure 2):
| (1) |
where
| (2) |
and refers to the curve for fixed frequency that is a function of temperature, as in figure 2d. We note and can be far removed from the frequency of the central curve, . The exponent of the terms necessary in the expansion reveals the principal parameter dependence of the system, as in \ceLaMnO3 where isosbestic analysis reveals a T2 dependence of electronic excitations in the optical response without a linear-in-T term. Kovaleva et al. (2010); Greger et al. (2013) Therefore this analysis can reveal the fundamental dependence of a physical quantity on measurement variables. For example, the analysis of our data shows that the behavior in is linear in frequency and temperature.
We can obtain a collapse of the curves (again keeping only the linear power) by examining the function:
| (3) |
Assuming that second-order deviations from central behavior are small, the curve for frequency will resemble the curve of the central frequency , . Our convention will be that (as in equation 3) refers to the underlying behavior of the frequency-independent isosbestic point (as seen in figure 2d.), and we define as the underlying behavior of the temperature-independent isosbestic point (as seen in figure 2b.), with the roles of and T exchanged in the analysis:
| (4) |
with
| (5) |
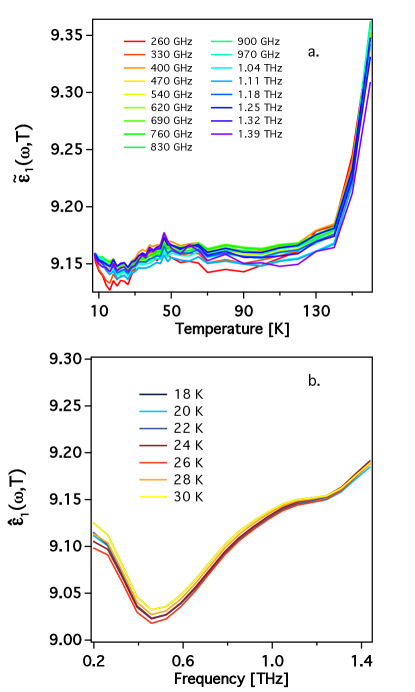
We first calculate for all frequencies. We choose 1.04 THz as the central frequency becuse it is nearly temperature-independent, e.g. figures 2b. (crossing point) and 2d. (nearly flat line). The function is calculated using 0.473 THz and 1.25 THz. We emphasize that this choice is not unique in allowing the collapse of the data (in fact, surprisingly, every available frequency in the available bandwidth can serve as a central curve). We finally subtract away the difference of the low-temperature (7.6 K) value of between each frequency and the isosbestic frequency, 1.04 THz. This allows us to reduce the vertical spread of the curves by a factor of 5 without changing their shape. The results are presented in figure 4a., for first-order subtraction, which provided the best results.
We have thus identified an intrinsic behavior of by removing first-order deviations in frequency around the = 1.04 THz curve. This collapsed behavior is shown to be nearly frequency and temperature-independent, matching the behavior of THz, T) for all curves, as is clear from figure 4a. We thus show that there is an intrinsic behavior that exists at temperatures above and below TN and TJT, which persists even up to high temperature (160 K). This shows that the principal variations of the spectra in frequency are linear around the isosbestic frequency. Since this behavior is observed in , it is not related to conservation of spectral weight (as it would be if an isosbestic point was observed in ). Although this collapse is similar to the scaling associated to a phase transition, it is unclear that this is the physical origin of this behavior; this collapse occurs without regard to the two known phase transitions in this material. At this moment it is unclear what the physical origin of this behavior is.
We find similar behavior in only in temperatures between TN and TJT. Again, removal of the linear term provided the best results as shown in figure 4b. The collapse only occurring between TN and TJT may imply that no new spectral features appear in this temperature range. This supports our view that the 600 GHz absorption only appears below TN. Therefore, we have shown that in the THz range in \ceGeV4S8 has both a temperature-independent frequency, and a frequency-independent temperature, yielding a central isosbestic point at 1.04 THz and 31.5 K. While 31.5 K corresponds to the known phase transition temperature TJT, the significance of the frequency 1.04 THz is not yet understood.
We note that other materials also show isosbestic features in the THz range. \ceGaV4S8, which undergoes similar phase transitions to \ceGeV4S8, shows an isosbestic point just below TJT. However, \ceGaV4S8 does not show a temperature-independent frequency, as our data on \ceGeV4S8 does (figures 2b. & d.). Also displaying a different isosbestic behavior is the iron selenide superconductor \ceRb_1-xFe_2-ySe_2-zS_z, which shows isosbestic points in both and versus temperature but none versus frequency.
IV Conclusions
THz spectroscopy has proved sensitive to the antiferromagnetic and ferroelectric phase transitions in \ceGeV4S8. We have observed three absorptions in our frequency range: two clearly change below the antiferromagnetic transition, providing evidence for spin-phonon coupling, while the third we identify as a magnon as it appears only below the antiferromagnetic transition. We have also observed an isosbestic point in frequency and one in temperature, which occurs at the ferroelectric transition. By removing first-order terms in expansion around these isosbestic points, we are able to uncover underlying behavior in both observed isosbestic points, characterized by the collapse of to a central curve. Further studies on single crystals are needed to resolve a number of outstanding questions raised by our studies.
Work at OSU was supported by the NSF MRSEC Center for Emergent Materials under Grant DMR-1420451. GP and DM were supported by the Gordon and Betty Moore Foundation’s EPiQS Initiative through Grant GBMF4416. Work at the Spallation Neutron Source was supported by the Scientific User Facilities Division, Office of Basic Energy Sciences, U.S. Department of Energy. Evan Jasper, Shirley Li and Thuc T. Mai are thanked for their assistance in this work.
References
- Kézsmárki et al. (2015) I. Kézsmárki, S. Bordács, P. Milde, E. Neuber, L. Eng, J. White, H. M. Rønnow, C. Dewhurst, M. Mochizuki, K. Yanai, et al., Nature Materials 14, 1116 (2015).
- Ruff et al. (2015) E. Ruff, S. Widmann, P. Lunkenheimer, V. Tsurkan, S. Bordács, I. Kézsmárki, and A. Loidl, Science Advances 1, e1500916 (2015).
- Abd-Elmeguid et al. (2004) M. Abd-Elmeguid, B. Ni, D. Khomskii, R. Pocha, D. Johrendt, X. Wang, and K. Syassen, Physical Review Letters 93, 126403 (2004).
- Rastogi et al. (1983) A. Rastogi, A. Berton, J. Chaussy, R. Tournier, M. Potel, R. Chevrel, and M. Sergent, Journal of Low Temperature Physics 52, 539 (1983).
- Rastogi and Wohlfarth (1987) A. Rastogi and E. Wohlfarth, Physica Status Solidi (B) 142, 569 (1987).
- Kim et al. (2014) H. S. Kim, J. Im, M. J. Han, and H. Jin, Nature Communications 5 (2014).
- Müller et al. (2006) H. Müller, W. Kockelmann, and D. Johrendt, Chemistry of Materials 18, 2174 (2006).
- Sahoo and Rastogi (1993) Y. Sahoo and A. Rastogi, Journal of Physics: Condensed Matter 5, 5953 (1993).
- Rastogi and Niazi (1996) A. Rastogi and A. Niazi, Physica B: Condensed Matter 223, 588 (1996).
- Johrendt (1998) D. Johrendt, Z. anorg. allg. Chem. 624, 952 (1998).
- Hlinka et al. (2016) J. Hlinka, F. Borodavka, I. Rafalovskyi, Z. Docekalova, J. Pokorny, I. Gregora, V. Tsurkan, H. Nakamura, F. Mayr, C. Kuntscher, et al., Physical Review B 94, 060104 (2016).
- Pocha et al. (2000) R. Pocha, D. Johrendt, and R. Pöttgen, Chemistry of Materials 12, 2882 (2000).
- Yadav et al. (2008) C. Yadav, A. Nigam, and A. Rastogi, Physica B: Condensed Matter 403, 1474 (2008).
- Chudo et al. (2006) H. Chudo, C. Michioka, H. Nakamura, and K. Yoshimura, Physica B: Condensed Matter 378, 1150 (2006).
- Bichler et al. (2008) D. Bichler, V. Zinth, D. Johrendt, O. Heyer, M. K. Forthaus, T. Lorenz, and M. M. Abd-Elmeguid, Physical Review B 77, 212102 (2008).
- Singh et al. (2014) K. Singh, C. Simon, E. Cannuccia, M.-B. Lepetit, B. Corraze, E. Janod, and L. Cario, Physical Review Letters 113, 137602 (2014).
- Widmann et al. (2016) S. Widmann, A. Günther, E. Ruff, V. Tsurkan, H.-A. Krug von Nidda, P. Lunkenheimer, and A. Loidl, Phys. Rev. B 94, 214421 (2016).
- Cannuccia et al. (2017) E. Cannuccia, V. T. Phuoc, B. Brière, L. Cario, E. Janod, B. Corraze, and M. B. Lepetit, J. Phys. Chem. C 121, 3522 (2017).
- Pimenov et al. (2006) A. Pimenov, A. A. Mukhin, V. Y. Ivanov, V. D. Travkin, A. M. Balbashov, and A. Loidl, Nat Phys 2, 97 (2006).
- Sushkov et al. (2007) A. B. Sushkov, R. Valdés Aguilar, S. Park, S.-W. Cheong, and H. D. Drew, Phys. Rev. Lett. 98, 027202 (2007).
- Mai et al. (2016) T. T. Mai, C. Svoboda, M. T. Warren, T.-H. Jang, J. Brangham, Y. H. Jeong, S.-W. Cheong, and R. Valdés Aguilar, Phys. Rev. B 94, 224416 (2016).
- Sushkov et al. (2005) A. B. Sushkov, O. Tchernyshyov, W. R. II, S. W. Cheong, and H. D. Drew, Phys. Rev. Lett. 94, 137202 (2005).
- Hemberger et al. (2006) J. Hemberger, T. Rudolf, H.-A. Krug von Nidda, F. Mayr, A. Pimenov, V. Tsurkan, and A. Loidl, Phys. Rev. Lett. 97, 087204 (2006).
- Greger et al. (2013) M. Greger, M. Kollar, and D. Vollhardt, Physical Review B 87, 195140 (2013).
- Fattinger and Grischkowsky (1989) C. Fattinger and D. Grischkowsky, Applied Physics Letters 54, 490 (1989).
- Wang et al. (2015) Z. Wang, E. Ruff, M. Schmidt, V. Tsurkan, I. Kézsmárki, P. Lunkenheimer, and A. Loidl, Physical Review Letters 115, 207601 (2015).
- Valdés Aguilar et al. (2006) R. Valdés Aguilar, A. B. Sushkov, S. Park, S.-W. Cheong, and H. D. Drew, Phys. Rev. B 74, 184404 (2006).
- Valdés Aguilar et al. (2008) R. Valdés Aguilar, A. B. Sushkov, Y. J. Choi, S.-W. Cheong, and H. D. Drew, Phys. Rev. B 77, 092412 (2008).
- Valdés Aguilar et al. (2007) R. Valdés Aguilar, A. B. Sushkov, C. L. Zhang, Y. J. Choi, S.-W. Cheong, and H. D. Drew, Phys. Rev. B 76, 060404 (2007).
- Reschke et al. (2017) S. Reschke, Z. Wang, F. Mayr, E. Ruff, P. Lunkenheimer, V. Tsurkan, and A. Loidl, arXiv preprint arXiv:1705.07055 (2017).
- Uchida et al. (1991) S. Uchida, T. Ido, H. Takagi, T. Arima, Y. Tokura, and S. Tajima, Physical Review B 43, 7942 (1991).
- Kovaleva et al. (2010) N. N. Kovaleva, A. M. Oleś, A. M. Balbashov, A. Maljuk, D. N. Argyriou, G. Khaliullin, and B. Keimer, Physical Review B 81, 235130 (2010).
- Wang et al. (2016) Z. Wang, V. Tsurkan, M. Schmidt, A. Loidl, and J. Deisenhofer, Physical Review B 93, 104522 (2016).
- Wang et al. (2014) Z. Wang, M. Schmidt, J. Fischer, V. Tsurkan, M. Greger, D. Vollhardt, A. Loidl, and J. Deisenhofer, Nature Communications 5 (2014).