Rearrangement of Van-der-Waals Stacking and Formation of a Singlet State at T = 90 K in a Cluster Magnet
John P. Sheckelton,a,b Kemp W. Plumb,b Benjamin A. Trump,a,b Collin L. Broholm,b,c,d and Tyrel M. McQueena,b,c,∗
-
Insulating Nb3Cl8 is a layered chloride consisting of two-dimensional triangular layers of Seff = 1/2 Nb3Cl13 clusters at room temperature. Magnetic susceptibility measurement show a sharp, hysteretic drop to a temperature independent value below T = 90 K. Specific heat measurements show that the transition is first order, with , and a low temperature T-linear contribution originating from defect spins. Neutron and X-ray diffraction show a lowering of symmetry from trigonal Pm to monoclinic C2/m symmetry, with a change in layer stacking from -AB-AB- to -AB′-BC′-CA′- and no observed magnetic order. This lowering of symmetry and rearrangement of successive layers evades geometric magnetic frustration to form a singlet ground state. It is the lowest temperature at which a change in stacking sequence is known to occur in a Van-der-Waals solid, occurs in the absence of orbital degeneracies, and suggests that designer 2-D heterostructures may be able to undergo similar phase transitions.
1 Introduction
Emergent phenomena among strongly interacting atoms or electrons, such as superconductivity1, 2, 3, charge density waves4, topological insulators5, 6, Kondo insulators7, 8, and heavy fermions9, are at the forefront of contemporary materials research. Geometrically frustrated magnets are a particularly illustrative class of strongly interacting systems where a large degeneracy of electronic states exist within a small energy regime compared to the magnetic interaction strength. Since the electronic degeneracy arises from lattice symmetry, geometrical frustration can destabilize the lattice. Here we show that a geometrically frustrated antiferromagnet built from small transition metal clusters10, 11, 12, 13, 14, 15 can succumb to a symmetry-lowering distortion to evade a degenerate magnetic ground state, even in the absence of orbital degeneracies. This phase change also involves a change in stacking sequence between successive charge-neutral Van-der-Waals (VdW) bonded layers.
Specifically, we report the discovery of a paramagnetic and trigonal to singlet and monoclinic phase transition in the cluster-based magnet Nb3Cl8, despite each Nb3Cl13 cluster harboring a singly occupied, non-degenerate highest occupied molecular orbital (HOMO) and an approximately 1 eV gap to degenerate lowest unoccupied molecular orbital (LUMO) states. As for Mo3O13 clusters in LiZn2Mo3O8 10, a formal electron count yields one Seff = 1/2 magnetic electron per Nb3Cl13 cluster, which are arranged on a two-dimensional triangular lattice. Nb3Cl8 and various stacking variations16, 17, 18, 19, 20 have been previously studied. The -Nb3Cl8 polymorph, with -AB-AB- stacking, is known to undergo a hysteretic magnetic transition21 with a change in the magnetic signal at temperatures below T 90 K. Here, this transition is studied via detailed structural and physical property investigations of both powder and single crystals, revealing a dramatic trigonal to monoclinic phase transition at T = 90 K that quenches the magnetic response but without magnetic order, i.e. a singlet state. The relief of geometric frustration via orbital ordering and formation of magnetic order or spin singlets, is well-known in compounds containing first-order Jahn-Teller (FOJT) active ions or clusters, such as NaTiO222, 23, NaVO224, or GaNb4S8 25. A similar spin-Peierls distortion in 1D Seff = 1/2 systems, such as CuGeO326, NaTiSi2O627, and the titanium oxychlorides/oxybromides28, 29, can also be explained in terms of orbital ordering 30.
The phase transition to evade geometric magnetic frustration in Nb3Cl8 appears to proceed via a different route. The structural phase transition breaks the symmetry of the Nb3Cl13 clusters in a manner consistent with a second-order Jahn-Teller (SOJT) distortion, but with a dramatic change in Nb3Cl8 layer stacking from -AB-AB- to -AB′-BC′-CA′-. That such a change in stacking of a VdW material can occur near liquid nitrogen temperature is remarkable, but can be thought of as being driven by a buckling of interfacial Cl-atom layers due to an inter-layer electronic interaction and SOJT distortion combined with singlet formation. Our results demonstrate the importance of considering multi-site effects and states far from the HOMO in magnetically frustrated materials, and that changes in VdW stacking sequence are possible well below room temperature.
2 Methods
Single crystalline Nb3Cl8 was synthesized by self vapor transport in an evacuated quartz tube charged with a stoichiometric amount of twice re-sublimed NbCl5 (Strem, 99.99%) and powder Nb metal, used as is (Alfa, 99.99%). A temperature gradient of T = 825C to T = 835C was maintained over the reaction vessel for 12 to 14 days before cooling to room temperature. All samples were handled in a glovebox using standard air-free techniques. High-resolution synchrotron X-ray diffraction measurements (SXRD) were taken on powder samples of ground single crystals at temperatures from T = 300 K to T 90 K using the powder diffractometer at beamline 11-BM equipped with a liquid nitrogen cryostream at the Advanced Photon Source (APS). Triple-axis Neutron diffraction measurements of co-aligned Nb3Cl8 single crystals were acquired from T = 300 K to T = 1.6 K on the SPINS spectrometer at the NIST Center for Neutron Research (NCNR). SPINS was operated with a fixed energy of 5 meV, flat analyzer, and a 58Ni guide - 80’ - 40’ - open collimation sequence. Measurements were performed with the Nb3Cl8 single crystal array oriented in both the () or () scattering planes of the high temperature structure. Low-temperature powder X-ray diffraction (PXRD) patterns were acquired from T = 300 K to T = 12 K using a Bruker D8 Advance powder diffractometer with Cu radiation ( Å), a scintillator point detector with 0.6 mm slits, and an Oxford Cryosystems PheniX low-temperature closed cycle cryostat. Powder neutron diffraction at T = 300 K and T = 10 K was performed at the POWGEN diffractometer, Spallation Neutron Source, Oak Ridge National Laboratory (ORNL). Scans were measured for 4 hours each on a 0.2 g sample of crushed Nb3Cl8 single crystals. Rietveld refinements to synchrotron and in-house X-ray diffraction data were performed using the General Structure Analysis System (GSAS)31 and the commercial Bruker Topas software suite. Refinement to the low-temperature powder neutron diffraction data was performed using the program FAULTS32 software package to account for random HT-phase stacking faults (-AB-AB-) in the LT phase. Angle dependent magnetic susceptibility measurements on single crystalline Nb3Cl8 were performed on a Quantum Design Physical Properties Measurement System (PPMS) from T = 300 K to T = 2 K under an applied field of = 5 T, after first measuring the sample holder temperature dependent background, which was subsequently subtracted from the data. Specific heat capacity measurements were taken on a PPMS from T = 300 K to T = 2 K using the semi-adiabatic pulse technique and dual slope analysis method. For sensitivity to latent heat, measurements around T 90 K were performed using a single large heat pulse from T = 85 K to T = 110 K, and analyzed via the multi-point single slope method33. Resistivity measurements were taken using the four-probe method in the PPMS by attaching Pt wire to single crystalline Nb3Cl8 using DuPont 4922N silver composition paint. The sample was measured from T = 300 K to T 275 K where the resistivity exceeded the instrument threshold due to a voltmeter impedance of M. Band structure calculations were performed on the high- and low-temperature phases of Nb3Cl8. Convergence was achieved with a and -point mesh for the high- and low-temperature phases respectively, using the ELK all-electron full-potential linearized augmented-plane wave (FP-LAPW) code using the Perdew-Wang/Ceperley-Alder LSDA functional34.
3 Results
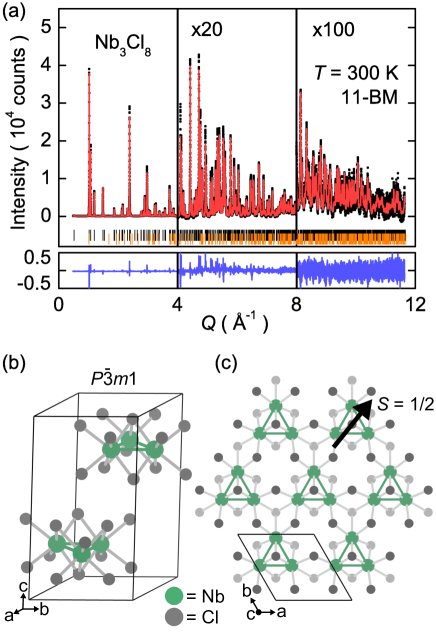
Results of Rietveld refinements to powder SXRD data at T = 300 K of the high-temperature (HT) Pm phase are shown in Fig. 1. The HT phase unit cell [Fig. 1 (b)] consists of two Nb3Cl13 clusters per unit cell in a -AB-AB- bilayer stacking order where A and B refer to independent Nb3Cl8 layers and AB constitutes a single bilayer, since adjacent Nb3Cl8 layers are inequivalent due to alternating directions of the Nb3 capping Cl atoms. No atoms occupy the two inequivalent spaces between Nb3Cl8 layers, leaving only Van-der-Waals (VdW) interactions between interfacial Cl layers as the net attractive force. Rietveld refinement to powder synchrotron diffraction data [Fig. 1 (a)] show low-Q diffraction peaks that are asymmetric and not fit well (broad calculated peaks) due to a combination of instrumental low angle peak asymmetry and significant stacking faults. The excellent overall quality of the fit is highlighted by the zoomed regions. To assess whether or not a more subtle distortion is present at high temperatures, fits to space groups with symmetry elements systematically removed (P, P3m, P3, and C2/m) do not improve the fit, either statistically or qualitatively. The low temperature synchrotron data near T 90 K show no indication of a symmetry-lowering structural distortion (see ESI†). These results from the HT phase are in agreement with the structure previously inferred from single crystal X-ray diffraction35, 19.
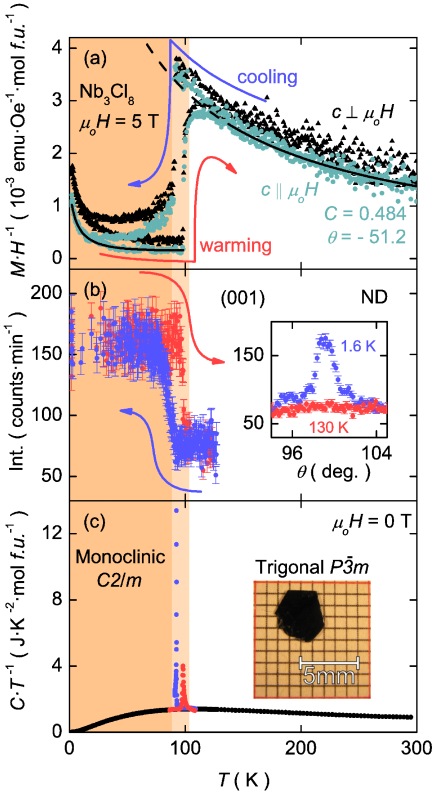
The temperature dependent magnetic susceptibility of single crystalline Nb3Cl8 upon cooling and warming is shown in Fig. 2 (a) for fields parallel and perpendicular to the crystallographic axis. Whereas previous reports show that Nb3Cl8 has hysteretic magnetization with a clear transition around T 90 K 21, we find the susceptibility effectively vanishes for K upon cooling. Hysteresis is observed, in that upon warming from the low-temperature (LT) phase to the HT phase, this transition occurs at a higher temperature than upon cooling. An analysis of the inverse susceptibility data for K yields a Curie constant (, consistent with Seff = 1/2) and a Weiss temperature of K. The fit is shown as a solid black line in Fig. 2 (a), for and is continued as a dashed line at lower temperatures. The values vary less than between the two crystal directions, indicating any HT anisotropy is small. The upturns observed below T 30 K account for of the high-temperature spins, consistent with a small number of impurity spins or edge states. The fit shown below T 90 K in Fig. 2 (a) is to a Curie-Weiss law, where and K.
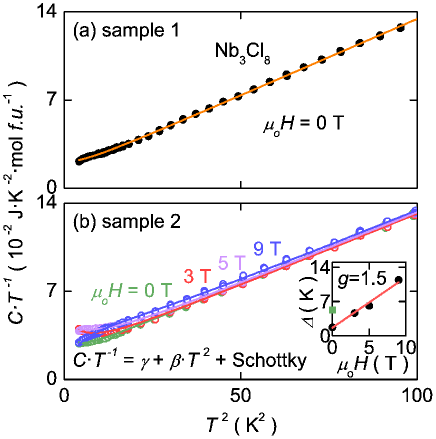
Fig. 2 (b) shows the results of neutron diffraction rocking scans of the Nb3Cl8 (001) reflection. Compared to the HT phase, the LT phase has a significant increase in the intensity of the (001) reflection, which tracks the transition between the LT and HT phases, with consistent hysteresis.
Heat capacity measurements on Nb3Cl8 are shown in Fig. 2 (c). The cooling (blue) and warming (red) transitions are consistent with the susceptibility and diffraction data. The amount of entropy associated with the transitions is obtained from assuming , after a smooth curve to account for the background is subtracted. This results in an entropy change , which is of the full entropy change of a two level system, . This may suggest the bulk has a singlet ground state with a gap to the first excited state.
An analysis of the low temperature versus data (Fig. 3), however, reveals a significant linear contribution to the specific heat, indicative of metallic behavior, despite Nb3Cl8 being an insulator at all accessible temperatures. Measurements on two separate single crystal pieces yield two different linear contributions, for samples 1 and 2 respectively [Fig. 3 (a) and (b)]. The observation of varying values of the T-linear contribution to the specific heat suggests its origin is not intrinsic but rather due to defects that also give rise to the Curie tail in low temperature susceptibility data [Fig. 2 (a)]. To quantify this argument, the () data were fit to an equation accounting for the intrinsic sample behavior with a Schottky anomaly term for the low temperature impurity spins, , where is the -linear contribution, is the lattice contribution, is the ideal gas constant, and is the Schottky anomaly gap. A single value of and a single scale factor for the low temperature Schottky anomaly was used for all fields of sample 2 [Fig. 3 (b)]. The field dependence of the Schottky anomaly gap is shown in the inset to Fig. 3 (b), which is used to extract a -factor of for the impurity spins contributing to the anomaly. We thus reason the -linear specific heat of Nb3Cl8 may originate from a distribution of broken singlets (giving rise to defect spins) that interact through the majority phase as in Ba3CuSb2O9 36 and Sr2CuO337.
| Atom | Wyck. site | x | y | z |
|---|---|---|---|---|
| Nb-1 | 4i | 0.9734(10) | 1/2 | 0.2470(10) |
| Nb-2 | 8j | 0.1558(10) | 0.2980(10) | 0.2550(10) |
| Cl-1 | 4i | 0.7046(10) | 0 | 0.1231(10) |
| Cl-2 | 4i | 0.2157(10) | 0 | 0.1473(10) |
| Cl-3 | 4i | 0.1271(10) | 1/2 | 0.4013(10) |
| Cl-4 | 4i | 0.1239(10) | 0 | 0.3656(10) |
| Cl-5 | 8j | 0.9595(10) | -0.2490(10) | 0.1209(10) |
| Cl-6 | 8j | 0.3725(10) | 0.2606(10) | 0.3622(10) |
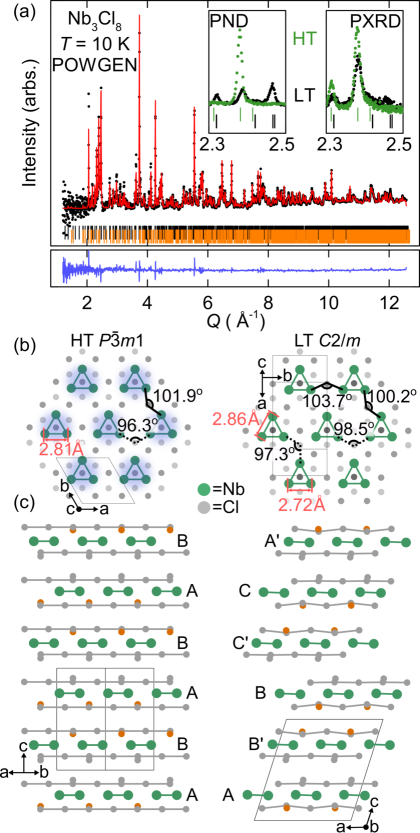
Low temperature powder X-ray and neutron diffraction was used to determine the LT structure. The LT phase has a characteristic pattern of peak splitting, indicating a structural distortion to a C2/m phase. Rietveld refinement to neutron diffraction data at T = 10 K, shown in Fig. 4 (a), indicates a 16% remnant, random HT phase stacking pattern in the LT structure. The resulting structure is summarized in Table 1 and change in symmetry unique octahedral Nb-Cl bond lengths in Table 2. Considerable stacking faults and the remnant HT phase stacking present in the LT phase warranted use of FAULTS32 to model the LT structure with all thermal parameters restrained to be equal to minimize refinable parameters and yield the most statistically significant model. The primary effect of the phase transition on the Nb3Cl13 clusters is shown in Fig. 4 (b) and (c). The discrete Nb3Cl13 clusters ( Å intra- and Å inter-cluster Nb-Nb bond distances) in the HT phase [Fig. 4 (b)] are characterized by “molecular” point group symmetry and a Seff = 1/2 magnetic electron equally distributed over the entire cluster (blue shading). The clusters form a triangular lattice that are stacked in a -AB-AB- sequence. The transition to the LT phase [Fig. 4 (b) and (c)] results in removal of the threefold rotational symmetry of the HT clusters, so that only a C2/m - mirror plane remains. The result is a scissoring of the clusters, whereby the HT phase equilateral Nb3 triangular cluster becomes isosceles, resulting in one decreased (2.72 Å) and two increased (2.86 Å) Nb-Nb bond lengths and two inequivalent NbCl6 octahedra, consistent with the SOJT effect. The transition modulates inter-cluster Nb-Cl-Nb superexchange pathways by decreasing and increasing these bond angles [Fig. 4 (b)] resulting in a pseudo-one-dimensional state. Further, accompanying the phase transition are changes to the nearest-neighbor (NN) inter- and intra-cluster distances, here defined as the distance between the geometric centroid of Nb3 cluster triangles. While the intra-layer cluster distances are shorter and change from a single NN distance of 6.7457 Å (HT) to 6.7294 Å and 6.7261 Å (LT)—suggestive of 1D chains—the change in NN inter-layer distance is greater, from 7.3585 Å (HT) to 7.1887 Å (LT), consistent with inter-layer singlet formation. The cluster scissoring has a pronounced effect on the interlayer stacking arrangement. In the HT phase, Cl atoms at bilayer edges are flat triangular layers, resulting in a simple closest packing of chlorines from the top of one bilayer with the bottom of the next and thus, a -AB-AB- arrangement. In the LT phase, the scissoring motion results in a buckling of the chlorine layers as highlighted in Fig. 4 (c), where crystallographically equivalent orange Cl atoms emphasize the Cl-layer crimping distortion—the lowest interfacial energy between these now staggered layers requires a shift in stacking to a -AB′-BC′-CA′- pattern. Here, A/A′, B/B′, etc is used to relate the LT structure to the former HT (AB-designated) layers. The resultant shift in inter- and intra-layer structure, however, is not concomitant with long-range magnetic order. The observation of a structural distortion by powder X-ray diffraction suggests the increased intensity of (001) neutron Bragg diffraction [Fig. 2 (b)] has a structural—not magnetic—origin. Changes in the measured single crystal neutron diffraction data are consistent solely with nuclear diffraction associated with the Pm to C2/m phase transition.
| HT (Pm) | LT (C2/m) | ||
|---|---|---|---|
| Nb-ClA | 2.437(2) | NbA-ClA1 | 2.483(13) |
| NbB-ClA2 | 2.423(13) | ||
| Nb-ClB | 2 2.530(1) | NbA-ClB1 | 2 2.552(11) |
| NbB-ClB2 | 2.548(10) | ||
| NbB-ClB3 | 2.497(13) | ||
| Nb-ClC | 2 2.464(1) | NbA-ClC1 | 2 2.407(12) |
| NbB-ClC2 | 2.435(12) | ||
| NbB-ClC3 | 2.371(12) | ||
| Nb-ClD | 2.640(1) | NbA-ClD1 | 2.513(13) |
| NbB-ClD2 | 2.646(10) | ||
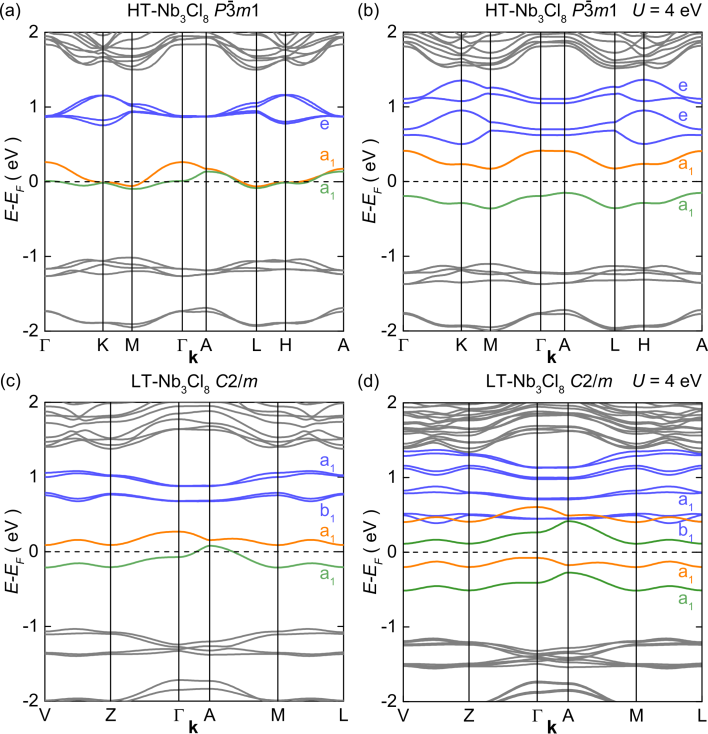
Density functional theory (DFT) band structure calculations for Nb3Cl8, shown in Fig. 5, were used to gain insight into the nature of the magneto-structural transition. In agreement with previous calculations for discrete Nb3Cl13 clusters18, the HT Nb3Cl8 band structure confirms the highest occupied molecular orbital (HOMO) of each cluster is a non-degenerate orbital that is far in energy from the excited state orbitals and therefore, not conventionally (i.e. to first-order) Jahn-Teller active. The bands corresponding to each Nb3Cl13 cluster HOMO [green and orange band, one from each of two clusters per unit cell, Fig. 5 (a)] are split at the -point from orbital overlap between the magnetic electrons in adjacent clusters resulting in the formation of a bonding/anti-bonding pair of states. The band structure calculation of the LT phase, Fig. 5 (c), shows shifted bands with respect to the HT phase. Notably, the HT bonding/antibonding states [from Fig. 5 (a)] have an increased gap and the degenerate states have been raised and lowered in energy (i.e. orbital degeneracy was broken) upon entering the LT phase. Breaking the degeneracy of the first excited states upon entering in the LT phase is consistent with a second-order Jahn-Teller distortion from orbital mixing. The calculations in Fig. 5 (a) and (c) have no spin-polarization (SP), spin-orbit coupling (SOC), or electronic interaction via a Hubbard . Under these conditions, HT Nb3Cl8 is clearly predicted to have a finite density of states at the Fermi level and thus be metallic, inconsistent with resistivity measurements. This demonstrates the importance of correlations in producing the observed behavior of this compound. Intriguingly, we find that solely SOC or solely a Hubbard (onsite electron-electron interaction), are not sufficient to produce an insulator in the HT phase (see ESI†). Including both SOC and simultaneously, Fig. 5 (b), is sufficient to produce an insulator. In this calculation, Nb moments were assumed to align with the crystallographic axis, and be oriented antiferromagnetically between layers with a total moment of per cluster in the HT phase. Given the limitations of DFT in describing correlated materials, this semi-quantitative agreement is reasonable. In contrast, LT Nb3Cl8 is almost predicted to be insulating by DFT, even in the absence of SOC and a Hubbard , Fig. 5 (c). This demonstrates the importance of changes in interlayer interactions, as the splitting of the HT bands induces the SOJT effect, driving this material toward an insulating state [of course inclusion of SOC and increase the insulating gap, Fig. 5 (d)].
4 Discussion
The data demonstrate a first-order phase transition from a triangular lattice paramagnet with antiferromagnetic correlations to a non-magnetic state. The transition temperature T 90 K is higher than the Weiss temperature (), a measure of the magnetic interaction strength. Typically a material, absent of any magnetic frustration effects, will form a magnetically long-range ordered state with , with the kind of ordering (ferro- or antiferromagnetic) dependent on the sign of the Weiss temperature. In Nb3Cl8, the onset of the SOJT effect well above the temperature at which in-plane magnetic correlations become strong suggests an inherent instability of the system. The effects of magnetic frustration observed in another triangular lattice cluster-magnet based material, LiZn2Mo3O8 10, 11, 12, 15, is proposed to result from itinerant, plaquette charge order14 that does not form a long-range ordered state. In LiZn2Mo3O8, as opposed to Nb3Cl8, stability of the frustrated magnetic state can be due to the non-magnetic Li/Zn ions suppressing inter-layer magnetic interactions predicted by band structure calculations (Fig. 5). In addition, previous reports suggest the Nb-Cl bonding within Nb3Cl13 clusters has strong ionic character17 as opposed to highly covalent bonding, which might give insight into the lack of stability of the frustrated magnetic state—the ionic character of the cluster bonds is more susceptible to a SOJT effect and subsequent structural distortion due to the low energy barrier to overcome.
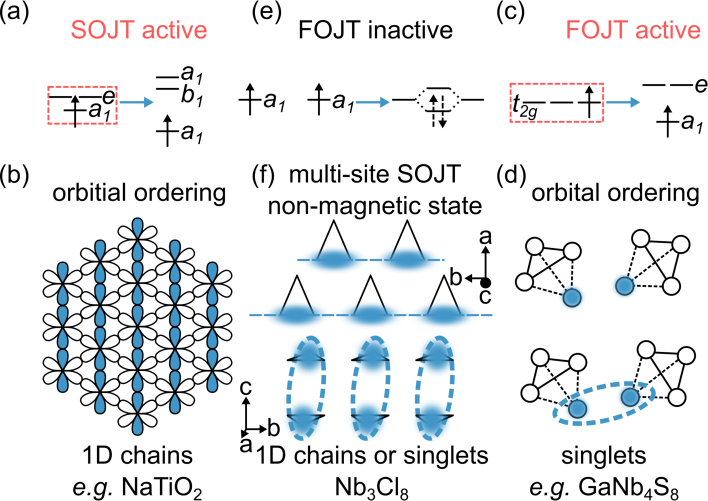
We compare the peculiar structural distortion observed in Nb3Cl8 with other anomalous magnetism in materials and 2D VdW structures. It has been suggested that the observed properties of the triangular lattice antiferromagnet NaTiO222 can be explained by a one-dimensional-like behavior38, 39 arising from a symmetry lowering structural distortion, where energetically similar orbitals are thermally populated at high temperatures, Fig. 6 (a). Upon cooling, a distortion relieves the frustration by orbital ordering of the Ti3+ cations to form 1D chains, Fig. 6 (b). Analogous behavior is observed in other compounds with single ions as the basic magnetic unit, including NaVO224 and LiVO240. A similar phenomenology is found in cluster-based Lacunar spinels such as GaNb4S8 41. There, a first-order Jahn-Teller distortion due to a single electron in a triply degenerate orbital set, Fig. 6 (c), results in the localization of the unpaired electron on a single Nb atom in the Nb4S4 cores, Fig. 6 (d). This ordering is concomitant with a drop in magnetism, thought to result from the formation of spin-singlets between two clusters42 via interaction of adjacent-cluster Nb atoms [Fig 6 (d)]. Singlet formation born from orbital ordering is also seen in other potentially frustrated systems such as Ba3CuSb2O9 43 and Ba3CoSb2O9 44. In all of these cases, the orbital degree of freedom plays a crucial role in driving the structural distortion that relieves magnetic frustration and results in either magnetic order or a singlet state.
Nb3Cl8 exhibits similar physics despite the absence of an orbital degeneracy (i.e. first-order Jahn-Teller instability) or significant thermal population of the first excited state. The results of band structure calculations on LT-Nb3Cl8 [Fig. 5 (c)] indicate second-order Jahn-Teller (SOJT) like orbital mixing, since upon entering the LT state, HT degenerate bands [blue bands, Fig. 5 (a)] break their degeneracy and a scissoring of the Nb3 triangles is expected from the SOJT effect. This is surprising given the eV energy gap to the degenerate states in the HT band structure, which are expected to have little-to-no thermal population at T 90 K. The HT band structure calculation predicts an electronic interaction by orbital overlap between magnetic electrons in adjacent Nb3Cl8 layers—yielding effective bonding/antibonding states—possibly inducing the SOJT effect and is suggestive of an inter-layer singlet ground state in the LT phase. Such a singlet ground state would be highly unusual given the large distance between Nb ions in adjacent layers, although magnetic exchange interactions are possible on such length scales, as in -RuCl345, 46, 47, which harbors an out of plane magnetic interaction and similar stacking faults as LT Nb3Cl8. Alternatively, the concurrent change in intra-layer, inter-cluster Nb-Cl-Nb bond angles upon entering the LT phase could result in a intra-layer Seff = 1/2 1D chain singlet state. While at present, the LT magnetic ground state cannot be unambiguously determined, singlets that lie in between adjacent layers or a intra-layer Seff = 1/2 1D chain appear to be the most likely candidates. Indeed, while no in-plane dimerization is observed, dimerization via electronic interaction in the -direction exists even in the HT phase.
The DFT calculations affirm the HOMO in each HT Nb3Cl13 cluster are non-degenerate (), so the transition in Nb3Cl8 cannot be ascribed solely to single-site orbital ordering. Related phenomena are observed in two-dimensional organic salts where charge ordering is the cause of the metal-insulator transition as in -(BEDT-TTF)2RbZn(SCN)448. The observation of a dielectric response in the geometrically frustrated dimer Mott insulator -(BEDT-TTF)2Cu2(CN)249 suggests charge order plays a role in the putative spin liquid state. Devoid of a screw-axis, the HT Pm space group is symmorphic, and therefore the formation of a gapped, trivial magnetic ground state is allowed without a structural distortion in Nb3Cl8 50, 51. Instead, the observation of the SOJT effect and subsequent non-magnetic ground state in the presence of non-degenerate HOMO bands and unpopulated degenerate bands reveals that the electronic interaction [Fig. 6 (e)] due to orbital overlap plays a crucial role in the avoidance of a magnetically frustrated, classically degenerate ground state. Estimates of the change in entropy and enthalpy from the specific heat measurements in Fig. 2 (c) suggest the first-order transition is entropically driven, by the enhanced spin entropy of the frustrated magnetic HT phase over that of a supposed spin singlet LT phase. The apparent lack of long-range magnetic order in LT-Nb3Cl8 is a natural consequence of the two likely magnetic ground state scenarios—formation of a spin-ladder network of inter-layer singlets or intra-layer 1D chains, illustrated in Fig. 6 (f). The first-order nature of the transition prevents estimation of the low temperature magnetic exchange interactions (e.g. the magnitude of the spin gap) based on the HT phase properties. The deeply suppressed magnetic response in the LT phase implies a gap in the LT state, K (see ESI†), that is significantly larger than the HT Weiss temperature, but not inconsistent with the meV splitting of the orbitals at the -point in the DFT calculations. Further spectroscopic investigations, such as inelastic neutron scattering, are required to elucidate the exact nature of the LT magnetic ground state.
Lastly, the discovery of extraordinary physical properties of graphene52, 53 and other 2D VdW materials—such as transition metal dichalcogenides54, 55, 56, 57—has prompted materials scientists to feverishly search for new systems with properties suitable to, e.g., fabricate technologically useful devices. Like Nb3Cl8, these materials are (strongly) covalently bonded in two dimensions while adhesion in the third dimension is controlled by comparatively weak VdW forces. This weak bonding in one dimension allows for unparalleled control over heterostructure fabrication possibilities due to the facile nature by which differing interlayers can be combined58, 59 to create nano-scale electronic devices such as precisely tunable transistors60, 61 or LEDs62. Nb3Cl8 is a rare example of a material, despite its absence of “molecular” (Nb3Cl13) HOMO degeneracy and energetically isolated HOMO bands, that undergoes a rearrangement of layer stacking at low temperature due to inter-layer magnetic interactions. Our insight gained into the SOJT-like effect in Nb3Cl8, which drives the puckering of interfacial VdW Cl layers and forces the shift in stacking arrangement, opens up possibilities for low-temperature device applications where controllable structural changes are desired. The ability for interactions in the VdW-layer-direction to control crystal structure can be combined with other 2D VdW layers to create novel devices.
5 Conclusions
In short, Nb3Cl8 highlights the interplay between charge, orbital, and spin degrees of freedom and the approach to a non-entropic state as . While the space group symmetry does not preclude a singlet ground state in the symmorphic high temperature structure with two valence electrons63, 64, such a state is apparently not energetically favorable. At low temperature, on the other hand, the strongly reduced susceptibility and inter-layer HOMO overlap suggested by DFT point to a singlet ground state of the valence bond crystal variety. While the structural transition must be energetically favorable for low- magnetism, the second-order Jahn-Teller driven structural rearrangement must be costly. The transition is thus analogous to a spin-Peierls transition where an energetically unfavorable structural dimerization is induced to lift spin degeneracy. For Nb3Cl8, a preference to avoid frustrated triangular lattice antiferromagnetism may even drive covalent bonding. Unheard of in conventional local moment magnetism, this scenario may not be uncommon for 4 or 5 magnetic materials, and has recently been proposed as an explanation for the behavior of Li2RuO3 and related iridium-based materials65. More generally, that such a change in stacking of a Van-der-Waals material can occur near liquid nitrogen temperature is remarkable, and implies that designer 2-D heterostructures may be engineered to undergo similar phase transitions for a variety of potential applications. Akin to the wide breadth of physical phenomena discovered in graphene, the Van-der-Waals layered structure of Nb3Cl8 may also yield novel physics as the first mono-layer geometrically frustrated magnet.
6 Acknowledgements
This research was supported by the US Department of Energy, Office of Basic Energy Sciences, Division of Materials Sciences and Engineering under Award DE-FG02-08ER46544 to The Institute for Quantum Matter at JHU. Use of the Advanced Photon Source at Argonne National Laboratory was supported by the U. S. Department of Energy, Office of Science, Office of Basic Energy Sciences, under Contract No. DE-AC02-06CH11357. Utilization of the mail-in program at POWGEN, Spallation Neutron Source, ORNL was sponsored by the Scientific User Facilities Division, Office of Basic Energy Sciences, U.S. Department of Energy. TMM acknowledges support from the David and Lucile Packard Foundation and the Sloan Research Fellowship. The authors would like to thank O. Tchernyshyov and A. Turner for useful discussions, L. Harriger for his support on the SPINS spectrometer, and S. Lapidus for his support on beamline 11-BM.
Supplementary Information:
Rearrangement of Van-der-Waals Stacking and Formation of a Singlet State at T = 90 K in a Cluster Magnet
John P. Sheckelton,a,b Kemp W. Plumb,b Benjamin A. Trump,a,b Collin L. Broholm,b,c,d
and Tyrel M. McQueena,b,c,∗
S1 Synchrotron powder diffraction analysis
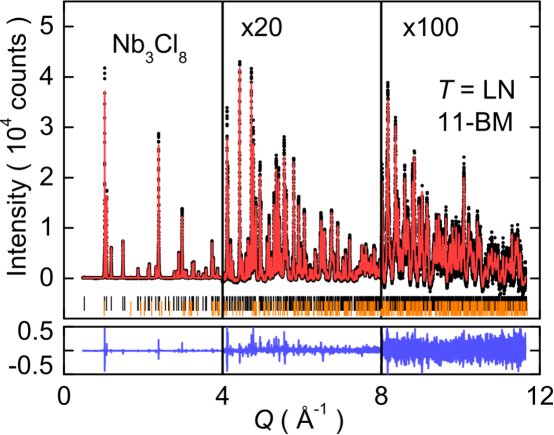
Table S1 is a summary of Rietveld refinement parameters to T = 300 K synchrotron X-ray powder diffraction data shown in main text Fig. 1(a). Low temperature synchrotron X-ray powder diffraction data near liquid nitrogen temperatures shows no signs of symmetry lowering distortions despite a temperature reading of approximately 80 K near the sample. Rietveld refinement of the HT (Pm) structure to the data near liquid nitrogen temperatures is shown in Fig. S1 and is summarized in Table S2. 80 K is far below the first-order phase transition in Nb3Cl8 ( K)—the absence of any Nb3Cl8 LT phase, therefore, is attributed to sample heating from the 30 KeV ( Å) incident X-ray beam. As is the case with the T = 300 K data, fitting the low temperature data to lower symmetry models (P, P3m, P3, and C2/m) results in no improvement of the fit, either quantitatively or qualitatively.
| Atom | Wyckoff position | x | y | z | Uiso(Å2) |
|---|---|---|---|---|---|
| Nb | 6i | 0.52763(2) | 0.05525(5) | 0.24577(5) | 0.00473(6) |
| Cl-1 | 2d | 2/3 | 1/3 | 0.0978(2) | 0.0045(4) |
| Cl-2 | 2d | 1/3 | 2/3 | 0.3555(2) | 0.0085(5) |
| Cl-3 | 6i | 0.6696(2) | -0.1652(1) | 0.1350(1) | 0.0069(3) |
| Cl-4 | 6i | 0.3374(2) | 0.1687(1) | 0.3835(1) | 0.0103(3) |
| Atom | Wyckoff position | x | y | z | Uiso(Å2) |
|---|---|---|---|---|---|
| Nb | 6i | 0.52746(2) | 0.05493(4) | 0.24622(4) | 0.00182(4) |
| Cl-1 | 2d | 2/3 | 1/3 | 0.0981(2) | 0.0024(3) |
| Cl-2 | 2d | 1/3 | 2/3 | 0.3560(1) | 0.0041(3) |
| Cl-3 | 6i | 0.6709(1) | -0.16456(6) | 0.13528(7) | 0.0023(2) |
| Cl-4 | 6i | 0.3359(1) | 0.16793(6) | 0.38192(8) | 0.0051(2) |
S2 DFT band structure calculations
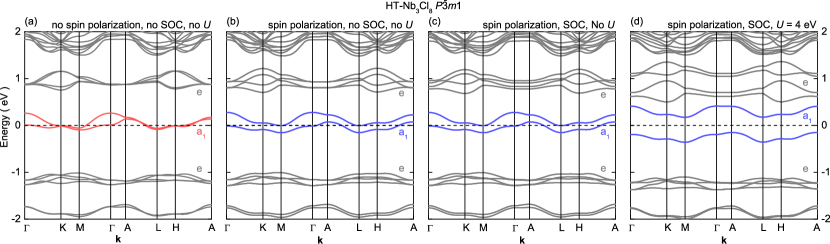
Calculations on the high temperature (HT) structure of Nb3Cl8 were performed without spin-polarization [Fig. S2 (a)], with spin-polarization [Fig. S2 (b)], with spin-orbit coupling [Fig. S2 (c)], and with a Hubbard term [Fig. S2 (d)], all of which display the same qualitative highest occupied molecular orbital (HOMO) splitting at the point as in Fig. S2 (a). The calculations in Fig. S2 (b)-(d) have an additional splitting of the HOMO bands over the entire Brillouin zone originating from the formation of antiferromagnetic order between ferromagnetic planes. The onset of antiferromagnetic order in Fig. S2 (b)-(d) stems from the initial application of a magnetic field to split spin degeneracy despite a reduction of the applied field with subsequent calculation iterations and a convergence with no applied field. The application of a Hubbard , Fig. S2 (d), is required to fully open the gap and predict insulating behavior. The splitting observed in the derived bands in these calculations is allowed due to the unit cell symmetry and there being an even number of electrons per unit cell 63. The large cluster interaction energy indicated by the width of the band ( meV) clearly plays a key role in the collective transition from a triangular lattice Seff = 1/2 antiferromagnet to a system of static singlets.
The special points of the Brillouin zone used in the HT phase calculations are for a trigonal unit cell in the hexagonal setting and are , , , , , and . The special points of the Brillouin zone for a monoclinic unit cell in the C2/m space group with unique axis , cell choice 1 used in the LT calculations are .
S3 Spin-Peierls analysis

The transition into a spin-Peierls (SP) state is marked by an exponential decay of the magnetic susceptibility as a function of temperature 66. The SP transition temperature depends on the magnetic interaction strength and the spin excitation gap in the SP state. Nb3Cl8 does not have an exponential decay into the low-temperature (LT) state—the first-order nature of the transition results in remnant domains of the HT phase upon cooling. Instead, a plot of magnetic susceptibility collected upon warming, Fig. S3, of the = data [reproduced from main text Fig. 2 (a)] must be used in modeling the behavior of the bulk LT state. As can be seen in Fig. S3, the susceptibility data is flat in temperature (with the exception of the Curie tail in K) up to the transition at T 100 K. To test that the magnetic susceptibility from a SP state () is varying minimally with temperature, a Curie-Weiss fit to the LT data up to T = 50 K and T = 100 K was performed to extract a value of for the two temperature regions, a deconvolution of the Curie tail contribution. Values of and are extracted for fits up to T = 100 K and T = 50 K respectively.
The magnetic behavior of a SP state can be approximated by the exponential 67
where is the molar susceptibility, is the Curie constant, is the gap to the first excited state, is Boltzmann’s constant, and is the temperature independent contribution to the susceptibility. It is important to note that the transition temperature between HT and LT states in Nb3Cl8 is not necessarily the spin-Peierls transition—since the transition in Nb3Cl8 is first-order, the HT and LT magnetic behaviors need not be related in any way. Assuming the LT state in Nb3Cl8 is a SP state, then calculations for various magnitudes of the spin gap show that the gap must be at least K in order reproduce the observed behavior. These calculations assume the Curie constant is the value extracted from the HT fit for a Seff = 1/2 system, , and the temperature independent contribution is .
The magnitude of the spin gap may also be estimated, assuming LT Nb3Cl8 is a spin-Peierls state and the transition temperature K, by examining the ratio of the susceptibility above and below the transition as is done in other SP materials such as CuGeO3 26. Approximating , and rearranging to with gives K. This is on the same order as to what may be expected of a SP system, where the gap .
We can also make an approximation of the exchange constant in the Nb3Cl8 spin-Peierls system from the spin-phonon coupling constant given by Cross and Fisher 68. Here, , or . Assuming the value of used for CuGeO3, , is used for Nb3Cl8, the calculation yields a K— much larger than the value extracted from the Curie-Weiss fit to the HT susceptibility data of K. This discrepancy may be indicative of a strong enhancement of the exchange constants upon entering the LT state from the structural rearrangement, or that a spin-Peierls model fails to adequately explain the magnetic behavior of Nb3Cl8.
References
- Rotter et al. 2008 M. Rotter, M. Tegel and D. Johrendt, Physical Review Letters, 2008, 101, 107006.
- Neto et al. 2014 E. H. d. S. Neto, P. Aynajian, A. Frano, R. Comin, E. Schierle, E. Weschke, A. Gyenis, J. Wen, J. Schneeloch, Z. Xu, S. Ono, G. Gu, M. L. Tacon and A. Yazdani, Science, 2014, 343, 393–396.
- Nagamatsu et al. 2001 J. Nagamatsu, N. Nakagawa, T. Muranaka, Y. Zenitani and J. Akimitsu, Nature, 2001, 410, 63–64.
- Moncton et al. 1977 D. E. Moncton, J. D. Axe and F. J. DiSalvo, Physical Review B, 1977, 16, 801–819.
- Chen et al. 2009 Y. L. Chen, J. G. Analytis, J.-H. Chu, Z. K. Liu, S.-K. Mo, X. L. Qi, H. J. Zhang, D. H. Lu, X. Dai, Z. Fang, S. C. Zhang, I. R. Fisher, Z. Hussain and Z.-X. Shen, Science, 2009, 325, 178–181.
- Hsieh et al. 2009 D. Hsieh, Y. Xia, D. Qian, L. Wray, F. Meier, J. H. Dil, J. Osterwalder, L. Patthey, A. V. Fedorov, H. Lin, A. Bansil, D. Grauer, Y. S. Hor, R. J. Cava and M. Z. Hasan, Physical Review Letters, 2009, 103, 146401.
- Iga et al. 1998 F. Iga, N. Shimizu and T. Takabatake, Journal of Magnetism and Magnetic Materials, 1998, 177, 337–338.
- Mason et al. 1992 T. E. Mason, G. Aeppli, A. P. Ramirez, K. N. Clausen, C. Broholm, N. Stucheli, E. Bucher and T. T. M. Palstra, Physical Review Letters, 1992, 69, 490–493.
- Palstra et al. 1985 T. T. M. Palstra, A. A. Menovsky, J. van den Berg, A. J. Dirkmaat, P. H. Kes, G. J. Nieuwenhuys and J. A. Mydosh, Physical Review Letters, 1985, 55, 2727–2730.
- Sheckelton et al. 2012 J. P. Sheckelton, J. R. Neilson, D. G. Soltan and T. M. McQueen, Nature Materials, 2012, 11, 493–496.
- Sheckelton et al. 2014 J. P. Sheckelton, F. R. Foronda, L. D. Pan, C. Moir, R. D. McDonald, T. Lancaster, P. J. Baker, N. P. Armitage, T. Imai, S. J. Blundell and T. M. McQueen, Physical Review B, 2014, 89, 064407.
- Sheckelton et al. 2014 J. P. Sheckelton, J. R. Neilson and T. M. McQueen, Materials Horizons, 2014.
- Flint and Lee 2013 R. Flint and P. A. Lee, Physical Review Letters, 2013, 111, 217201.
- 14 G. Chen, H.-Y. Kee and Y. B. Kim, arXiv:1408.1963.
- Mourigal et al. 2014 M. Mourigal, W. T. Fuhrman, J. P. Sheckelton, A. Wartelle, J. A. Rodriguez-Rivera, D. L. Abernathy, T. M. McQueen and C. L. Broholm, Physical Review Letters, 2014, 112, 027202.
- Kennedy and Simon 1991 J. R. Kennedy and A. Simon, Inorganic Chemistry, 1991, 30, 2564–2567.
- Kennedy et al. 1996 J. R. Kennedy, P. Adler, R. Dronskowski and A. Simon, Inorganic Chemistry, 1996, 35, 2276–2282.
- Miller 1995 G. J. Miller, Journal of Alloys and Compounds, 1995, 217, 5–12.
- Schnering et al. 1961 H.-G. v. Schnering, H. Wöhrle and H. Schäfer, Naturwissenschaften, 1961, 48, 159–159.
- Cotton et al. 1988 F. A. Cotton, M. P. Diebold, X. Feng and W. J. Roth, Inorganic Chemistry, 1988, 27, 3413–3421.
- Kennedy and Simon 1992 J. Kennedy and A. Simon, Materials Science Forum, 1992, 91-93, 183–188.
- Clarke et al. 1998 S. J. Clarke, A. J. Fowkes, A. Harrison, R. M. Ibberson and M. J. Rosseinsky, Chemistry of Materials, 1998, 10, 372–384.
- Ezhov et al. 1998 S. Y. Ezhov, V. I. Anisimov, H. F. Pen, D. I. Khomskii and G. A. Sawatzky, Europhysics Letters, 1998, 44, 491.
- McQueen et al. 2008 T. M. McQueen, P. W. Stephens, Q. Huang, T. Klimczuk, F. Ronning and R. J. Cava, Physical Review Letters, 2008, 101, 166402.
- Jakob et al. 2007 S. Jakob, H. Müller, D. Johrendt, S. Altmannshofer, W. Scherer, S. Rayaprol and R. Pöttgen, Journal of Materials Chemistry, 2007, 17, 3833–3838.
- Hase et al. 1993 M. Hase, I. Terasaki and K. Uchinokura, Physical Review Letters, 1993, 70, 3651–3654.
- Isobe et al. 2002 M. Isobe, E. Ninomiya, A. N. Vasil’ev and Y. Ueda, Journal of the Physical Society of Japan, 2002, 71, 1423–1426.
- Shaz et al. 2005 M. Shaz, S. van Smaalen, L. Palatinus, M. Hoinkis, M. Klemm, S. Horn and R. Claessen, Physical Review B, 2005, 71, 100405.
- van Smaalen et al. 2005 S. van Smaalen, L. Palatinus and A. Schönleber, Physical Review B, 2005, 72, 020105.
- Seidel et al. 2003 A. Seidel, C. A. Marianetti, F. C. Chou, G. Ceder and P. A. Lee, Physical Review B, 2003, 67, 020405.
- Schmidt et al. 1993 M. W. Schmidt, K. K. Baldridge, J. A. Boatz, S. T. Elbert, M. S. Gordon, J. H. Jensen, S. Koseki, N. Matsunaga, K. A. Nguyen, S. Su, T. L. Windus, M. Dupuis and J. A. Montgomery, Journal of Computational Chemistry, 1993, 14, 1347–1363.
- Casas-Cabanas et al. 2006 M. Casas-Cabanas, J. Rodríguez-Carvajal and M. Palacín, Zeitschrift für Kristallographie, Suppl, 2006, 23, 243–248.
- QDP 2009 Physical Properties Measurement System: Hardware Manual, Quantum Design, 2009.
- 34 Available under the GNU General Public License at elk.sourceforge.net.
- Ströbele et al. 2001 M. Ströbele, J. Glaser, A. Lachgar and H.-J. Meyer, Zeitschrift für anorganische und allgemeine Chemie, 2001, 627, 2002–2004.
- Zhou et al. 2011 H. D. Zhou, E. S. Choi, G. Li, L. Balicas, C. R. Wiebe, Y. Qiu, J. R. D. Copley and J. S. Gardner, Physical Review Letters, 2011, 106, 147204.
- Sologubenko et al. 2000 A. V. Sologubenko, E. Felder, K. Gianno, H. R. Ott, A. Vietkine and A. Revcolevschi, Physical Review B, 2000, 62, R6108–R6111.
- Pen et al. 1997 H. F. Pen, J. van den Brink, D. I. Khomskii and G. A. Sawatzky, Physical Review Letters, 1997, 78, 1323–1326.
- Dhariwal et al. 2012 M. Dhariwal, T. Maitra, I. Singh, S. Koley and A. Taraphder, Solid State Communications, 2012, 152, 1912–1916.
- Tian et al. 2004 W. Tian, M. F. Chisholm, P. G. Khalifah, R. Jin, B. C. Sales, S. E. Nagler and D. Mandrus, Materials Research Bulletin, 2004, 39, 1319–1328.
- Pocha et al. 2005 R. Pocha, D. Johrendt, B. Ni and M. M. Abd-Elmeguid, Journal of the American Chemical Society, 2005, 127, 8732–8740.
- Waki et al. 2010 T. Waki, Y. Kajinami, Y. Tabata, H. Nakamura, M. Yoshida, M. Takigawa and I. Watanabe, Physical Review B, 2010, 81, 020401.
- Nakatsuji et al. 2012 S. Nakatsuji, K. Kuga, K. Kimura, R. Satake, N. Katayama, E. Nishibori, H. Sawa, R. Ishii, M. Hagiwara, F. Bridges, T. U. Ito, W. Higemoto, Y. Karaki, M. Halim, A. A. Nugroho, J. A. Rodriguez-Rivera, M. A. Green and C. Broholm, Science, 2012, 336, 559–563.
- Shirata et al. 2012 Y. Shirata, H. Tanaka, A. Matsuo and K. Kindo, Physical Review Letters, 2012, 108, 057205.
- Sandilands et al. 2015 L. J. Sandilands, Y. Tian, K. W. Plumb, Y.-J. Kim and K. S. Burch, Physical Review Letters, 2015, 114, 147201.
- Sears et al. 2015 J. A. Sears, M. Songvilay, K. W. Plumb, J. P. Clancy, Y. Qiu, Y. Zhao, D. Parshall and Y.-J. Kim, Physical Review B, 2015, 91, 144420.
- Banerjee et al. 2016 A. Banerjee, C. A. Bridges, J.-Q. Yan, A. A. Aczel, L. Li, M. B. Stone, G. E. Granroth, M. D. Lumsden, Y. Yiu, J. Knolle, S. Bhattacharjee, D. L. Kovrizhin, R. Moessner, D. A. Tennant, D. G. Mandrus and S. E. Nagler, Nature Materials, 2016, 15, 733–740.
- Abdel-Jawad et al. 2010 M. Abdel-Jawad, I. Terasaki, T. Sasaki, N. Yoneyama, N. Kobayashi, Y. Uesu and C. Hotta, Physical Review B, 2010, 82, 125119.
- Miyagawa et al. 2000 K. Miyagawa, A. Kawamoto and K. Kanoda, Physical Review B, 2000, 62, R7679–R7682.
- Oshikawa 2000 M. Oshikawa, Physical Review Letters, 2000, 84, 1535–1538.
- Parameswaran et al. 2013 S. A. Parameswaran, A. M. Turner, D. P. Arovas and A. Vishwanath, Nature Physics, 2013, 9, 299–303.
- Novoselov et al. 2004 K. S. Novoselov, A. K. Geim, S. V. Morozov, D. Jiang, Y. Zhang, S. V. Dubonos, I. V. Grigorieva and A. A. Firsov, Science, 2004, 306, 666–669.
- Novoselov et al. 2012 K. S. Novoselov, V. I. Fal′ko, L. Colombo, P. R. Gellert, M. G. Schwab and K. Kim, Nature, 2012, 490, 192–200.
- Wang et al. 2012 Q. H. Wang, K. Kalantar-Zadeh, A. Kis, J. N. Coleman and M. S. Strano, Nature Nanotechnology, 2012, 7, 699–712.
- Chhowalla et al. 2013 M. Chhowalla, H. S. Shin, G. Eda, L.-J. Li, K. P. Loh and H. Zhang, Nature Chemistry, 2013, 5, 263–275.
- Qian et al. 2014 X. Qian, J. Liu, L. Fu and J. Li, Science, 2014, 346, 1344–1347.
- Ali et al. 2014 M. N. Ali, J. Xiong, S. Flynn, J. Tao, Q. D. Gibson, L. M. Schoop, T. Liang, N. Haldolaarachchige, M. Hirschberger, N. P. Ong and R. J. Cava, Nature, 2014, 514, 205–208.
- Geim and Grigorieva 2013 A. K. Geim and I. V. Grigorieva, Nature, 2013, 499, 419–425.
- Liu et al. 2016 Y. Liu, N. O. Weiss, X. Duan, H.-C. Cheng, Y. Huang and X. Duan, Nature Reviews Materials, 2016, 1, 16042.
- Radisavljevic et al. 2011 B. Radisavljevic, A. Radenovic, J. Brivio, V. Giacometti and A. Kis, Nature Nanotechnology, 2011, 6, 147–150.
- Lee et al. 2014 C.-H. Lee, G.-H. Lee, A. M. van der Zande, W. Chen, Y. Li, M. Han, X. Cui, G. Arefe, C. Nuckolls, T. F. Heinz, J. Guo, J. Hone and P. Kim, Nature Nanotechnology, 2014, 9, 676–681.
- Withers et al. 2015 F. Withers, O. Del Pozo-Zamudio, A. Mishchenko, A. P. Rooney, A. Gholinia, K. Watanabe, T. Taniguchi, S. J. Haigh, A. K. Geim, A. I. Tartakovskii and K. S. Novoselov, Nature Materials, 2015, 14, 301–306.
- Rondinelli and Spaldin 2011 J. M. Rondinelli and N. A. Spaldin, Advanced Materials, 2011, 23, 3363–3381.
- 64 H. Watanabe, H. C. Po, A. Vishwanath and M. P. Zaletel, arXiv:1505.04193.
- Kimber et al. 2014 S. A. J. Kimber, I. I. Mazin, J. Shen, H. O. Jeschke, S. V. Streltsov, D. N. Argyriou, R. Valenti and D. I. Khomskii, Physical Review B, 2014, 89, 081408.
- Bulaevskii et al. 1978 L. N. Bulaevskii, A. I. Buzdin and D. I. Khomskii, Solid State Communications, 1978, 27, 5–10.
- Baker et al. 2007 P. J. Baker, S. J. Blundell, F. L. Pratt, T. Lancaster, M. L. Brooks, W. Hayes, M. Isobe, Y. Ueda, M. Hoinkis, M. Sing, M. Klemm, S. Horn and R. Claessen, Physical Review B, 2007, 75, 094404.
- Cross and Fisher 1979 M. C. Cross and D. S. Fisher, Physical Review B, 1979, 19, 402–419.