11email: mguarce@astropa.unipa.it 22institutetext: Dip. di Fisica e Chimica, Università di Palermo, Piazza del Parlamento 1, 90134 Palermo, Italy 33institutetext: Spitzer Science Center, California Institute of Technology, Pasadena, CA 91125, USA 44institutetext: NASA Ames Research Center, Kepler Science Office, Mountain View, CA 94035, USA
CSI 2264: Simultaneous optical and X-ray variability in pre-Main Sequence stars
Abstract
Context. Pre-main sequence stars are variable sources. The main mechanisms responsible for their variability are variable extinction, unsteady accretion, and rotational modulation of both hot and dark photospheric spots and X-ray active regions. In stars with disks, this variability is related to the morphology of the inner circumstellar region (AU) and that of the photosphere and corona, all impossible to be spatially resolved with present day techniques. This has been the main motivation for the Coordinated Synoptic Investigation of NGC 2264, a set of simultaneous observations of NGC 2264 with 15 different telescopes.
Aims. In this paper, we focus on the stars with disks. We analyze the X-ray spectral properties extracted during optical bursts and dips in order to unveil the nature of these phenomena. Stars without disks are studied in a companion paper.
Methods. We analyze simultaneous CoRoT and Chandra/ACIS-I observations to search for coherent optical and X-ray flux variability in stars with disks. Then, stars are analyzed in two different samples. In stars with variable extinction, we look for a simultaneous increase of optical extinction and X-ray absorption during the optical dips; in stars with accretion bursts, we search for soft X-ray emission and increasing X-ray absorption during the bursts.
Results. We find evidence for coherent optical and X-ray flux variability among the stars with variable extinction. In 9/24 stars with optical dips, we observe a simultaneous increase of X-ray absorption and optical extinction. In seven dips, it is possible to calculate the NH/AV ratio in order to infer the composition of the obscuring material. In 5/20 stars with optical accretion bursts, we observe increasing soft X-ray emission during the bursts that we associate to the emission of accreting gas. It is not surprising that these properties are not observed in all the stars with dips and bursts, since favorable geometric configurations are required.
Conclusions. The observed variable absorption during the dips is mainly due to dust-free material in accretion streams. In stars with accretion bursts, we observe on average a larger soft X-ray spectral component not observed in non accreting stars.
1 Introduction
Pre-main sequence (PMS) stars can be classified according to their spectral energy distribution (SED) in the infrared (Lada, 1987): The youngest PMS stars still surrounded by both a contracting envelope and a circumstellar disk are classified as Class I objects. Class II objects are PMS stars surrounded by circumstellar disks, whose envelope is partially or completely dissipated. Class III sources are PMS stars whose disks have been dissipated or at least evolved into debris disks. The intermediate phases of stars with pre-transition disks (with an intermediate gap separating inner and outer disks, Espaillat et al., 2007) and transition disks (with cleared inner regions, Muzerolle et al., 2010) have been more recently added to this evolutionary scenario. The evolution and dissipation of circumstellar disks involve several physical processes, such as gas accretion onto the central star driven by viscosity and mediated by the magnetic field (e.g. Koenigl, 1991), photoevaporation (e.g. Störzer & Hollenbach, 1999), dust aggregation and settling (e.g. Testi et al., 2014), and environmental feedback (e.g. Guarcello et al., 2016), with timescales which roughly range from few thousands to about years (Haisch et al., 2001; Hernández et al., 2007; Mamajek, 2009).
The disk inner region (AU) is very important for the accretion process, the magnetic coupling between disk and central star, and the evolution of the entire disk and the star itself. This region is however very difficult to analyze, even in the systems close to our Sun and even with infrared and radio interferometry. The analysis of the SEDs of disk-bearing stars has achieved many successes in this direction, such as the discovery of the inner disk wall and pre-transitional gaps, but the physical parameters derived from SED fitting are model-dependent and likely affected by the strong intrinsic variability of these sources in the optical and infrared. An unique insight on the very innermost region of circumstellar disks can be provided by studying the simultaneous variability in optical, infrared and even X-rays, which are intimately connected with the morphology and properties of the circumstellar environment.
Optical variability of PMS stars has been the subject of several studies (e.g. Joy, 1945; Alencar et al., 2010; Morales-Calderón et al., 2011; Wolk et al., 2013; Cody et al., 2014), and originally it was one of the criteria used by Joy (1945) to identify the newly discovered class of T Tauri stars. Herbst et al. (1994) presented the first classification of variability of young stars based on their light curves. Type I111The type of the light curves must not be confused with the class used to classify YSOs light curves are periodic and often sinusoidal, resulting from the rotational modulation of cold photospheric spots. Type II light curves are less periodic and interpreted as the result of variable veiling continuum and rotational modulation of accretion hot spot. Type III light curves vary irregularly because of variable extinction. A more detailed classification of light curves of disk-bearing stars has been recently proposed by Cody et al. (2014), as part of the CSI 2264 project that will be described below. They classify “burster” light curves as those characterized by rapid (0.1-1 day) and symmetric increments of flux (the symmetric shape of the burst means that its rising part is not impulsive and it is similar to the decaying phase, which distinguishes them from flares); “dipper” light curves showing transient fading events (dips); “periodic” and “quasi-periodic” light curves resulting from rotational modulation; “stochastic” light curves which, even if not dominated by bursts or dips, are nevertheless characterized by brightness changes over a variety of timescales; “long-time variables” with monotonic light variations (either brightening of fading) over timescales of days and weeks.
The different types of optical and infrared light curves of stars with disks reflect the different morphology of the inner disks and probe the geometry of the accretion process. Following the classification of Cody et al. (2014), “dipper” stars are AA Tau analogs. AA Tau is a well studied variable star with disk characterized by recurrent occultation of the central star by warps in the circumstellar disk (Bouvier et al., 1999, 2003; Ménard et al., 2003; Bouvier et al., 2007; Grosso et al., 2007) located close to the co-rotation radius (Rucinski et al., 2008; Alencar et al., 2010; Cody & Hillenbrand, 2010). These warps in the inner disks are in general due to misalignment between the rotation and magnetic axes, and they are located at the base of steady accretion streams, which are stable over several stellar rotation periods (Alencar et al., 2010). Alencar et al. (2010) have also shown that AA Tau like variability is common in stars with inner disks; in their study of the optical and infrared variability of the stars in NGC 2264, they have found that nearly 40% of the stars with inner disks are characterized by AA Tau like variability.
Also, accretion contributes to variable optical and infrared extinction (e.g., McGinnis et al., 2015). The accretion streams are dust-free, but small amounts of dust can be trapped at the base of the streams and survive until the temperature is higher than the sublimation temperature. As suggested by Stauffer et al. (2015) the dust particles trapped in the accretion streams can be responsible for small dips in the optical light curves. Another way accretion may contribute to optical variability is by the emergence of the optical emission from accretion hot spots on stellar surface (Stauffer et al., 2014). In fact, the accreting material funneled by the magnetic field falls onto the stellar surface with a velocity of several hundreds of km per second. This energy is released at the accretion shock as soft X-ray, UV, and optical radiation.
Is it possible to observe variability in X-rays due to the accretion process and variable circumstellar extinction? PMS stars are very bright X-ray sources (Feigelson & Decampli, 1981), with their X-ray emission exceeding that of main sequence stars with the same mass by three or four orders of magnitude (e.g. Montmerle, 1996). The main component of this X-ray emission is the quiescent222Or at least apparently quiescent, since the “quiescent” coronal emission can be actually the result of a superposition of small flares, e.g. Caramazza et al. (2007) emission from a scaled up version of the Solar corona with plasma at MK, powered and confined by a dynamo-generated stellar magnetic field (e.g. Feigelson & Kriss, 1981). However, the lack of an evident main sequence-like rotation-activity relation in PMS stars, together with the large and so far unexplained scatter of X-ray brightness, indicate that the emission mechanism might be more complicated than this. Intense flaring activity produced by magnetic reconnection is observed in PMS stars (e.g. Flaccomio et al., 2003), and they can be so powerful as to require non solar geometry for the stellar magnetic field (Jardine et al., 2006). Sometimes flares in PMS stars are modeled with very large loops that may even reach the surface of the inner disks (Favata et al., 2005). Accretion also contributes to the emission of soft X-rays (e.g. Kastner et al., 2002), produced in the accretion shocks and observed in a few Class II stars, such as TW Hya and BP Tau, using detailed spectroscopic analysis (Kastner et al., 2002; Stelzer & Schmitt, 2004; Schmitt et al., 2005; Argiroffi et al., 2011; Curran et al., 2011). However, this X-ray emission has been unambiguously identified only in the nearest stars with disks, primarily because it is difficult to distinguish from the coronal soft X-ray emission. Additionally, a significant part of this emission is likely absorbed by accreting and circumstellar material itself (Argiroffi et al., 2011; Bonito et al., 2014).
X-ray emission from PMS stars is strongly variable over a large range of timescales and amplitudes. The most evident source of X-ray variability is undoubtedly flares. The rise phase is much shorter than the decline phase (which can last several hours), and the peak flux can be 100 times the quiescent flux (Favata et al., 2005). There are, however, other sources of X-ray variability. Stellar coronae are not homogeneous, and their X-ray emission can be modulated by stellar rotation (Flaccomio et al., 2005). This has been observed in the Chandra Orion Ultradeep Project (COUP, Getman et al., 2005): a 13 day long continuous Chandra/ACIS-I observation of the Orion Nebula Cluster. Also accretion spots are not uniformly distributed over the stellar surface, resulting in a rotational modulation of soft X-ray emission. This, however, has only been observed in the T Tauri star V4046 Sgr (Argiroffi et al., 2012). Variable absorption of the coronal emission by circumstellar and accreting material can be another source of X-ray variability (e.g. Flaccomio et al., 2010).
Simultaneous optical, infrared, and X-ray variability in stars with disks can be the consequence of unsteady accretion, variable extinction, and rotational modulation (Flaccomio et al., 2012). Stassun et al. (2007) find no convincing evidence for coherent optical and X-ray flux variability in the PMS stars in Orion. No evidence of coherent X-ray and infrared variability in PMS stars is found by Flaherty et al. (2014) in their study of the PMS stars in IC 348, concluding that X-rays are not an important source of heating for the circumstellar material. A different result has been obtained by Flaccomio et al. (2010) in their study of the PMS stars in NGC 2264. They find a significant correlation between optical and X-ray flux variability using two ksec Chandra/ACIS-I observations (separated by 16 days) and simultaneous CoRoT data. This correlation is observed only in Class II sources, and it is not observed in the hard X-ray band. This is interpreted as a consequence of variable absorption of both photospheric and coronal emission.
In this paper, we analyze new simultaneous X-ray and optical observations of NGC 2264, obtained as a part of the CSI 2264 project, to search for connections between optical and X-ray variability in PMS stars with disks observed in the quiescent emission. We show the effectiveness of time-resolved X-ray spectral analysis in stars with disks using the optical light curves as template to isolate interesting features such as accretion bursts and optical dips. NGC 2264, the object of this study, and the CSI 2264 project are described in Sect. 2. In Sect. 3, we describe the CoRoT and Chandra data sets analyzed and the selection of the targets; in Sect. 4, we present evidence for coherent optical and X-ray flux variability. In Sect. 5, we present a detailed analysis of the variability of the X-ray properties during dips and bursts observed in the CoRoT light curves. Results are summarized and discussed in Sect. 6.
2 NGC 2264 and the CSI 2264 project
The study of the variability of young stars offers the possibility of probing the very inner circumstellar region (AU) and the morphology of stellar coronae and photospheres. This is one of the main motivations of the Coordinated Synoptic Investigation of NGC 2264 (CSI 2264, Cody et al., 2014; Stauffer et al., 2014). This project is a unique and unprecedented cooperative project involving simultaneous observations of NGC 2264 with 15 ground and space telescopes, covering the electromagnetic spectrum from X-rays to mid-infrared. The entire list of the observations which are part of the CSI 2264 project can be found in Cody et al. (2014). The main optical photometric dataset is obtained from observations with the Convection, Rotation and Planetary Transits satellite (CoRoT, Baglin et al., 2006) from December 1st 2011 to January 3rd 2012, using the second CCD designed for exoplanets studies. CoRoT observed an area of square degrees centered on NGC 2264 with a cadence of 512 sec, or 32 sec for the brighter sources.
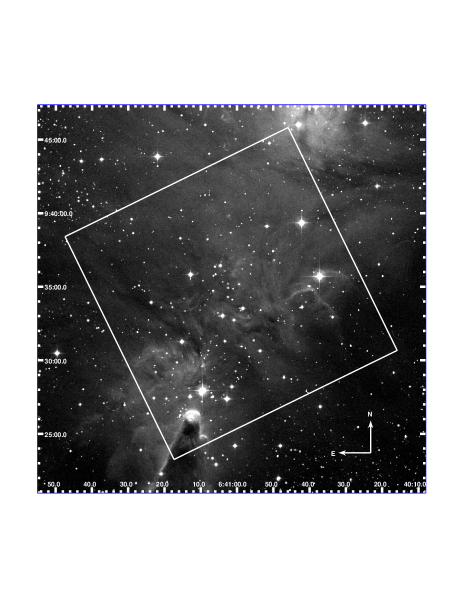
NGC 2264 is the only young cluster (1-5 Myrs, Rebull et al., 2002; Dahm, 2008) falling in one of the CoRoT eyes (i.e., the two regions with a diameter close to the galactic center and anti-center observed with CoRoT), making it a unique target for monitoring the variability of young stars using this telescope. This cluster is relatively nearby (pc, Park et al., 2000), and part of the local spiral arm. It is characterized by non-uniform extinction across the field, with both richly populated low-extinction regions containing in total about two thousand sources, and highly embedded regions where the star formation process is still ongoing, as evidenced by the presence of stars with thick disks, molecular outflows and Herbig-Haro objects (Teixeira et al., 2012). The median extinction of known cluster members is quite low (A0.45m, Rebull et al., 2002). The cluster population is well defined, and it includes a few early type stars, such as the O7V star S Monocerotis (Schwartz et al., 1985) and about a dozen B type stars. NGC 2264 is the only cluster within one kpc of the Sun, besides the Orion Nebula Cluster, with such a large mass spectrum. Fig. 1 shows a DSS-2 image of the central region of NGC 2264. The field of view of the Chandra observations analyzed here is indicated. The actual CoRoT field, wide, is larger than the field shown in Fig. 1.
3 Data analysis and targets selection
3.1 CoRoT light curves
CoRoT photometry is available only for stars falling in pre-selected pixel masks. For this reason, the list of targets has been carefully pre-compiled before the observations, and it includes 1617 known candidate members of NGC 2264 and 2129 field stars falling in the area of the cluster (Cody et al., 2014). The membership criteria used for targets selection are described in Cody et al. (2014) and they are based on: 1) Optical photometry compatible with the cluster in color-magnitude diagrams as defined by Flaccomio et al. (2006); 2) strong H emission (Rebull et al., 2002; Lamm et al., 2004; Sung et al., 2008); 3) X-ray detection (Ramírez et al., 2004; Flaccomio et al., 2006); 4) radial velocity compatible with NGC 2264 (Fűrész et al., 2006); 5) presence of a circumstellar disk (Sung et al., 2009; Cody et al., 2014). Only targets with have been observed.
Light curves are produced after correction from gain and zero offset, jitter, electromagnetic interference, and background subtraction, following the standard CoRoT data reduction pipeline (Samadi et al., 2006). Data from hot pixels and outliers are flagged and removed from the light curves. While most of the light curves refer to the full CoRoT band, for a subset of stars three light curves are provided, referring to “red”, “green”, and “blue” bands. However, since these bands are not calibrated, in this work we only use the sum of the three bands, i.e. the white light curves. CoRoT light curves are not in an absolute magnitude scale since the photometric zero point of the CoRoT data varies between runs. A photometric zero point of 26.74m specific for the CSI 2264 CoRoT observations has been obtained by Cody et al. (2014) after comparing the mean CoRoT flux of selected stars with their available -band photometry (from Rebull et al., 2002; Lamm et al., 2004; Sung et al., 2008). Flaccomio et al. (in preparation) obtained a slightly smaller zero point (26.6m), which is the value adopted in this paper.
A number of systematics are not corrected by the standard pipeline and affect CoRoT light curves. The most important systematic, affecting about 10% of the observed light curves, consists of abrupt jumps in flux which are due to rapid changes in detector temperature. In this paper, we do not attempt any correction for this effect and we reject when necessary CoRoT data that are affected by such jumps. We use only CoRoT data which are not flagged as suspicious data points.
3.2 X-ray data
In this paper, we use the data obtained from four Chandra/ACIS-I observations taken from December 3rd to December 11th 2011 (P.I. G. Micela) during the CoRoT run. Table 1 shows the log of these observations. The total nominal exposure is ksec, and all the observations are pointed at =06:40:58.70,=+09:34:14, with almost coincident roll angles. In order to make astrometry compatible with 2MASS, each image has been reprojected by matching bright 2MASS sources detected in X-rays and correcting for the observed offsets both in RA and DEC.
| Obs.ID | Exposure (ksec) | Date |
|---|---|---|
| 14368 | 74.44 | Dec. 3rd 2011 |
| 13610 | 92.54 | Dec. 5th 2011 |
| 13611 | 60.23 | Dec. 7th 2011 |
| 14369 | 66.16 | Dec. 11th 2011 |
A detailed analysis of the Chandra/ACIS-I (Weisskopf et al., 2002; Garmire et al., 2003) observations available for NGC 2264, including source detection, photon extraction and spectral fitting, is presented in Flaccomio et al. (in preparation). Briefly, all events have been fully reprocessed using the CIAO task chandra-repro. Sources were detected using the wavelet-based algorithm PWDetect (Damiani et al., 1997), adopting a significance threshold of 4.4, roughly resulting in 10 expected spurious detections. Event extraction, source repositioning, and validation were performed with the IDL software (AE, Broos et al., 2010). AE is capable of: i) defining the extraction region around each source, accounting for crowding and the shape of the PSF at different off-axis angles; ii) extracting both source and background events, the latter in a suitable region around the source; iii) compiling photometry, calculating light curves, and providing source statistics. After pruning candidate spurious detections, a total of 694 X-ray sources were validated. X-ray spectra were fitted using Xspec v.12.8.1 (Arnaud, 1996). Observed spectra were rebinned in photon energy in order to have a signal-to-noise ratio larger than one in each bin.
3.3 Targets selection
The main objective of this paper is to analyze the simultaneous optical and X-rays variability of stars with disks in NGC 2264.
We adopt the selection of stars with disks presented in Sung et al. (2009) and Cody et al. (2014), which is based on the slope of the SEDs in the IRAC and MIPS m bands and suitable color-color diagrams where the typical loci populated by disk-bearing stars can be defined. Among the 95 candidate stars with disks observed with CoRoT and falling in the ACIS-I field, 86 are detected in X-rays. We also define a subsample of 79 stars with disks (75 detected in X-rays) which are actively accreting. These stars are selected using two criteria: H equivalent width (EW) larger than 10 Å (Rebull et al., 2002) or using the vs. H color-color diagram from the INT (Isaac Newton Telescope, 2.5 m) Photometric H Survey (IPHAS; Drew et al., 2008). In this color-color diagram, in fact, it is possible to select candidate accreting stars as those with red H color, and derive from this color an estimate of the H EW (Barentsen et al., 2011). Disk-bearing sources without signatures of accretion are identified as stars with passive disks (15 stars, 10 detected in X-rays). We also selected 10 candidate stars with transition disks (all detected in X-rays) as those showing excesses only at m and 24m. The infrared excesses in each infrared band is calculated using the color indices similar to those defined in Guarcello et al. (2009, 2013). These color indices compare the and colors, with being or one of the Spitzer bands. Since these indices increase as becomes more red, and they are independent from extinction, they can be used to separate the extinguished stellar population from that with intrinsic red colors, and to calculate the excess in each infrared band. We refer to Damiani et al. (2006) and Guarcello et al. (2009) for a detailed description of these color indices and their use.
We also adopt the classification of the CoRoT light curves provided by Cody et al. (2014): “Bursters” (13% of the stars with disks in NGC 2264 observed with CoRoT); sources with variable extinction (“dippers”, 21.5%, about half of which are periodic); stars with light curves showing stochastic behavior (13%, named “stochastic”); non-variable stars (19%); stars with periodic or quasi-periodic variability (21%); long-term variables (1%); eclipsing binaries (1%); and sources with unclassified variability (11%). Since the classification of the “stochastic” stars may vary according to different time windows, we reviewed the behavior of these sources in the period simultaneous with the four ACIS-I observations. Sometimes we consider stars as “dippers” or “bursters” depending on the dominant phenomenon occurring during the Chandra observations.
4 Coherent optical and X-ray flux variability
In this section we analyze the simultaneous flux variability in optical and X-rays. Coherent flux variability is expected to occur when: i) The star is affected by variable extinction due to circumstellar material simultaneously obscuring both stellar photosphere and coronal active regions; or ii) photospheric spots, accretion hot spots, and coronal active regions simultaneously emerging during stellar rotation.
4.1 Existing studies
A search for coherent optical and X-ray flux variability in T Tauri stars has been attempted only in a very few cases, given the paucity of existing simultaneous optical and X-ray observations of young clusters. Stassun et al. (2006) studied data of the Orion Nebula taken with the WIYN 0.9 m telescope at the Kitt Peak National Observatory (KPNO) and the 1.5 m Cassini telescope in Loiano, Italy, simultaneous with the COUP observations. These optical data have been taken with a cadence of one data point per hour, not comparable to the excellent time resolution of the CoRoT data. These authors find evidence of coherent optical and X-ray flux variability in about 5% of the analyzed T Tauri stars. This result has been interpreted in terms of rotational modulated emission from accretion spots, and the lack of correlation in most of the observed stars as evidence that X-ray emission arises mainly from the stellar corona rather than from the accretion spots distributed over the stellar surface.
Flaccomio et al. (2010) search for correlations between optical and X-ray flux variability in the young stars in NGC 2264 by comparing the variation of the X-ray fluxes observed in two 30 ksec Chandra ACIS-I observations (Obs. IDs: 9768 and 9769; P.I. G. Micela) with that of the CoRoT “white” fluxes from simultaneous observations. They find evidence of correlated flux variability in a sample of 24 low-mass T Tauri stars with disks, and only in the soft 0.5-1.5 keV X-ray band. This is interpreted as evidence that the correlation is a result of time-variable absorption by the surrounding circumstellar material. These authors also suggest that the obscuring material is dust-depleted, as expected from accretion streams covering part of the stellar corona and photosphere.
4.2 Coherent optical and X-ray flux variability in stars with disks of NGC 2264
The starting point for our search of coherent optical and X-ray flux variability in the NGC 2264 T Tauri stars is the result obtained by Flaccomio et al. (2010). We first replicate their approach to verify whether our new data confirm their finding. To this aim, we select all the X-ray sources observed with CoRoT with more than 10 counts detected in at least two Chandra observations, discarding known massive and intermediate-mass stars (i.e., rejecting stars more massive than 2 M⊙). Hereafter, we will call Chandra frames the time intervals corresponding to the Chandra observations listed in Table 1, i.e., where both CoRoT and X-ray data are available. For each selected source, we calculate the mean X-ray photon flux and CoRoT white-band flux observed in each Chandra frame where no flares are detected333Flares are automatically detected using the approach defined in Caramazza et al. (2007), i.e., dividing the X-ray light curve in blocks of almost constant count rate (Maximum Likelihood Blocks) and classifying these intervals according to the measured count-rates and its time derivative. A detailed analysis of the flares observed in NGC 2264 will be presented in Flaccomio et al. 2016 (in preparation). We then calculate the flux variability among two Chandra frames and as:
| (1) |
where is the optical or the X-ray photon flux detected during the Chandra frame.
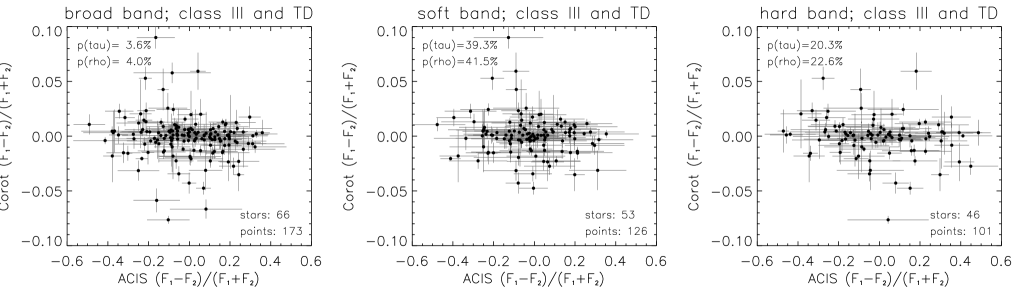
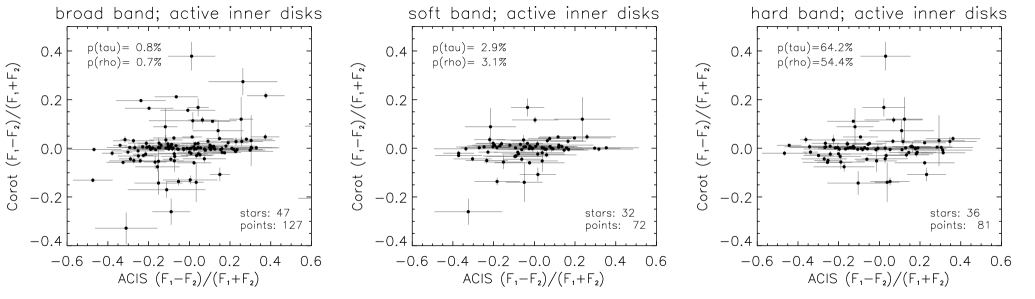
The result of this approach is shown in Fig. 2, where each point compares the value of calculated for a given source in two consecutive Chandra frames. Error bars are propagated from the uncertainties on X-ray and optical fluxes, the former computed with Poissonian statistics, the latter from the RMS of the optical light curve observed during the given Chandra frames. We use X-ray data in different energy bands (broad in the left panel, soft in the central, and hard in the right). In Fig. 2 we consider separately the sample of stars with an inner disk, both passive or accreting, and that of stars with a transition disk and class III objects444The classification of class III objects and the analysis of their variability is the subject of a companion paper. (whose variability is expected to be similar, Cody et al. 2014).
The amplitude of the observed variability is different in these two samples of stars. We observe a smaller amplitude of optical variability in stars without close circumstellar material than in those with inner disks, with the difference of a factor between two and four. Conversely, the range of variability in X-rays is similar in the two cases. This is due to the fact that rotational modulation of photospheric spots and active regions, typical of the inner-disk-free sample, results in smaller amplitude modulation than, for instance, variable extinction (Venuti et al., 2015). In each panel, we also show the results of correlation tests, which in general indicate that there is no obvious correlation between broad band X-ray and optical measures for stars with disks, though some of the extreme points (obtained from 17 stars) drive a statistically significant correlation in the X-ray broad energy band in the stars with inner disks. This is not observed in the stars without close circumstellar material.
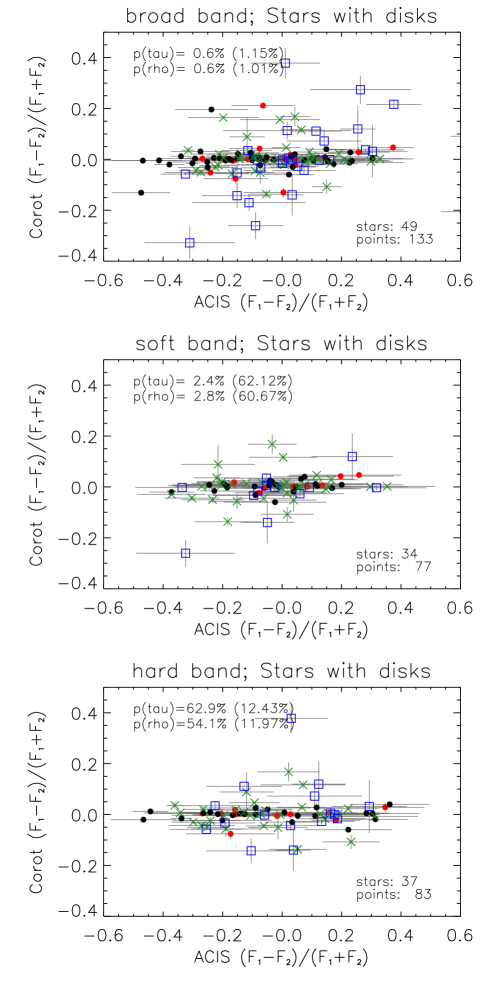
Using the classification of optical light curves provided by Cody et al. (2014), we can obtain deeper insight into the different mechanisms responsible for coherent optical and X-ray flux variability. In Fig. 3, we investigate correlations between optical and X-ray flux variability for those stars with circumstellar disks whose light curves are classified by Cody et al. (2014). The X-rays count-rates are indicated separately for the the broad band (upper panel), soft band (central panel), and hard band (bottom panel). It is evident that the stars with large amplitude optical variability, dominating any possible correlation, are “dipper” or “stochastic” stars. The results of the correlation tests are shown for the entire sample and for the “stochastic”+“dippers” sample (values inside the brackets), and they indicate that a correlation between optical and X-ray flux variability is possible only in stars with disks and variable extinction. This is reinforced by the fact that the “stochastic” stars with large variability in optical in Fig. 3 have optical dips during the Chandra frames.
5 Variability of the X-ray properties during optical dips and bursts
5.1 Time resolved analysis of stellar X-ray properties
The unique data set analyzed in this work allows us to study in detail how the X-ray properties of disk-bearing stars vary during events observed in optical, specifically dips due to variable extinction and bursts due to accretion. Among the 86 stars with disks observed both with CoRoT and Chandra, 51 are bright enough in X-rays to allow a reliable analysis of their variability. Among them, 24 show well-defined flux dips in the CoRoT data, and 20 show accretion burst signatures, with some stars showing both properties.
To this aim, we divide each Chandra time frame into smaller time intervals, defined in order to isolate interesting features in the CoRoT light curves such as dips and bursts. For each time interval, we then calculate the mean CoRoT flux and extract the X-ray photons detected during the time interval to calculate the corresponding X-ray photon flux FX (in units of photons cms-1), the hydrogen column density NH (in units of cm-2), the temperature of the emitting plasma kT (in keV), and the 10%, 25%, and 50% photon energy quantiles (E10%, E25%, E50%, respectively, in keV). Flaccomio (in preparation) demonstrate that E10% and E25% are well-correlated with the hydrogen column density obtained fitting the observed X-ray spectra of NGC 2264 low mass members with 1T or 2T thermal plasma models, so they are useful probes for the X-ray absorption affecting the stars. Some of the time intervals are narrow with few photons observed, but despite the small signal-to-noise ratio, such small time intervals are necessary to isolate those features that we want to analyze.
The X-ray properties in each time interval are calculated fitting the observed X-ray spectra with 1T and 2T APEC ionization-equilibrium plasma isothermal model (Smith et al., 2001), assuming the sub-solar elements abundance defined by Maggio et al. (2007), and affected by photoelectric absorption from both interstellar and circumstellar material treated using the TBABS model (Wilms et al., 2000). Best-fit models are chosen with the C-statistic and the quality of the fit is tested using the Xspec tool goodness. The limit for acceptable fits in this paper is set to null-hypothesis probability of a good fit (P%) equal to 5%. The significance of the parameters obtained with the spectral fit is tested by the analysis of the confidence contours in the C-stat space with the Xspec tool steppar.
5.2 Disks properties
We analyzed the SEDs of some stars using the on-line SED fitting tool presented by Robitaille et al. (2007)555Now available at https://sedfitter.readthedocs.org/en/stable/. With this tool it is possible to compare the observed SEDs with a set of YSO models covering an extensive parameter space, 20000 models, each at 10 different inclination angles, for a total of 200000 distinct SEDs. For the fit, we constrain the source distances to that of NGC 2264 (pc) and explore a wide range of possible extinctions (from = to =). The best-fit models are those that satisfy the condition: , where is the reduced chi-square of the best-fit model (as suggested by Robitaille et al., 2007). Accretion rates and H EW of the stars discussed in this section are taken from Dahm & Simon (2005) and Venuti et al. (2014), and shown in Table 2.


| Mon-ID | H EW | H shape | |
|---|---|---|---|
| Å | M⊙/yr | ||
| 456 | 13.1 | asymmetric | |
| 1167 | 23.4 | 4.610-9 | |
| 412 | 30.7 | asymmetric | 10-7 |
| 717 | 24.5 | 2.810-8 | |
| 619 | 94.3 | 410-8 | |
| 491 | 67.2 | 310-8 | |
| 774 | 14.3 | ||
| 1076 | 2.6 | ||
| 808 | 50.2 | asymmetric | 1.710-8 |
| 370 | 113.2 | ||
| 326 | 27.9 | 1.710-9 | |
| 474 | 104.7 | ||
| 357 | 8 | ||
| 945 | 66.3 | asymmetric | |
| 771 | 28.9 | ||
| 765 | 18.2 | ||
| 103 | 6.4 | ||
| 378 | 8.5 |
5.3 Optical dips with increasing X-ray absorption
In this section, we analyze the variability of those stars with disks with increasing X-ray absorption during the optical dips, i.e., where optical extinction and X-ray absorption may increase simultaneously. For each of these stars, we show the CoRoT light curve, with indicated the Chandra frames and the time intervals we defined, together with the variability of some of the following X-ray quantities: NH in units of cm-2, kT, E10% and E25% in keV. The X-ray spectra observed during the time intervals together with the best fit models are shown in Appendix A; Appendix D contains the entire CoRoT light curves of all the stars analyzed in this paper. Each star is labeled with both the CoRoT ID and the Mon- ID.
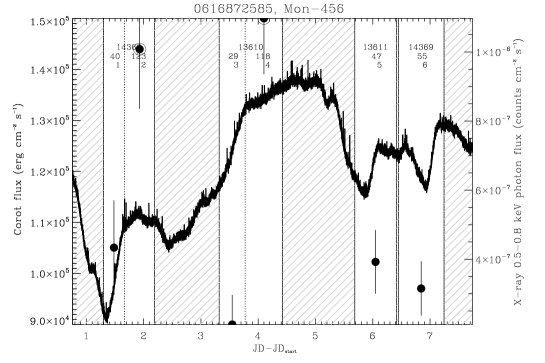
Mon-456: Mon-456 (Fig. 4) is an interesting case of simultaneous optical and X-ray variability. This class II K4 star, with a rotation period of 5.05 days, is moderately accreting and it is classified as a “quasi periodic dipper” by Cody et al. (2014) and as a “AA Tau like” star by McGinnis et al. (2015) according to both their 2008 and 2011 data. The latter authors also observe increasing reddening of the CoRoT light curve during the dips, typical of AA Tau (Bouvier et al., 2003), and that several flux dips appear in the light curve during each rotation period, suggesting the presence of various secondary accretion streams. Large optical dips are observed during three Chandra frames (left panel in Fig. 4):
-
•
A deep optical dip is observed in part during the time interval #1.
-
•
The intervals #2 and #4 are dominated by X-ray flares.
-
•
The time intervals #5 and #6 are characterized by two optical dips with similar X-ray properties (right panels in Fig. 4).
-
•
Time interval #3 has a rising optical light curve.
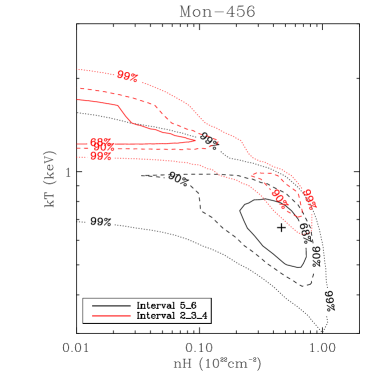
The time variability of NH (shown in Fig. 4) and the time resolved X-ray spectra (Fig. 25) suggest a larger NH during the dips in #5 and #6 than in the other time intervals, but in each dip the X-ray absorption is not well constrained. In order to better constrain the X-ray absorption during the dips, we fit the average X-ray spectrum over the summed time interval #5+#6 and compare the results with that obtained from time intervals #2+#3+#4. From the latter spectrum, we obtain NH=cm-2 (P%=0.68), while for the former NH=cm-2 (P%=0.85), suggesting a larger hydrogen column density during the optical dips. The 2 significance of this difference is confirmed by the contours in the C-stat space shown in Fig. 4.
There is no evidence for larger NH during the dip in #1, and the X-ray spectral fit of the spectrum observed in #1+#5+#6 results in a poorly constrained fit (P%=0.002). However, some evidence for the X-ray spectrum getting harder during this dip (i.e. increasing E10%) is presented in the Appendix B.
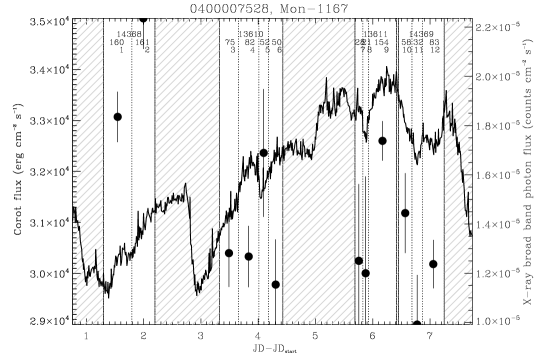
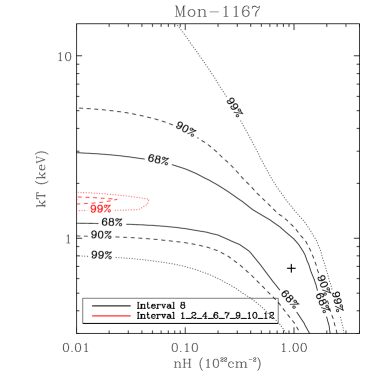
Mon-1167: Fig. 5 shows the optical and X-ray variability of the M3 disk-bearing star Mon-1167, classified as a “quasi-periodic stochastic” by Cody et al. (2014) and as an aperiodic extinction dominated star during 2008 and an “AA Tau analog” during 2011 by McGinnis et al. (2015). This star is moderately accreting and its light curve is characterized by:
-
•
Small optical dips in the time intervals #5, #8, and #11, together with a large optical dip observed only partially during the time interval #3.
-
•
The optical emission rises during #1 and #2, then steeply falls in #10.
-
•
No peculiar features are observed in #4, #6, #7, #9, #12.
During the dips, the CoRoT flux declines by the 5.5% (#3), 1.9% (#5), 2.1% (#8), and 1.3% (#11). The obtained NH is significantly different from zero only during #3 and #8, although in #8 the error bar is large and marginally compatible with the value observed in #7 (right bottom panels in Fig. 5).
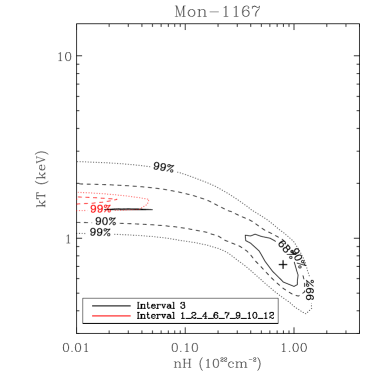
The C-stat contours from the spectral fits in the time intervals #3 and #8 support the evidence of a larger NH during #3, while a possible solution with NH=0 within 68% confidence is possible during the time interval #8.
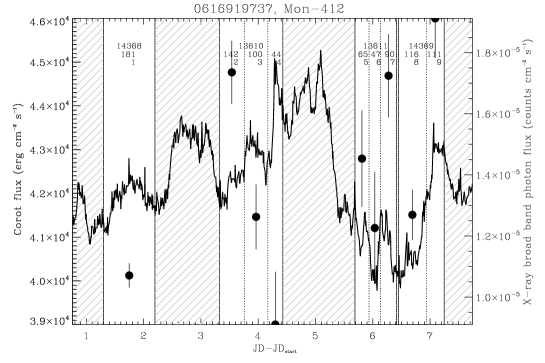
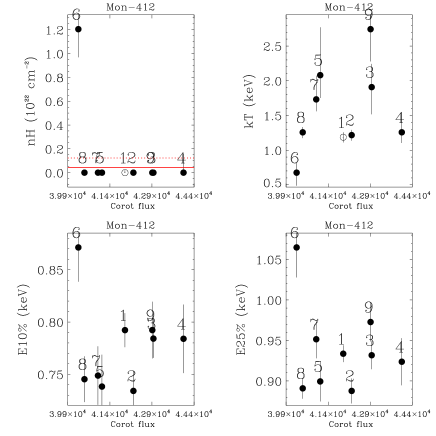
Mon-412: Fig. 6 shows the optical and X-ray variability of the accreting M1 class II object Mon-412, classified as a “burster” by Cody et al. (2014) and Stauffer et al. (2014). CoRoT light curve (upper left panel) is characterized by accretion bursts and dips666It must be noted that the CoRoT light curve of Mon-412 may have been contaminated by a nearby disk-free cluster member more than one magnitude fainter in band and falling in the CoRoT mask.:
-
•
Small optical burst-like features are observed in #1, #2, #3, #8.
-
•
Prominent optical burst-like features are observed in part during #4 and #9.
-
•
In #5, #6, and #7 the optical light curve shows a sequence of dip-like and/or burst-like features, with the CoRoT flux being 3.5% lower in #6 than in #5 and #7.
It is not clear from the CoRoT light curve alone whether the variability observed in the third Chandra frame is due to two optical bursts in #5 and #7 or to an optical dip in #6. Some hint is provided by the variability of the X-ray properties (shown in the right panels). During the time interval #6, in fact, NH varies from 0 to 1.2cm-2 together with E10%, E25%, and E50% (the latter not shown in Fig. 6) reaching the highest values observed in this star. However, as shown in Fig. 6, the 68% statistical confidence region in the C-stat space for the interval #6 also allows solutions at low NH. We conclude then that there are hints of a larger X-ray absorption during #6, but this is not significantly supported by the time resolved X-ray spectral analysis.
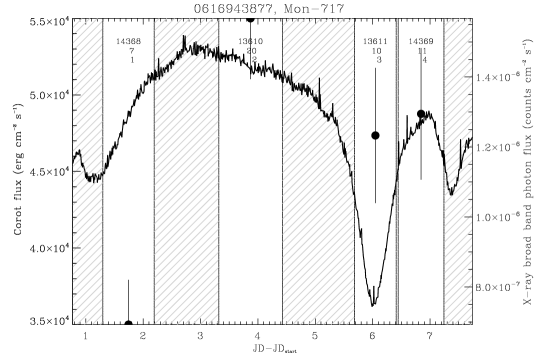
Mon-717: Mon-717 shows a large optical dip (see Fig. 7), longer than the third Chandra frame and with the CoRoT flux decaying by 25.3% (corresponding to an increase777Ignoring the size of the obscuring feature with respect to the stellar disk. of by 0.38m) and a FWHM of 0.6 days. This star is a Class II M0.5 star that is moderately accreting. The source is faint in X-rays, with only 10 photons detected during the dip and 20 in the previous Chandra frame. The X-ray emission is, however, harder during the dip than in the other frames, as suggested by the variability of the photon energy quantiles (Fig. 7), suggesting that not only the optical emission but also the X-ray emission is more absorbed during the third Chandra frame.
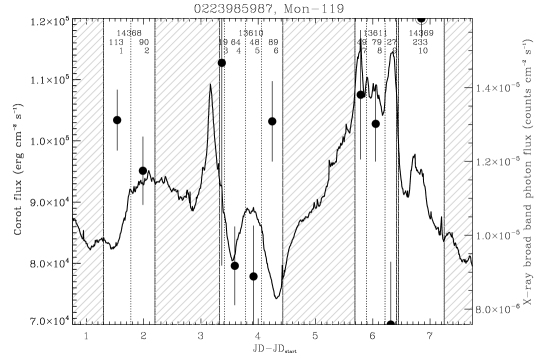
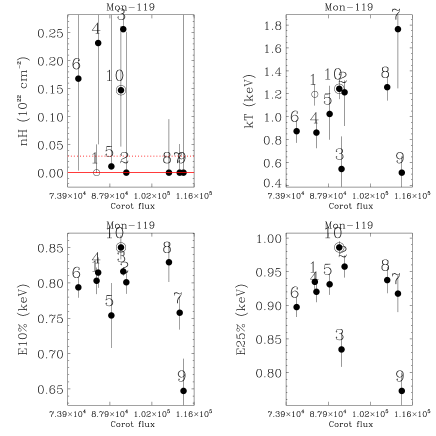
Mon-119: The optical and X-ray variability of Mon-119 (spectral type K6, Dahm & Simon, 2005), classified as a “stochastic” star by Cody et al. (2014) and as a star whose variability is mostly driven by variable accretion by Stauffer et al. (2016), is shown in Fig. 8. The CoRoT light curve shows several features:
-
•
The optical emission rises by a factor 1.12 during #1, followed by a more quiescent phase (#2).
-
•
An intense optical burst occurred between the first and second Chandra frames, whose final part is observed in the time interval #3 (with only 19 X-ray photons detected).
-
•
Two optical dips are observed in the time intervals #4 and #6 separated by a quiescent phase (#5).
-
•
The optical emission is higher during the third Chandra frame with at least two evident bursts (intervals #7 and #9), separated by a more quiescent phase (#8).
-
•
The fourth Chandra frame (#10) is dominated by an intense X-ray and optical flare.
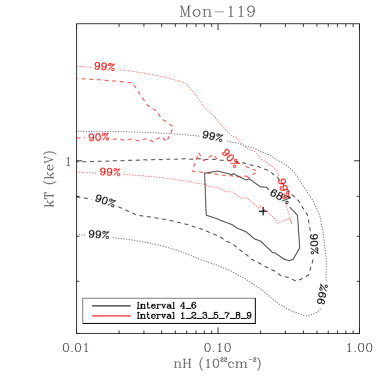
In the two dips (#4 and #6), the CoRoT flux decreases by 8.9% and 15.7% with respect to the optical emission observed during the time interval #5. As shown in the top right panels in Fig. 8, excluding the flare, NH is always compatible with zero in all the time intervals except in the second Chandra frame (#4, and #6). In order to verify whether a significantly larger NH is observed during these two optical dips, we fit the 1T thermal plasma model to the average X-ray spectrum summing the time intervals #4+#6. The average value of NH suggested by the best fit model is N=cm-2, which is significantly larger than zero (and larger than the absorption observed in the remainder intervals) within a 68% confidence range. This is confirmed by the contours in the C-stat space (Fig. 8).
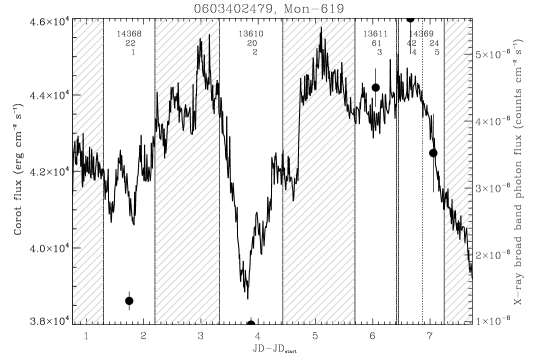
Mon-619: Mon-619 is a K8.5V star actively accreting from its disk, and both Cody et al. (2014) and McGinnis et al. (2015) classified this star as an aperiodic extinction dominated star. The CoRoT light curve of Mon-619 in Fig. 9, shows:
-
•
A large optical dip that dominates the second Chandra frame (#2).
-
•
Two smaller optical dips or an accretion burst occurring during a large dip during #1.
-
•
No evident features are observed in #3 and #4, even if there are several spikes that may be the consequence of unsteady accretion.
-
•
A steep decline of the optical emission during #5.
In the dip observed in the second Chandra frame the optical flux decreases by 10.4%, corresponding to the extinction increasing by 0.14m. We observe the largest values of E10% and E25% during the large dip in the second Chandra frame, suggesting a larger X-ray absorption during the optical dip. Fig. 9 also shows that the time variability of both the CoRoT and X-ray flux is coherent and correlated, as expected in AA Tau like stars. The X-ray spectrum of Mon-619 is one of the hardest observed in our sample (Fig. 29), with a median photon energy of 3.26 keV, (the typical value in ours sample is 1.3 keV). Given the low X-ray counts, the spectral fits are not well constrained and thus not discussed.
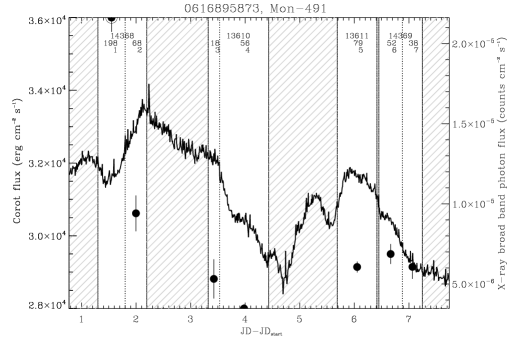
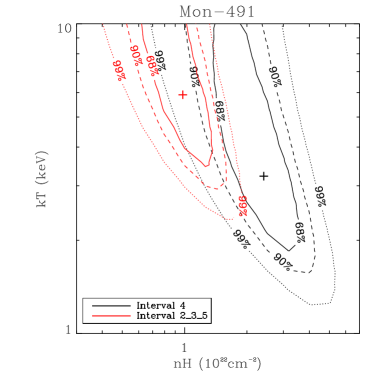
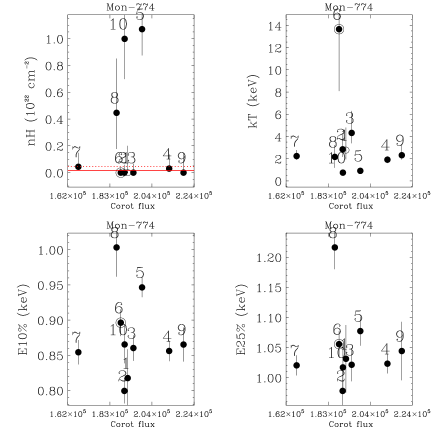
Mon-491: Mon-491 is a K3V star actively accreting from its disk, and it has been classified by Cody et al. (2014) as a long term variable and by Stauffer et al. (2016) as a star with variable accretion. The CoRoT light curve of Mon-491 (Fig. 10) shows:
-
•
A rising phase in optical during #1 and #2.
-
•
A very steep optical decline with the CoRoT flux decreasing by about the 20% during the second Chandra frame (#4), after a phase with a more constant optical flux (#3), which may be due to variable extinction.
-
•
The optical emission remains almost constant during #5 and #6 and then declines during #7.
Even if the light curve of Mon-491 does not show dips during the Chandra frames, we want to verify whether during the decline of optical emission observed in #4, there is evidence for increasing X-ray absorption. We compare the X-ray properties of Mon-491 during the intervals where the optical light curve does not decline (i.e., #2+#3+#5) with those observed during #4. NH is smaller during the former time intervals than during #4 at 96% confidence: NHcm-2 while NHcm-2. The significance of this difference is confirmed by the contours in the C-stat space shown in Fig. 10.
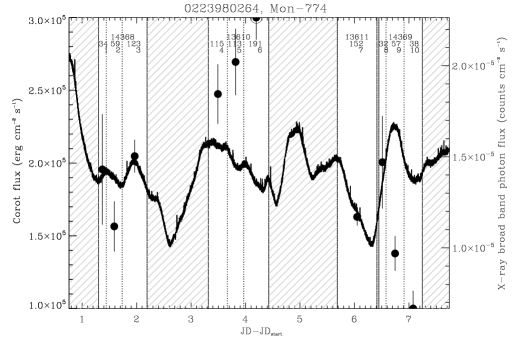
Mon-774: The CoRoT light curve of Mon-774 (spectral type K2.5, classified as “stochastic” by Cody et al. 2014 with an AA Tau phase observed during 2008 and analyzed in detail by McGinnis et al. 2015), shown in Fig. 11, is characterized by:
-
•
A sequence of optical high and low phases in #1, #2, and #3
-
•
Two large optical dips, one dominating the third Chandra frame (time intervals #7 and #8), and one between the first and second Chandra frames.
-
•
An optical dip observed during #10 after a higher phase in #9.
-
•
A small optical dip observed in #5 during the decline phase from #4 to #6.
The CoRoT flux variation during the dip in #7 is about 16.8%, corresponding to an increase of optical extinction , while the dip observed between the first and second Chandra frames is less deep, with a 6.4% CoRoT flux variation (). The variability of the X-ray properties is shown in the right panels of Fig. 11. NH is larger than zero in three time intervals. In the interval #10, the best fit predicts a NH larger than zero but the C-stat contours, not shown here, admit solutions with NH=0 within 68% confidence level, so it will not be discussed further.
In the interval #8 NH is only slightly larger than zero at 68% confidence. Interval #8 is actually part of the large dip which dominates #7, so the two intervals must be considered together. However, the X-ray spectral fit of the spectrum observed during #7+#8 does not result in a well-constrained estimate of NH, with solutions ranging from 0 to about 0.3cm-2 within 68% confidence.
The small dip isolated in the time interval #5 is more interesting in this respect. The NH obtained using 2T thermal plasma model888Using a 1T model, the fit is not statistically acceptable (1.07cm-2) is significantly different than zero and larger than the value obtained from the average spectrum (0.54cm-2) at 68% confidence level, as proved by the C-stat contours shown in Fig. 11.
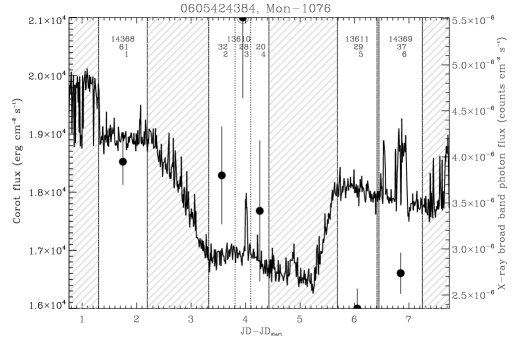
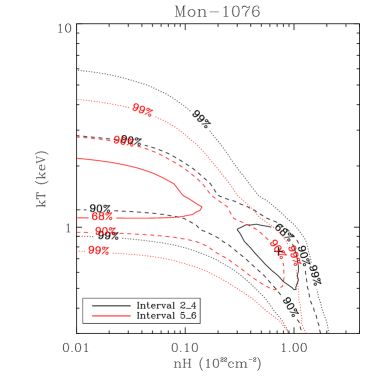
Mon-1076: The CoRoT light curve of the non-accreting star Mon-1076 (spectral type M1), listed as a star with periodic flux dips in Stauffer et al. (2015), is shown in Fig. 12:
-
•
During the second Chandra frame, the CoRoT light curve is dominated by a large dip (time intervals #2, #3, and #4), with a 10.6% CoRoT flux variation (corresponding to an increase of optical extinction by AV=0.15m, see Table 6).
-
•
An optical and X-ray flare is isolated in the interval #3.
-
•
Almost constant optical emission is observed during #1, #5, and #6 (in the latter case probably with some variability).
The variability of the X-ray properties, shown in the right panels in Fig. 12, suggests a larger NH observed at the beginning of the optical dip, compared with the remaining intervals. The significance of this difference is confirmed in the bottom panel in Fig. 12, which compares the confidence regions in the C-stat space obtained from the fit of the X-ray spectrum observed in the intervals #2+#4 (during the dip) and #5+#6 (after the dip). The X-ray absorption in the former interval is larger than that observed in the latter within a 68% confidence.
5.4 Variability of the X-ray properties during the optical bursts
In this section, we analyze the time-resolved X-ray properties during the optical bursts. We look for evidence of: i) A soft component in the X-ray spectrum (below 1 keV) which may result from the emission of accreting gas in the accretion shock, and ii) increasing X-ray absorption due to the gas in the accretion streams. Hereafter, we classify the X-ray spectra with “an intense soft X-ray spectral component” as those whose observed X-ray emission below 1 keV is significantly larger than the flux predicted by the best fit 1T thermal plasma model fitting the observed time resolved X-ray spectra as explained in Sect. 5.1. With few exceptions, we restrict this definition to cases where the spectral fit using 1T thermal plasma model is statistically unacceptable, accounting for the fact that stellar coronae are not isothermal and 2T models may be always required when there are enough X-ray photons detected.
To analyze the simultaneous optical and X-ray variability of stars with optical bursts, we use an approach similar to that adopted for the stars with dips. For each star, we show a set of panels including the CoRoT light curve observed during the Chandra frames, with superimposed the variability of the soft X-ray flux; the observed time resolved X-ray spectra; and the variability of the following X-ray properties: The plasma temperature; the E10% and E25% photon energy quantiles; and the median photon energy E50%, for stars with soft X-ray emission during the optical bursts, or the hydrogen column density NH for stars with increasing X-ray absorption during the optical bursts. Together with the time resolved X-ray spectra, we show the best fit thermal plasma model, 1T or 2T if the fit using 1T thermal models is statistically unacceptable.
The criterion adopted to search for a soft component (i.e., the acceptance level for 1T models) depends on plasma properties and on the number of photons collected. Since we aim to monitor the presence of a soft component irrespective of the photon statistics, for each star, we also analyze the variability of the normalization of the soft component over the defined time intervals. To attempt highlighting only the variation of the normalization of the soft component and thus the variability of the cold plasma emission measure, for this test we fit the time resolved X-ray spectra with 2T thermal plasma models with fixed NH (set equal to the value derived from the known optical extinction), kTsoft=0.3 keV (typical of the soft emission from accretion spots), kThard=1.6 keV (the typical coronal temperature of NGC 2264 members). We do not set the plasma temperatures and/or the absorption in our search of intense soft X-ray spectral component during the optical bursts to avoid that underestimating the X-ray absorption would affect our results.
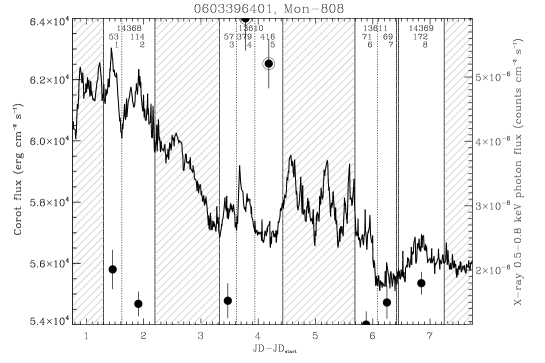
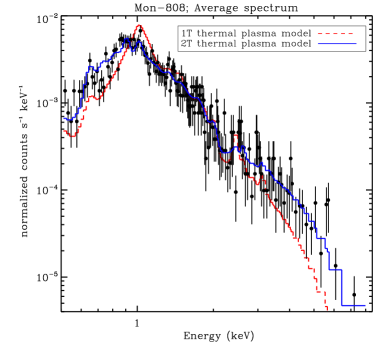
Mon-808: Mon-808 is an accreting disk bearing star with spectral type K4 (Dahm & Simon, 2005) classified as a “burster” by Cody et al. (2014) and as a “burst-dominated light curve” by Stauffer et al. (2014). Its CoRoT light curve during the Chandra frames (Fig. 13) shows:
-
•
Large optical bursts in the time intervals #1 and #2.
-
•
Small optical bursts in the time intervals #3 and #8.
-
•
A bright optical and X-ray flare dominating the time intervals #4 and #5 (the latter dominated by the decaying phase of the X-ray flare).
-
•
Micro bursts may be present in #6 and #7, with a decline of the optical emission by about 3% observed in the latter.
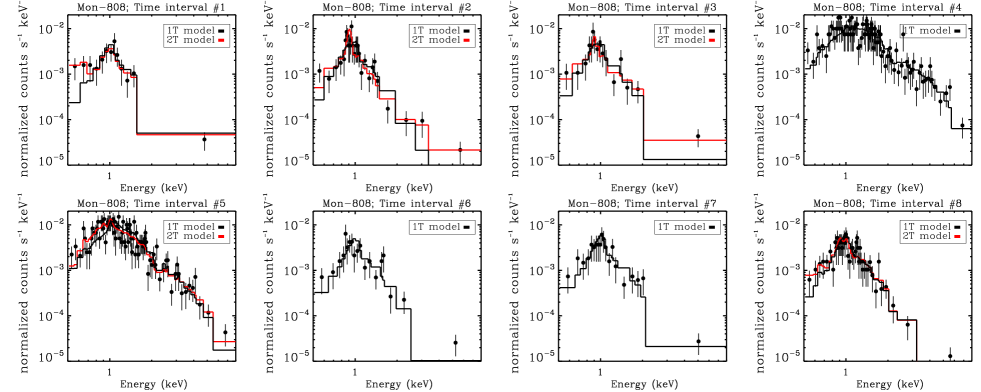
In some of the time resolved X-ray spectra shown in Fig. 13, the soft X-ray emission below 0.8 keV is larger than the prediction of the 1T fitting model, specifically in #1, #2, and #3. The bottom panel shows how the normalization of the soft component of the best fit 2T thermal plasma model (with fixed NH and kT) varies in the time intervals. The associated errors are too large to allow us any meaningful comparison.
Table 3 shows the results of the time-resolved spectral analysis, specifically the predicted plasma temperatures, and the null-hypothesis probabilities resulting from the best-fit 1T and 2T APEC models. In particular, in the time intervals #1 and #2 the use of 1T plasma models results in unacceptable fits, while the quality of the fit improves significantly using 2T plasma models. In the time intervals #3 and #8, the 1T fit is acceptable (in the former likely because of the low X-ray counts), but the fitting thermal plasma model does not reproduce the observed soft X-ray emission (below 0.7 keV in the former and 0.9 keV in the latter), which are instead well-fitted with the 2T thermal plasma model. These are the time intervals where we search for soft X-ray emission due to accretion.
Since we want to constrain the soft temperature as well as possible, we fit the average X-ray spectrum over the time intervals where an intense soft X-ray spectral component is observed using 2T thermal plasma model. An acceptable fit is obtained from the average spectrum observed in #1+#2+#8, with a soft temperature kTkeV (P), which corresponds to MK999We obtain the same soft component temperature (kTkeV) from the average #1+#2 X-ray spectrum, but with a less constrained X-ray spectral fit (P). In the approximation of strong shock scenario, the pre-shock velocity can be calculated from the post-shock plasma temperature as:
| (2) |
where is the pre-shock gas velocity, the post-shock temperature, and the mean molecular weight (0.61 in our case). Adopting the computed soft temperature as , this calculation results in a pre-shock velocity of the accreting gas of km/s. Adopting a stellar mass of 1.2 M⊙ and radius of 1.7 R⊙ obtained interpolating the Siess et al. (2000) pre-main sequence isochrones with the values of and for Mon-808 (the former from a bolometric correction on the dereddened magnitude and the latter from the known spectral type), and an age of 4.5 Myr, and with the hypothesis of negligible energy loss during the accretion, this pre-shock velocity corresponds to a free-fall from a distance of R⊙, corresponding to stellar radii101010It must be noted that these radii are calculated from the center of the system.. The fact that the pre-shock velocity we obtain is significantly smaller than the free-fall velocity from infinity (519 km/s) suggests that the free-fall radius (Rff) is sufficiently well constrained. Its lower limit is comparable with the disk inner radius (1.4 stellar radii) which can be predicted by SED analysis (see Sect. 5.1). Since the light curve of Mon-808 is not periodic, its rotation period is unknown, and thus we can not calculate the co-rotation radius as . However, bearing in mind that this calculation is strongly uncertain, we note that the free-fall radius is smaller than the typical co-rotation radii of disk-bearing stars (5-10 Rstar, Hartmann et al., 1998; Shu et al., 2000).
The presence of a significant soft X-ray spectral component below 0.9 keV in Mon-808 is also evident in the average spectrum, shown in Fig. 13. Together with the observed spectrum (with flares removed), we show the best fit 1T thermal plasma model, which results in a poor fit (P%0), and the best fit 2T model, which results in an acceptable fit (P%=55) with the two plasma temperatures kTkeV and kTkeV.
| Interval | kT1 | kT2 | P(1T) | P(2T) |
|---|---|---|---|---|
| # | keV | keV | % | % |
| 1 | 2.1 | 98.8 | ||
| 2 | 0.3 | 50.0 | ||
| 3 | 23.3 | |||
| 4 | 54.8 | |||
| 5 | 0.7 | 26.8 | ||
| 6 | 22.2 | |||
| 7 | 81.1 | |||
| 8 | 55.4 |
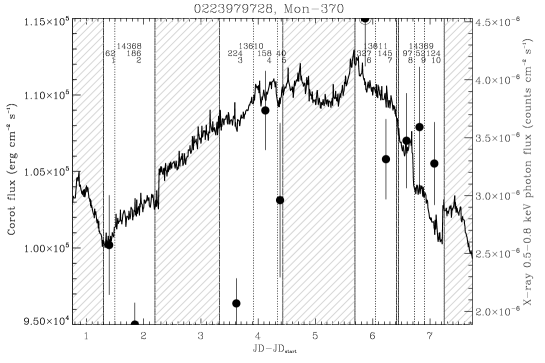

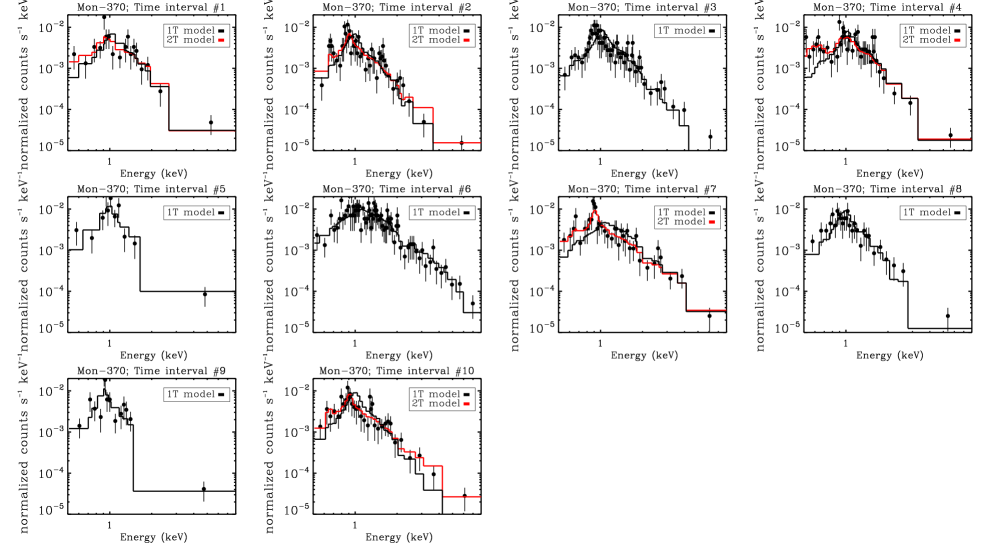

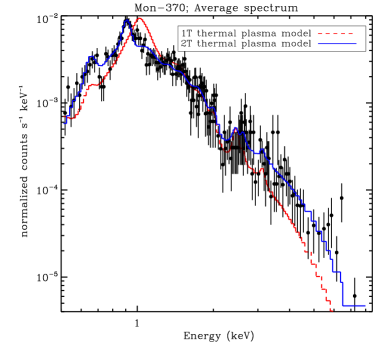


Mon-370: The K5 star Mon-370 is among the strongest accretors in NGC 2264, with a H EW roughly corresponding to the 71% quantile of the H EW distribution of all the accretors in our sample. The CoRoT light curve of this star (Fig. 14) shows:
-
•
A superposition of intense optical bursts in #4.
-
•
In #5, we isolate the begin of the rising phase of a burst occurring between the second and third Chandra frame.
-
•
An X-ray and optical flare during #6.
-
•
A decline of optical emission by 9.1% between #9 and #10.
-
•
Myriad small peaks during all the other intervals.
We can speculate that the light curve of this star is affected by myriad small bursts caused by an intense and chaotic accretion process, with several short-lived accretion streams hitting the stellar surface at various positions. The X-ray spectra observed in most of the time intervals (shown in Fig. 14) confirm this scenario, showing an intense soft X-ray spectral component (typically for energies keV, sometimes keV). The most evident soft X-ray spectral component is observed in the time interval #4, characterized by the most intense optical burst and the lowest E10% observed in this star. A smaller but evident soft X-ray spectral component is also present in the time intervals #7 and #10, all characterized by several small bursts. The X-ray spectral fit with 1T thermal plasma model is not well-constrained in most of the cases (fourth column in Table 4): In the time intervals #1, #2, #4, #7 and #10 P% is below the 5% threshold. In some cases, this is likely due to the fact that we have enough X-ray photons to resolve different thermal components in the coronal emission (e.g., #2); in other cases by the presence of an evident soft X-ray spectral component (e.g. #4). An intense soft X-ray spectral component is also evident in the average spectrum, as shown in the bottom right panel in Fig. 14.
The bottom left panel in Fig. 14 shows the time variability of the normalization of the soft component using 2T model with fixed NH and kT. The time interval with the largest normalization of the soft component is #5, where we isolate the rising part of a burst, followed by #6 dominated by a X-ray flare. The normalization observed in #4 and #7 are instead compatible with those observed in the remainder intervals.
| # | kT1 | kT2 | P(1T) | P(2T) | vpre | R |
| keV | keV | % | % | km/s | Rstar | |
| 1 | 4.6 | 48.4 | ||||
| 2 | 0.0 | 7.8 | ||||
| 3 | 8.7 | |||||
| 4 | 0.0 | 25.4 | ||||
| 5 | 12.7 | |||||
| 6 | 7.8 | |||||
| 7 | 0.0 | 92.4 | ||||
| 8 | 76.8 | |||||
| 9 | 16.2 | |||||
| 10 | 0.13 | 97.8 | ||||
| ∗ Rff is calculated assuming MM⊙, RR⊙, | ||||||
| and age=4 Myrs | ||||||
As for Mon-808, we fit the X-ray spectra of these time intervals with two temperatures plasma models, which better reproduce the observed spectra, primarily in the time intervals #4 and #7, but also in #2 and #10 (see Fig. 14 and Table 4). The temperatures predicted by the best-fit models are shown in Table 4, together with the pre-shock velocity calculated using Eq. 2 and the corresponding free-fall launching distance from the central star, in units of stellar radii. In the time intervals #2, #4, #7, and #10, the pre-shock velocity ranges from 242 km/s to 557 km/s, sometimes being compatible with the free-fall velocity from infinity (512 km/s). In order to better constrain these parameters, we fit the average X-ray spectrum observed summing these four time intervals, obtaining a good fit with a 2T thermal plasma model (P100) with kT1=keV and kT2=keV. The soft temperature corresponds to a pre-shock velocity of km/s from a free-fall radius of Rstar. The X-ray spectral fit of the average spectrum observed in the entire Chandra observation results in similar temperatures (kTkeV and kTkeV). Bearing in mind that this calculation is approximate, the free-fall velocity is smaller than the value from infinity, the upper limit of Rff is well below both the inner radius of the dusty disk predicted by the SED analysis (8.9 stellar radii), and the co-rotation radius calculated adopting the rotation period of 11.84 days (Venuti et al. in preparation), is equal to 13.8 Rstar.
Mon-119: Marginal evidence for an intense soft X-ray spectral component during the optical bursts is also observed in Mon-119 (see Fig. 8). This star has been discussed in Sect. 5.3. We focus here on the optical bursts during the time intervals #3, #7, and #9. In particular, as shown in the right panels of Fig. 8, during #3 and #9 both the plasma temperature and the 10% and 25% energy quantiles suggest that the corresponding X-ray spectra are dominated by soft photons (see the spectra shown in Fig. 28 and also in the variability of E10% shown in the Appendix B). However, given the few X-ray photons detected, the two spectra are well fitted by 1T thermal plasma models (P and 93%, respectively), as well as the average spectrum summing these two time intervals (P%=58%).
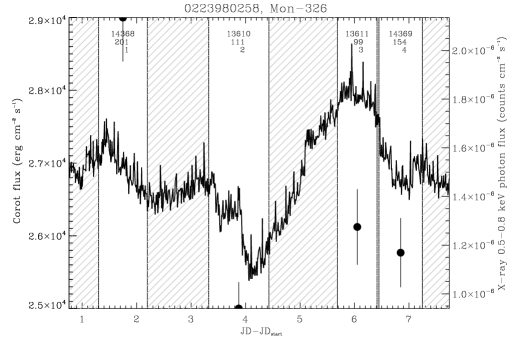
Mon-326: The M0 star Mon-326, whose variability is shown in Fig. 15, is described as a star whose light curve is dominated by accretion hot spots in Stauffer et al. (2014). It is not a strong accretor and in fact its CoRoT light curve does not show many prominent bursts, except a 0.3 day long burst observed at the beginning of the first Chandra frame (time interval #1). In the first time interval, an intense soft X-ray spectral component is evident (for kTkeV), and the normalization of the soft component of the best fit 2T model is larger than in the other intervals (bottom panel).
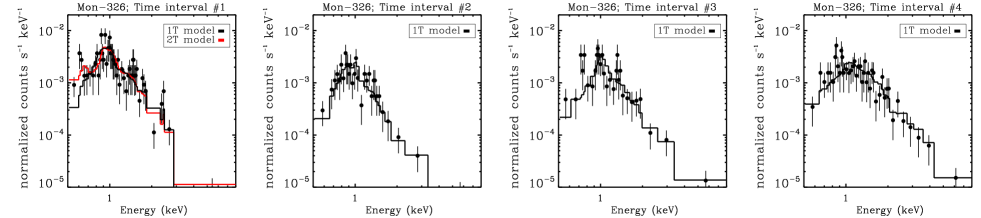
The fit with a 2T plasma model of the X-ray spectrum observed in the first time interval (shown in Fig. 15) better reproduces the observed soft X-ray emission below 0.7 keV, with the null-hypothesis probability increasing from almost zero to 34%. In #1, the soft temperature obtained from the best fit 2T model is kTkeV. Using Eq. 2, this temperature corresponds to a pre-shock velocity of km/s, compatible with the free-fall velocity from infinity (395 km/s).
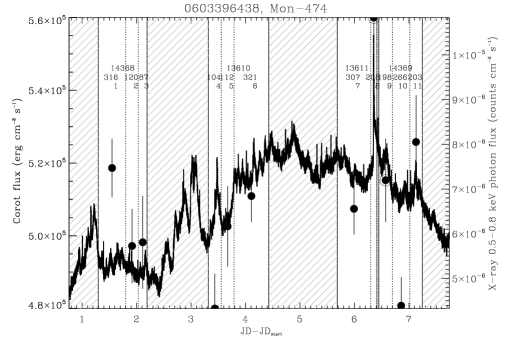
Mon-474: Fig. 16 shows the variability of Mon-474, the only G type star (Dahm & Simon, 2005) analyzed in this section, which is actively accreting from its disk. This star was listed as a star with accretion bursts in Stauffer et al. (2014). The CoRoT light curve during the Chandra observations (but also in the remainder) is dominated by several small bursts:
-
•
#4 is dominated by an intense optical burst with the optical emission increasing by 3.8%.
-
•
In #5, we isolate a transition from the large optical burst observed in #4 and a sequence of small bursts.
-
•
The intervals #1, #2, #3, #6, #7, #10, #11 are dominated by several small optical bursts.
-
•
#8 and #9 are dominated by a bright optical and X-ray flare.
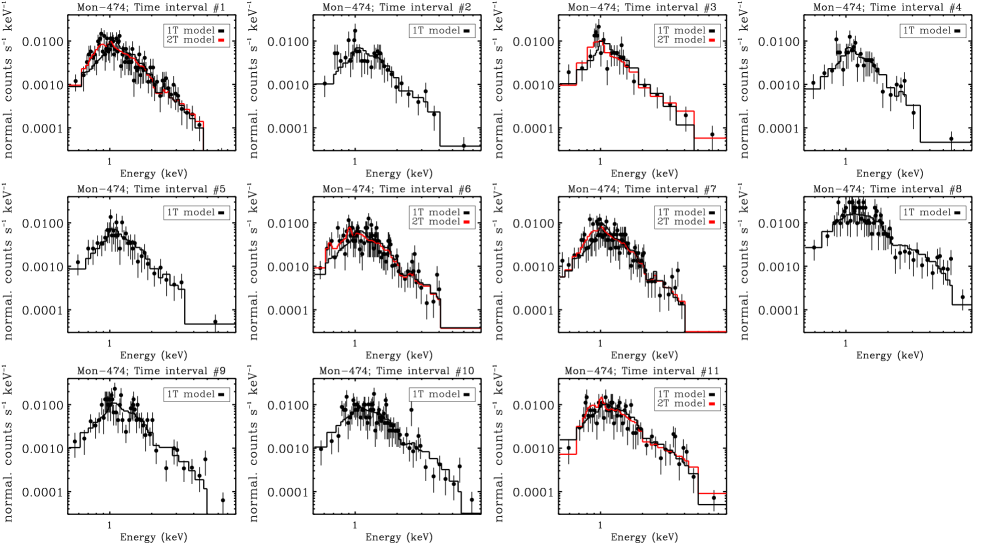
The time resolved X-ray spectra (central panels of Fig. 16) show an intense soft X-ray spectral component below 1 keV in the time intervals #1 and #6. It may also be present even if less evident during the interval #7. No evident soft X-ray spectral component is observed during #3 and #11. The X-ray spectra observed in some of these intervals such as #6 and #7 are not well-fit with 1T thermal plasma models, and they also show soft X-ray photon energy quantiles. Table 5 shows the plasma temperatures predicted by the best fit 1T or 2T (when the former is poorly constrained) plasma model and the associated null-hypothesis probabilities.
Repeating for Mon-474 the calculation made for Mon-808, adopting a stellar mass of 1.9 M⊙ and a radius of 4.04 R⊙, we obtain a pre-shock velocity of the accreting material of km/s in the time interval #1 and km/s in the time interval #6, both compatible with the free fall velocity from infinite distance from the star (423 km/s).
| Interval | T1 | T2 | P(1T) | P(2T) |
|---|---|---|---|---|
| keV | keV | % | % | |
| 1 | 1.9 | 88.0 | ||
| 2 | 63.7 | |||
| 3 | 1.7 | 79.4 | ||
| 4 | 76.5 | |||
| 5 | 98.7 | |||
| 6 | 0.5 | 26.9 | ||
| 7 | 3.5 | 64.2 | ||
| 8 | 83.6 | |||
| 9 | 11.0 | |||
| 10 | 13.2 | |||
| 11 | 0.0 | 8.4 |
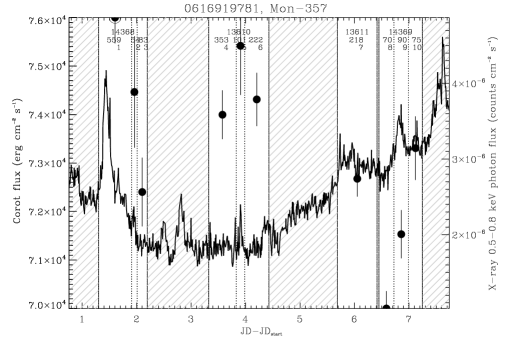


Mon-357: The variability of the K5 star Mon-357 is shown in Fig. 17. Even though it has a small H EW, this star has a CoRoT light curve dominated by several bursts-like features of various intensity:
-
•
A bright optical and X-ray flare is observed during the time interval #1.
-
•
Large optical bursts are observed during #5, #6, #7, and #9.
-
•
Small optical bursts are observed during #2 and #10.
-
•
No interesting features are observed during #3, #4, and #8.
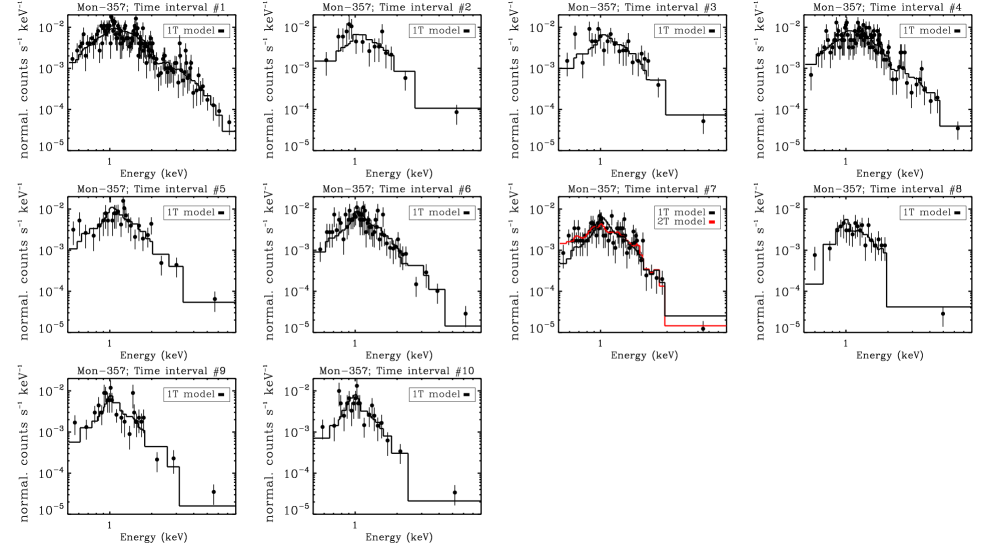
The variability of the X-ray properties (Fig. 17) suggests that the X-ray spectrum becomes softer and the X-ray emitting plasma colder with increasing CoRoT flux (ignoring the flare). The Spearman’s rank correlation test is significant for kT (correlation coefficient and the two-side significance of its deviation from zero ), E25% (, ), and E50% (, ), while it is not significant for E10%. This suggest that the observed variability is dominated by accretion. Intense soft X-ray spectral components in the time-resolved X-ray spectra are observed in some intervals. In #7, when the CoRoT light curve is dominated by a superposition of small bursts, it is necessary to adopt a 2T thermal plasma model to obtain a good fit (P%=3.3% with 1T model, 93.2% with 2T model). No useful information is provided by the time variability of the normalization of the soft component of the best fit 2T model (not shown) because of the associated large errors.
The X-ray spectrum during #7 shows a peak of soft X-ray emission at about 0.7 keV. The soft temperature predicted by the best fit 2T thermal plasma model is well constrained, equal to keV. Since Chandra/ACIS-I is not sensitive to such soft emission, we do not calculate the pre-shock velocity from this plasma temperature. However, it must be noted that a similar value for the temperature of the soft component is also obtained from the average spectrum among those intervals with large bursts: #5+#7+#9+#10 (P%=0.10), suggesting that the soft part of the X-ray spectrum of Mon-357 is dominated by emission from the accretion spots.
In Fig. 17 we show the average X-ray spectrum of Mon-357 with the best fit 1T (P0%) and 2T (P88%) thermal models. The presence of an intense soft X-ray spectral component is evident.
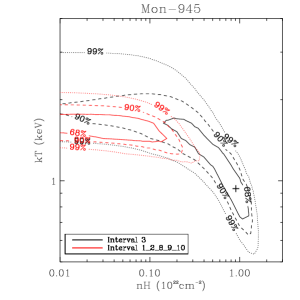
The search for increasing X-ray absorption during the optical bursts has been less prolific. This is, however, not surprising given that this effect can be observed only if the accretion streams obscure the coronal active regions when the accretion hot spots are clearly visible, which is strongly dependent on the geometry of the accretion and the distribution of the active regions in the stellar corona. In only two cases (Mon-945 and Mon-771), described below, there is evidence for such a correlation.
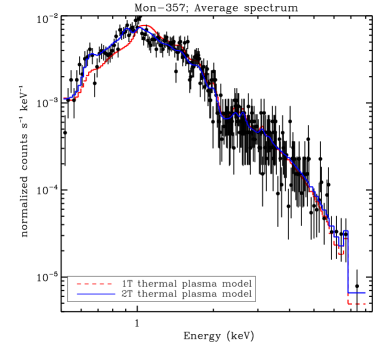
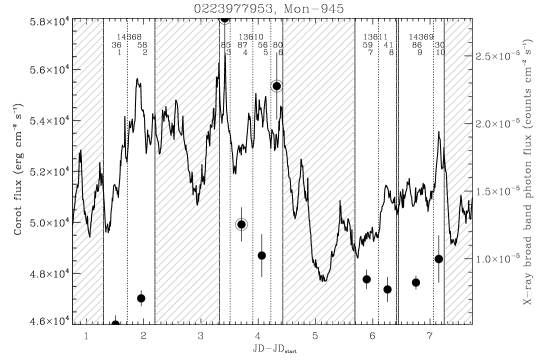
Mon-945: Mon-945 is a K4 accreting star, with evidence for a larger veiling when the star is optically brighter, which supports the classification as “burster” by Cody et al. (2014) and Stauffer et al. (2014). The CoRoT light curve during the Chandra observations is dominated by a large number of bursts (Fig. 18):
-
•
Optical bursts are observed in #2, #5, #8, #9, and #10.
-
•
#1 and #7 show dip-like optical features, more prominent in the former interval.
-
•
#3, #4, and #6 are dominated by optical and X-ray flares.
The bottom panels of Fig. 18 show the X-ray spectra observed during the time intervals, where there is no evidence of intense soft X-ray spectral components. However, of particular interest is the burst/flare observed during time interval #3. The identification of this event by our automatic routines as an X-ray flare is uncertain given that the rising part is not observed by Chandra, as it lies between the first and second Chandra frames, and we observe only the decaying phase at the beginning of the second Chandra frame (the time interval #3). Additionally, in #3 we observe the highest value of X-ray absorption (NH=cm-2) and a low plasma temperature (kT=keV), similar to that observed in other intervals. These properties are more compatible with an accretion burst rather than a X-ray flare, with increasing X-ray absorption due to the accreting gas falling into the line of sight. This is the only time interval where the NH obtained from spectral fit is significantly larger than zero, together with that observed in #5 (NH=cm-2) during which the CoRoT light curve shows several bursts. Fig. 18 also shows the contours in the C-stat space obtained for Mon-945 during the time intervals #3 and #5, supporting the evidence for larger NH.
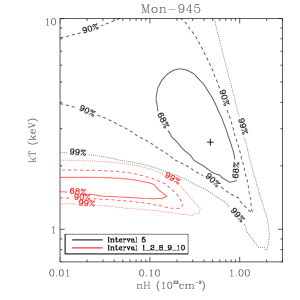
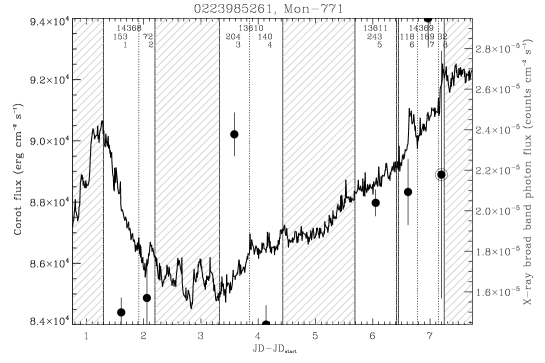
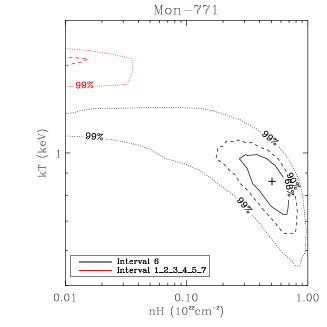
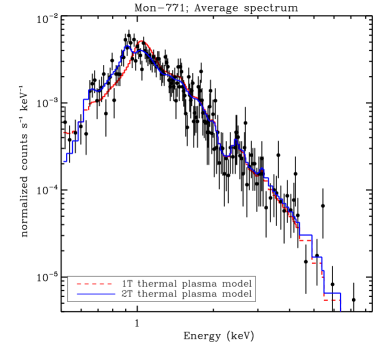
Mon-771: The moderately accreting K4 star Mon-771 has not been classified as a “burster” by Cody et al. (2014). However, its CoRoT light curve during the Chandra observations (Fig. 19) is characterized by several small bursts:
-
•
During #1, the optical emission declines by 5.5%, with a subsequent slow rising phase longer than the whole Chandra observation.
-
•
An intense optical burst is observed during #6.
-
•
Small optical bursts are observed during #2 and #4.
-
•
The small interval #8 is dominated by the rising part of an optical and X-ray flare.
-
•
No interesting features are observed during #3, #5 and #7.
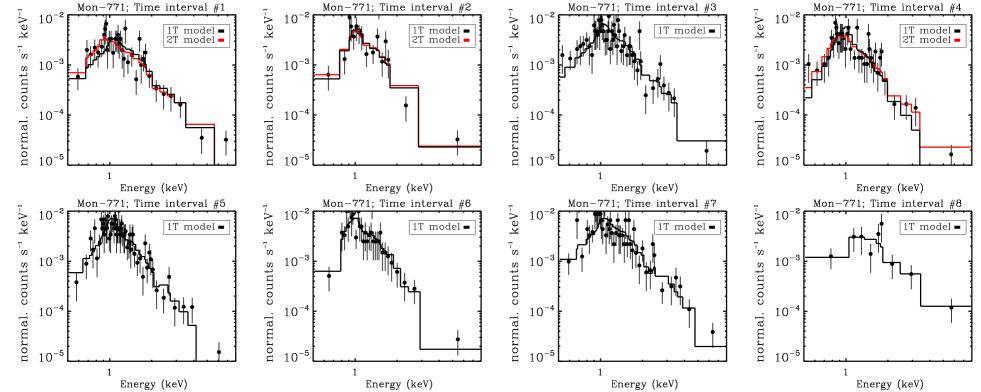
The time-resolved X-ray spectra are well fit by 1T thermal plasma models except in #1, #2, and #4. In #1, an intense soft X-ray spectral component between 0.7 keV and keV may be present. The fit with a 2T thermal plasma model predicting NH=cm-2, kT1=keV, and kT2=keV is acceptable (P%=). Repeating the calculation for the pre-shock velocity, we obtain a value compatible with the free-fall velocity from infinity. Similar results are obtained for #4, where the spectral fit using 2T thermal plasma model is good (P%=) and it predicts NH=cm-2, kT1=keV, and kT2=keV. The spectral fit for the time interval #2 is poorly constrained even using 2T thermal plasma models (P).
Some evidence of intense soft X-ray spectral component is shown in the average spectrum (Fig. 19). The fit of the X-ray spectrum with 1T thermal plasma model is poorly constrained (P), while an acceptable fit is obtained with 2T thermal model (P). This predicts a soft temperature of kT2=keV, which is more likely a cool coronal component.
The variability of the X-ray properties during the defined time intervals is shown in the upper right panels of Fig. 19. They suggest that the X-ray absorption is higher in the time interval #6, dominated by an intense burst. The C-stat contour levels shown in Fig. 19 confirm this conclusion. The NH obtained during the time interval #6 is the only one different than zero at 90% confidence level, and it is significantly larger than the X-ray absorption obtained from the average spectrum observed in the remanding intervals (NH=cm-2, excluding #8 dominated by a flare).

5.5 Stars with disks with periodic and quasi-periodic variability
Periodic optical and X-ray variability can be observed in stars with disks. The emission from accretion hot spots, stellar occultation by circumstellar material, optical darkening due to photospheric dark spots, and enhanced X-ray emission due to coronal active regions can be modulated by stellar rotation. In the sample of NGC 2264 stars with disks observed with CoRoT and Chandra, six stars show periodic behavior in the CoRoT light curve, and three among them, discussed below, have coherent optical vs. X-ray flux variability (Fig. 20).
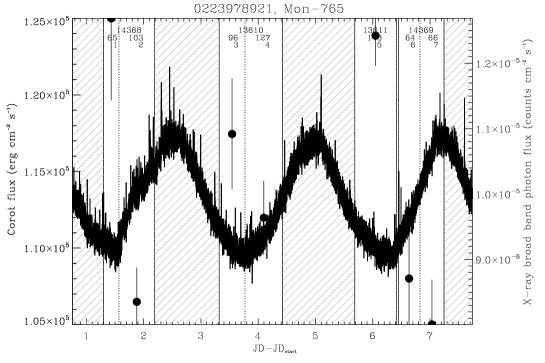
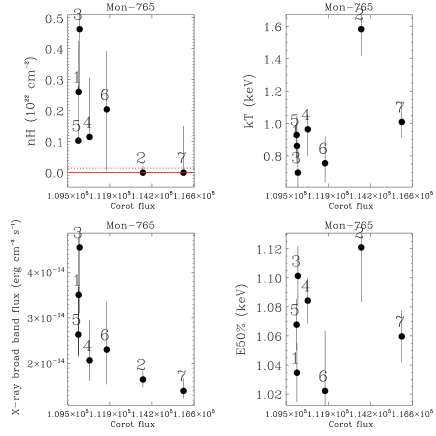
Mon-765: Mon-765 is a moderately accreting K1 star. The CoRoT light curve (top left panel in Fig. 20) shows periodic variability with a period of days. The variability of the X-ray properties is shown in the upper right panels. The plasma temperature does not show significant variability with the exception of the interval #2. The variability of the X-ray and CoRoT fluxes is anticorrelated, as confirmed by a Spearman rank correlation test (=-0.82, P()=0.02). Rather than rotational modulation of accretion hot spots or stellar occultation, this behavior is more likely due to rotational modulation of spatially coincident photospheric dark spots and coronal active regions.
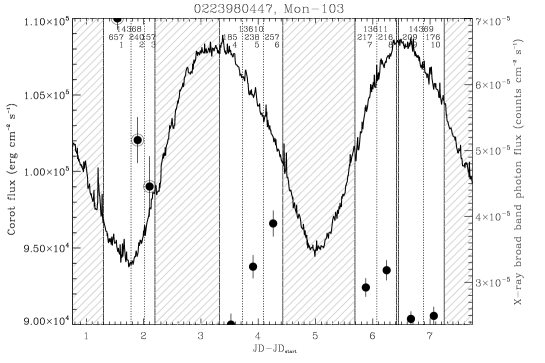
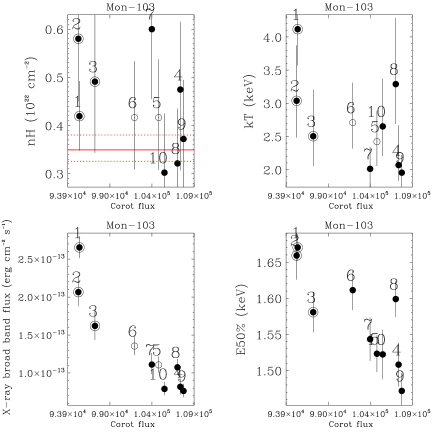
Mon-103: The hypothesis made for Mon-765 holds also for Mon-103, a non-accreting K6 star whose variability are assumed to be due to cold spots by Stauffer et al. (2016). This star has an evacuated inner disk as suggested by its near-infrared colors. The CoRoT light curve of Mon-103 is very regular (central left panel in Fig. 20) and a statistically significant anticorrelation between the optical flux variability and both the X-ray flux and median photon energy variability (respectively, =-0.89, P()=0.006 and =-0.78, P()=0.04, in both cases removing the first three time intervals dominated by flares).
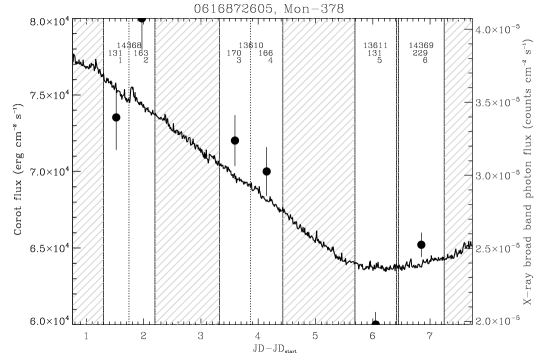
Mon-378: Mon-378 is a K5.5 star with a different behavior than Mon-765 and Mon-103. As reported by Cody et al. (2014), the light curve of this star is likely periodic with superimposed fading episodes likely due to increasing circumstellar extinction. This star has been listed as a star with periodic flux dips in Stauffer et al. (2015). The CoRoT light curve during the four Chandra frames (bottom left panel of Fig. 20) is observed in a decaying phase, which is part of its “periodic” behavior. We do not observe evidence of increasing X-ray absorption during the decline of optical emission, since during all the defined time intervals the X-ray spectral fit admit solutions at low NH within 68% confidence. However the lower right panels show that the optical flux variability is correlated with the X-ray flux variability (=0.94, P()=0.004). This behavior is compatible with the scenario of recurrent occultation of the central star by circumstellar material.
5.6 Summary of observed simultaneous events
The total of stars with disks with good detection with CoRoT and analyzed in this paper (i.e. Sect. 5.3, 5.4, 5.5 and Appendix C) is 51:
-
•
A total of 24 stars are analyzed as “dippers”, i.e. they show dips in their CoRoT light curves occurring during the observations. Among them, in the 7 stars discussed in Sect. 5.3 X-ray absorption increases during the optical dips.
-
•
20 stars are analyzed as “bursters”, i.e. their CoRoT light curves show rapid bursts occurring during the observations. Among them, 5 stars show an intense soft X-ray spectral component typically below 1 keV during the optical bursts, while 2 stars show increasing X-ray absorption during the bursts (Sect. 5.4). It must be noted that 9 stars are analyzed both as “bursters” and “dippers”.
-
•
6 stars have periodic CoRoT light curves.
-
•
8 stars are not analyzed because: i) they do not show any dominant phenomenon, or ii) X-ray detected photons are too few, or iii) their CoRoT mask is contaminated by nearby bright sources.
It is important to understand whether the observed variations of NH in the time intervals can be due to statistical fluctuations rather that real variability. To this aim, we compare the occurrence of time intervals, including flares but excluding intervals with poor X-ray spectral fits, where NH is larger (within at least 1 significance) than the average absorption estimated by spectral fitting to the average spectrum of each star. In the 7 stars discussed in Sect. 5.3 we define in total 60 time intervals, and the X-ray absorption is significantly larger than the individual average value in 13 intervals (21.6% of the cases), and only in two cases (3.3% of the cases) the CoRoT light curves do not decline or show dips during the intervals. In the other stars analyzed as “dippers” NH is larger than the individual average value in 4 time intervals over 103 defined (3.9%), in 2 of which the optical emission declines. Considering together the stars analyzed as “bursters”, those with periodic variability and those not analyzed, NH is larger than the individual average value in 17 time intervals over 145 defined (11.7%), but only in 5 cases (3.4%) the CoRoT light curves clearly do not decline or show dips. In these stars NH is observed to be variable compared to the individual average value in half of the time intervals with respect the stars analyzed in Sect. 5.3. Considering that stars with bursts and those not analyzed because of few detected X-ray photons can show intrinsically variable X-ray absorption, this strongly suggests that observed variability of X-ray absorption in these stars is not dominated by statistical fluctuations.
It is more easy to verify that the observed soft X-ray spectral components below 1 keV in the 5 stars analyzed in Sect. 5.4 is not due to statistical fluctuations. Such spectral component is in fact observed in 13 time intervals over 43 defined for these stars (occurrence of 30.2%). Considering all the other stars analyzed in this paper, we observe 5 possible soft X-ray spectral components below 1 keV (in three cases in stars analyzed as bursters) over 283 time intervals (1.7% of the cases).
6 Discussion & Conclusions
In this paper, we analyze the simultaneous variability in optical (from CoRoT) and X-rays (from Chandra/ACIS-I) of stars with disks in NGC 2264, focusing on two samples of stars, those with dips in their CoRoT light curve due to variable extinction, and those with optical bursts due to accretion.
6.1 The NH/AV ratio during the optical dips
The hypothesis that stars with disks can be affected by variable extinction due to circumstellar material was first introduced by Joy (1945) and Herbst et al. (1994). If circumstellar material is part of large warps at or inside the co-rotation radius in the disk, then the occultation occurs recurrently over several periods, and the dips are deep. These systems are called “AA Tau like” from the star which has been the precursor of this class (Bouvier et al., 1999). The CSI 2264 project has also revealed that much shorter and irregular optical dips can be observed in disk-bearing stars. Stauffer et al. (2015) demonstrate that the most likely explanation for narrow and aperiodic dips is the occultation of the central star by dust trapped in unsteady accretion streams, while larger dips are more likely due to disk warps.

However, in those cases where simultaneous increase of optical extinction and X-ray absorption is observed, discussed in Sect. 5.3, we can attempt to understand the nature of the obscuring material discriminating between dust-free (likely associated with accretion columns) and dust-rich (likely associated with disk warps) material. Two approaches can be adopted.
One method developed by Stauffer et al. (2015) consists in calculating the ratio between the FWHM of the observed dips and the stellar rotation period. The distribution of this ratio is, in fact, observed to be bimodal. Short dips (FWHMdip/P, where FWHMdip is the FWHM of the observed dip and Pstar the stellar rotation period) are due to occultation by accreting material. Long dips (FWHMdip/P) are instead due to occultation by disk warps. We can adopt the rotation periods of NGC 2264 members calculated by Venuti et al. (in preparation) from CoRoT light curves, and calculate the FWHM of the observed dips fitting the dip profile with a Gaussian function.
It is also possible to infer the nature of the obscuring material by calculating the NH/AV ratio during the dip. Warps are in fact located in the inner part of the circumstellar disk, near the co-rotation radius. If the co-rotation radius is larger than the dust sublimation radius, the NH/AV ratio should be that typical of dust-rich circumstellar disks, assumed to be cm-2mag-1 (Burstein & Heiles, 1978; Bohlin et al., 1978). The NH/AV ratio is expected to be larger in dust-depleted accreting material, since only the small m dust particles can be dragged in the gas streams, sublimating as soon as the temperature reaches K-1500 K.


We can infer the AV necessary to reproduce the observed decline of CoRoT flux from the optical flux absorbed during the dip, calculated as the difference between the CoRoT flux observed at the top and at the bottom of the dips, adopting a photometric zero point of 26.6m to convert the CoRoT fluxes into magnitudes, valid for all members brighter than (Flaccomio et al. in preparation), and the extinction law in band from Munari & Carraro (1996). We then compare it with the difference NHdip between the average X-ray spectrum (NHaver) and NH observed during the dip, obtaining NH/AV.
In this calculation, we make some assumptions. We assume that both the photosphere and the coronal active regions are obscured by the same structure, or structures with the same composition. We ignore the size of the obscuring structure with respect to the star. We assume that the disk’s composition and column density is homogeneous. We also ignore that the inner disk is irradiated by energetic UV and X-ray radiation from the central star and it may photoevaporate (i.e. Clarke et al., 2001; Pascucci et al., 2011). This process reduces the amount of gas and likely also the amount of small dust particles in the disk, affecting the NH/Av ratio of the warps.
This calculation is performed over the seven optical dips discussed in Sect. 5.3 where optical extinction and X-ray absorption are observed to increase simultaneously. The physical properties of these dips are summarized in Table 6. In this table, each row corresponds to an observed dip, each star is identified using the “Mon-” name defined by Cody et al. (2014), and we also indicate the time interval containing the observed dip. The CoRoT flux variability during the dip is calculated as , where and are the CoRoT fluxes observed at the bottom and the top of the dip, respectively. Similarly, the variation of the soft X-ray photon flux FX,soft is calculated as , where is the X-ray soft photon flux observed during the time interval before the dip and during the dip. Pstar, AV, NHdip, NHaver, and the FWHMdip are obtained as previously explained. In Table 6, the X-ray properties of the dips observed in Mon-119 are the same since NH is obtained combining the X-ray spectra observed in the two dips.
| Star | Interval | FCoRoT | Av | NHdip | NHaver | NH/Av | FWHMdip | Pstar | FWHMdip/Pstar | FX,soft |
|---|---|---|---|---|---|---|---|---|---|---|
| MON-name | % | mag | cm-2 | cm-2 | cmm-1 | days | days | % | ||
| 119 | 4 | 8.9 | 0.12 | 1.75 | 0.2 | 3.3 | 0.06 | 36.4 | ||
| 119 | 6 | 15.7 | 0.22 | 0.95 | 0.4 | 3.3 | 0.12 | -45.2 | ||
| 412 | 6 | 3.5 | 0.05 | 23.2 | 0.2 | 6.8 | 0.03 | 13.7 | ||
| 456 | 6 | 15.2 | 0.21 | 2.4 | 0.3 | 5.1 | 0.06 | 3.7 | ||
| 774 | 5 | 5.7 | 0.08 | 7.57 | 0.2 | 3.5 | 0.06 | 5.9 | ||
| 1076 | 2 | 10.65 | 0.15 | 11.4 | 2.7 | -7.1 | ||||
| 1167 | 3 | 5.5 | 0.07 | 10.7 | 0.5 | 8.8 | 0.05 | 41.3 |


A rough distinction between dips caused by dust-rich and gas-rich material can be done selecting the dips with NH/Acmmag-1 and NH/Acmmag-1, respectively. This classification is shown in Fig. 21, where dips due to material with different gas-to-dust ratios are marked with different symbols. The two points corresponding to Mon-119 show the values measured during the time intervals #4 and #6, containing two dips.
Only in one dip (Mon-119, interval #6) is it the case that the absorbing material may be dust-rich compared to the other dips (but gas-rich compared with the typical interstellar material). In 3/7 dips the absorbing material is likely dust-depleted, as expected in accreting material, while the remaining 3/7 have intermediate composition. This is confirmed by the distribution of NH/AV vs. FWHMdip/Pstar, shown in Fig. 22. Symbols mark dips with different gas-to-dust ratios as in Fig. 21. All the dips studied in this paper have FWHMdip/P, as expected from occultation by narrow accreting columns. In Fig. 22, the anticorrelation between NH/AV and FWHMdip/Pstar is not statistically significant, according to a Spearman rank correlation test. However, it is interesting to note that the dips due to the most and least dusty obscuring material (i.e., the highest and lowest NH/AV ratio), correspond to the largest and smallest FWHMdip/Pstar ratio, respectively, in agreement with the hypothesis that dips with larger FWHMdip/Pstar are expected to be produced by dust-rich obscuring material.
The lack of dips due to dust-rich material is very likely a selection effect, since we are studying dips occurring in timescales comparable with the Chandra frames, missing those with larger FWHMdip which are expected to be produced by disk warps. Additionally, stars occulted by large disk warps are typically faint both in optical and X-rays, so it is not possible to calculate NH (as in Mon-619 and Mon-717). We are also not very sensitive to small variations of NH. Taking all these effects together, we conclude that our results are clearly biased toward narrow dips due to the accretion stream.
6.2 Global properties of the observed dips
In the 7 dips analyzed in Sect. 6.1 the fraction of absorbed CoRoT flux ranges from 3.5% (corresponding to an increase of optical extinction by 0.05m) to 15.7% (AV increasing by ), with a mean value of 9.3% (the largest CoRoT flux variation observed in the 33 stars with variable extinction is 58.1%, corresponding to AV increasing by ). The FWHM of these seven dips ranges from 0.2 to 2.7 days; six dips are very narrow, with a FWHM ranging from 0.2 days to 0.5 days.
More details on the connections between the optical and X-ray variability during these seven dips are shown in Fig. 23. As shown in the left panel, N varies over a factor 6 while the FWHMdip does not change significantly. The only exception is the dip observed in Mon-1076 which has both the largest FWHMdip and N of the sample. This may suggest that the FWHMdip is related to the extent of the obscuring material with respect to the stellar disk, and a larger extension does not necessarily imply a larger hydrogen column density.
As expected, there is a correlation between NH and 10% photon energy quantiles observed during the dip (not shown here). A weak correlation is still observed when comparing the 10% photon energy quantile observed during the dip (E10%dip) with that observed in the average spectrum (E10%average). A different result is obtained comparing the extinction increment AV with the EE10%average ratio: The increment of optical extinction is larger in those dips with small variations of the 10% photon energy quantile with respect to the average X-ray spectrum. The anticorrelation is significant based on a Spearman rank correlation test.
The direct observation of increasing X-ray absorption during the optical dips is important for two reasons. First, X-rays have an important role in regulating disks evolution. Disk photoevaporation, which is one of the main mechanisms responsible for the dissipation of circumstellar disks (Hollenbach et al., 2000; Alexander et al., 2006) can be induced by incident X-ray photons, which ionize the gas, raising the disk temperature up to K within 1 AU from the central star (Ercolano et al., 2008). The resulting high thermal pressure launches a photoevaporation wind, which results in significant mass loss from the disk. Additionally, the more X-ray photons absorbed by the circumstellar disk, the larger the ionization fraction in the disk, and the more efficient the coupling between disk and stellar magnetic field, enhancing magneto-rotational instabilities (Balbus & Hawley, 1991), and thus enhancing the radial transport of gas across the disk. In this context, it is of particular importance to observe directly that stellar X-rays can be efficiently absorbed by the circumstellar material in the inner disk. To date, the only evidence of interaction between energetic particles and protoplanetary disks is the observation of fluorescent emission lines (Tsujimoto et al., 2005). Second, optical and X-ray flux variability is observed to be correlated only in stars with inner disks and/or actively accreting stars (Sect. 4.2 in this paper and Flaccomio et al. 2010). This correlation is interpreted as due to simultaneous occultation of the stellar photosphere and corona by the circumstellar material. Our study supports this hypothesis and provides further evidence of increasing X-ray absorption during the occultation of the central star by circumstellar material.
6.3 Accretion properties in the stars with optical bursts
In Sect. 5.4, we analyze the stars showing evidence of increasing soft X-ray emission during the optical bursts. In Fig. 24, we investigate whether such a correlation exists during all the optical bursts and in the X-ray spectra of all the accretors, even when optical bursts are not observed. To this aim, we fit the X-ray spectra of all the not accreting stars (class III objects and the class II objects with passive disks, see Sect. 3.3), and the time-resolved X-ray spectra observed in accreting stars during the optical bursts and in intervals not containing bursts, using 2T thermal plasma models. We calculate, then, the ratio between the normalization of the soft and the hard components (Norm.soft/Norm.hard) for each spectrum. The result is shown in Fig. 24, where accreting and non-accreting stars are marked with different symbols, and only the results from statistically significant fits are shown. Even though in Fig. 24 we plot the soft temperatures down to 0 keV, recall that Chandra is not sensitive to very soft X-ray emission, and thus values of kTsoft below 0.1 keV must not be fully trusted. The first result is that in both panels, Norm.soft/Norm.hard is typically larger in accreting stars than in non-accreting stars. A K-S test in both cases indicates that this difference is significant. While in the bottom panel all the time resolved spectra with Norm.soft/Norm.hard500 have kT1 keV, which can not be fully trusted, only a small fraction of the time-revolved spectra during the bursts (top panel) have kT1 keV. This provides evidence for a larger emission measure of cold plasma in accreting stars than in star with no accretion, and confirms the importance of the time- resolved spectral analysis using the optical light curves as a template to isolate the time intervals with optical bursts occurring.
Our study also shed some light on the geometry of accretion in the analyzed stars. It is generally accepted that gas accretion from the inner region of circumstellar disks is driven by stellar magnetic field. Several magnetohydrodynamic models (e.g. Kulkarni & Romanova, 2008; Romanova et al., 2013) show that a stellar dipolar magnetic field inclined with respect to the rotation axis produces two stable accretion streams from the inner region of the disk, near the truncation radius, that impact the stellar surface at near free-fall velocity. This is the “stable accretion” scenario, in which the emission from the hot spots (from optical to soft X-rays) is modulated by stellar rotation in a stable and periodic pattern (McKinney et al., 2012; Čemeljić et al., 2013).
Other existing models (i.e., Romanova et al., 2012; Kurosawa & Romanova, 2013) show that accretion can also occur in an unstable regime, when Rayleigh-Taylor instabilities occurring at the disk-magnetosphere boundary result in short-lived accretion streams falling on the stellar surface (see also Colombo et al., 2016). In this case, the optical light curve is dominated by random, short accretion bursts such as those analyzed in Sect. 5.4 and by Stauffer et al. (2014), whose typical duration is of a few hours, smaller than the rotation periods of stars and thus not compatible with stable accretion streams.
In some of the stars analyzed in Sect. 5.4, i.e. those with an intense soft X-ray spectral component observed during bursts, we can measure the temperature of the plasma responsible for the emission of soft X-rays (kTsoft) during the bursts, which we assume to be associated with the hot accretion spots. Table 7 shows the values of kTsoft and the properties of the accretion streams obtained in these bursts, the resulting values of the pre-shock velocity and free-fall radius, together with the free-fall velocity from infinity and the known H equivalent width. The free-fall radius is omitted in those stars where the pre-shock velocity is not constrained (i.e., when it is compatible with the free-fall velocity from infinity).
| Star | Interval | kTsoft | vpresh | RFF | v∞ | EWHα |
| Mon- | # | keV | km/s | Rstar | km/s | Å |
| 326 | 1 | 394 | 27.9 | |||
| 357 | 7 | |||||
| 370 | 2,4,7,10 | 512 | 113.2 | |||
| 474 | 1 | 423 | 104.7 | |||
| 474 | 6 | 423 | 104.7 | |||
| 808 | 1,2,8 | 519 | 50.2 | |||
| Typically the co-rotation radius Rcor is 5-10 Rstar in T Tauri stars. | ||||||
| In Mon-326 Rcor is 12.3 Rstar | ||||||
In three cases, the soft temperature is about 0.15 keV (Mon-326, Mon-370, and Mon-808), with the highest soft temperatures observed in Mon-474 and the lowest in Mon-357. The calculated pre-shock velocities vary over a wide range, although being well constrained only in two stars, Mon-370 and Mon-808. In these two cases, vpresh is quite similar (about 350-360 km/s). In Mon-370 and Mon-808, also the corresponding free-fall radii are reasonably well constrained, being smaller than the typical co-rotation radii of T Tauri stars (usually ranging between 5 and 10 Rstar, Hartmann et al., 1998; Shu et al., 2000). Considering that we can safely ignore the energy loss during accretion, and thus that our estimate of the free-fall radii is not seriously overestimated, this is compatible with the hypothesis that the small accretion bursts observed in these stars and the resulting soft X-ray emission are likely due to unstable accretion rather than stable accretion streams from the co-rotation radius.
Acknowledgements.
We thank the referee for his/hers comments and suggestions that helped us improving our manuscript. M. G. G., E. F., and G. M. acknowledge the grant PRIN-INAF 2012 (P.I. E. Flaccomio). This research has made use of data from the Chandra X-ray Observatory and the CoRoT satellite. This research also made an extensive use of Xspec software and the NASA’s Astrophysics Data System and Vizier databases, operated at CDS, Strasbourg, France.References
- Alencar et al. (2010) Alencar, S. H. P., Teixeira, P. S., Guimarães, M. M., et al. 2010, A&A, 519, A88
- Alexander et al. (2006) Alexander, R. D., Clarke, C. J., & Pringle, J. E. 2006, MNRAS, 369, 216
- Argiroffi et al. (2011) Argiroffi, C., Flaccomio, E., Bouvier, J., et al. 2011, A&A, 530, A1
- Argiroffi et al. (2012) Argiroffi, C., Maggio, A., Montmerle, T., et al. 2012, ApJ, 752, 100
- Arnaud (1996) Arnaud, K. A. 1996, in Astronomical Society of the Pacific Conference Series, Vol. 101, Astronomical Data Analysis Software and Systems V, ed. G. H. Jacoby & J. Barnes, 17
- Baglin et al. (2006) Baglin, A., Auvergne, M., Barge, P., et al. 2006, in ESA Special Publication, Vol. 1306, The CoRoT Mission Pre-Launch Status - Stellar Seismology and Planet Finding, ed. M. Fridlund, A. Baglin, J. Lochard, & L. Conroy, 33
- Balbus & Hawley (1991) Balbus, S. A. & Hawley, J. F. 1991, ApJ, 376, 214
- Barentsen et al. (2011) Barentsen, G., Vink, J. S., Drew, J. E., et al. 2011, MNRAS, 415, 103
- Bohlin et al. (1978) Bohlin, R. C., Savage, B. D., & Drake, J. F. 1978, ApJ, 224, 132
- Bonito et al. (2014) Bonito, R., Orlando, S., Argiroffi, C., et al. 2014, ApJ, 795, L34
- Bouvier et al. (2007) Bouvier, J., Alencar, S. H. P., Boutelier, T., et al. 2007, A&A, 463, 1017
- Bouvier et al. (1999) Bouvier, J., Chelli, A., Allain, S., et al. 1999, A&A, 349, 619
- Bouvier et al. (2003) Bouvier, J., Grankin, K. N., Alencar, S. H. P., et al. 2003, A&A, 409, 169
- Broos et al. (2010) Broos, P. S., Townsley, L. K., Feigelson, E. D., et al. 2010, ApJ, 714, 1582
- Burstein & Heiles (1978) Burstein, D. & Heiles, C. 1978, ApJ, 225, 40
- Caramazza et al. (2007) Caramazza, M., Flaccomio, E., Micela, G., et al. 2007, A&A, 471, 645
- Clarke et al. (2001) Clarke, C. J., Gendrin, A., & Sotomayor, M. 2001, MNRAS, 328, 485
- Cody & Hillenbrand (2010) Cody, A. M. & Hillenbrand, L. A. 2010, ApJS, 191, 389
- Cody et al. (2014) Cody, A. M., Stauffer, J., Baglin, A., et al. 2014, AJ, 147, 82
- Colombo et al. (2016) Colombo, S., Orlando, S., Peres, G., Argiroffi, C., & Reale, F. 2016, ArXiv e-prints
- Curran et al. (2011) Curran, R. L., Argiroffi, C., Sacco, G. G., et al. 2011, A&A, 526, A104
- Dahm (2008) Dahm, S. E. 2008, The Young Cluster and Star Forming Region NGC 2264, ed. B. Reipurth, 966
- Dahm & Simon (2005) Dahm, S. E. & Simon, T. 2005, AJ, 129, 829
- Damiani et al. (1997) Damiani, F., Maggio, A., Micela, G., & Sciortino, S. 1997, ApJ, 483, 350
- Damiani et al. (2006) Damiani, F., Prisinzano, L., Micela, G., & Sciortino, S. 2006, A&A, 459, 477
- Drew et al. (2008) Drew, J. E., Greimel, R., Irwin, M. J., & Sale, S. E. 2008, MNRAS, 386, 1761
- Ercolano et al. (2008) Ercolano, B., Drake, J. J., Raymond, J. C., & Clarke, C. C. 2008, ApJ, 688, 398
- Espaillat et al. (2007) Espaillat, C., Calvet, N., D’Alessio, P., et al. 2007, ApJ, 670, L135
- Favata et al. (2005) Favata, F., Flaccomio, E., Reale, F., et al. 2005, ApJS, 160, 469
- Feigelson & Decampli (1981) Feigelson, E. D. & Decampli, W. M. 1981, ApJ, 243, L89
- Feigelson & Kriss (1981) Feigelson, E. D. & Kriss, G. A. 1981, ApJ, 248, L35
- Fűrész et al. (2006) Fűrész, G., Hartmann, L. W., Szentgyorgyi, A. H., et al. 2006, ApJ, 648, 1090
- Flaccomio (in preparation) Flaccomio, E. in preparation, ApJ
- Flaccomio et al. (2003) Flaccomio, E., Damiani, F., Micela, G., et al. 2003, ApJ, 582, 398
- Flaccomio et al. (2010) Flaccomio, E., Micela, G., Favata, F., & Alencar, S. P. H. 2010, A&A, 516, L8
- Flaccomio et al. (2006) Flaccomio, E., Micela, G., & Sciortino, S. 2006, A&A, 455, 903
- Flaccomio et al. (2012) Flaccomio, E., Micela, G., & Sciortino, S. 2012, A&A, 548, A85
- Flaccomio et al. (2005) Flaccomio, E., Micela, G., Sciortino, S., et al. 2005, ApJS, 160, 450
- Flaherty et al. (2014) Flaherty, K. M., Muzerolle, J., Wolk, S. J., et al. 2014, ApJ, 793, 2
- Garmire et al. (2003) Garmire, G. P., Bautz, M. W., Ford, P. G., Nousek, J. A., & Ricker, Jr., G. R. 2003, in Society of Photo-Optical Instrumentation Engineers (SPIE) Conference Series, Vol. 4851, X-Ray and Gamma-Ray Telescopes and Instruments for Astronomy., ed. J. E. Truemper & H. D. Tananbaum, 28–44
- Getman et al. (2005) Getman, K. V., Flaccomio, E., Broos, P. S., et al. 2005, ApJS, 160, 319
- Grosso et al. (2007) Grosso, N., Bouvier, J., Montmerle, T., et al. 2007, A&A, 475, 607
- Guarcello et al. (2016) Guarcello, M. G., Drake, J. J., Wright, N. J., et al. 2016, ArXiv e-prints
- Guarcello et al. (2013) Guarcello, M. G., Drake, J. J., Wright, N. J., et al. 2013, ApJ, 773, 135
- Guarcello et al. (2009) Guarcello, M. G., Micela, G., Damiani, F., et al. 2009, A&A, 496, 453
- Haisch et al. (2001) Haisch, Jr., K. E., Lada, E. A., & Lada, C. J. 2001, ApJ, 553, L153
- Hartmann et al. (1998) Hartmann, L., Calvet, N., Gullbring, E., & D’Alessio, P. 1998, ApJ, 495, 385
- Herbst et al. (1994) Herbst, W., Herbst, D. K., Grossman, E. J., & Weinstein, D. 1994, AJ, 108, 1906
- Hernández et al. (2007) Hernández, J., Hartmann, L., Megeath, T., et al. 2007, ApJ, 662, 1067
- Hollenbach et al. (2000) Hollenbach, D. J., Yorke, H. W., & Johnstone, D. 2000, Protostars and Planets IV, 401
- Jardine et al. (2006) Jardine, M., Collier Cameron, A., Donati, J.-F., Gregory, S. G., & Wood, K. 2006, MNRAS, 367, 917
- Joy (1945) Joy, A. H. 1945, ApJ, 102, 168
- Kastner et al. (2002) Kastner, J. H., Huenemoerder, D. P., Schulz, N. S., Canizares, C. R., & Weintraub, D. A. 2002, ApJ, 567, 434
- Koenigl (1991) Koenigl, A. 1991, ApJ, 370, L39
- Kulkarni & Romanova (2008) Kulkarni, A. K. & Romanova, M. M. 2008, MNRAS, 386, 673
- Kurosawa & Romanova (2013) Kurosawa, R. & Romanova, M. M. 2013, MNRAS, 431, 2673
- Lada (1987) Lada, C. J. 1987, in IAU Symposium, Vol. 115, Star Forming Regions, ed. M. Peimbert & J. Jugaku, 1–17
- Lamm et al. (2004) Lamm, M. H., Bailer-Jones, C. A. L., Mundt, R., Herbst, W., & Scholz, A. 2004, A&A, 417, 557
- Maggio et al. (2007) Maggio, A., Flaccomio, E., Favata, F., et al. 2007, ApJ, 660, 1462
- Mamajek (2009) Mamajek, E. E. 2009, in American Institute of Physics Conference Series, Vol. 1158, American Institute of Physics Conference Series, ed. T. Usuda, M. Tamura, & M. Ishii, 3–10
- McGinnis et al. (2015) McGinnis, P. T., Alencar, S. H. P., Guimaraes, M. M., et al. 2015, ArXiv e-prints
- McKinney et al. (2012) McKinney, J. C., Tchekhovskoy, A., & Blandford, R. D. 2012, MNRAS, 423, 3083
- Ménard et al. (2003) Ménard, F., Bouvier, J., Dougados, C., Mel’nikov, S. Y., & Grankin, K. N. 2003, A&A, 409, 163
- Montmerle (1996) Montmerle, T. 1996, in Astronomical Society of the Pacific Conference Series, Vol. 109, Cool Stars, Stellar Systems, and the Sun, ed. R. Pallavicini & A. K. Dupree, 405–+
- Morales-Calderón et al. (2011) Morales-Calderón, M., Stauffer, J. R., Hillenbrand, L. A., et al. 2011, ApJ, 733, 50
- Munari & Carraro (1996) Munari, U. & Carraro, G. 1996, A&A, 314, 108
- Muzerolle et al. (2010) Muzerolle, J., Allen, L. E., Megeath, S. T., Hernández, J., & Gutermuth, R. A. 2010, ApJ, 708, 1107
- Park et al. (2000) Park, B.-G., Sung, H., Bessell, M. S., & Kang, Y. H. 2000, AJ, 120, 894
- Pascucci et al. (2011) Pascucci, I., Sterzik, M., Alexander, R. D., et al. 2011, ApJ, 736, 13
- Ramírez et al. (2004) Ramírez, S. V., Rebull, L., Stauffer, J., et al. 2004, AJ, 127, 2659
- Rebull et al. (2002) Rebull, L. M., Makidon, R. B., Strom, S. E., et al. 2002, AJ, 123, 1528
- Robitaille et al. (2007) Robitaille, T. P., Whitney, B. A., Indebetouw, R., & Wood, K. 2007, ApJS, 169, 328
- Romanova et al. (2012) Romanova, M. M., Ustyugova, G. V., Koldoba, A. V., & Lovelace, R. V. E. 2012, MNRAS, 421, 63
- Romanova et al. (2013) Romanova, M. M., Ustyugova, G. V., Koldoba, A. V., & Lovelace, R. V. E. 2013, MNRAS, 430, 699
- Rucinski et al. (2008) Rucinski, S. M., Matthews, J. M., Kuschnig, R., et al. 2008, MNRAS, 391, 1913
- Samadi et al. (2006) Samadi, R., Fialho, F., Costa, J. E. S., et al. 2006, in ESA Special Publication, Vol. 1306, ESA Special Publication, ed. M. Fridlund, A. Baglin, J. Lochard, & L. Conroy, 317
- Schmitt et al. (2005) Schmitt, J. H. M. M., Robrade, J., Ness, J.-U., Favata, F., & Stelzer, B. 2005, A&A, 432, L35
- Schwartz et al. (1985) Schwartz, P. R., Thronson, Jr., H. A., Odenwald, S. F., et al. 1985, ApJ, 292, 231
- Shu et al. (2000) Shu, F. H., Najita, J. R., Shang, H., & Li, Z.-Y. 2000, Protostars and Planets IV, 789
- Siess et al. (2000) Siess, L., Dufour, E., & Forestini, M. 2000, A&A, 358, 593
- Smith et al. (2001) Smith, R. K., Brickhouse, N. S., Liedahl, D. A., & Raymond, J. C. 2001, ApJ, 556, L91
- Stassun et al. (2007) Stassun, K. G., van den Berg, M., & Feigelson, E. 2007, ApJ, 660, 704
- Stassun et al. (2006) Stassun, K. G., van den Berg, M., Feigelson, E., & Flaccomio, E. 2006, ApJ, 649, 914
- Stauffer et al. (2014) Stauffer, J., Cody, A. M., Baglin, A., et al. 2014, AJ, 147, 83
- Stauffer et al. (2015) Stauffer, J., Cody, A. M., McGinnis, P., et al. 2015, ArXiv e-prints
- Stauffer et al. (2016) Stauffer, J., Cody, A. M., Rebull, L., et al. 2016, AJ, 151, 60
- Stelzer & Schmitt (2004) Stelzer, B. & Schmitt, J. H. M. M. 2004, A&A, 418, 687
- Störzer & Hollenbach (1999) Störzer, H. & Hollenbach, D. 1999, ApJ, 515, 669
- Sung et al. (2008) Sung, H., Bessell, M. S., Chun, M.-Y., Karimov, R., & Ibrahimov, M. 2008, AJ, 135, 441
- Sung et al. (2009) Sung, H., Stauffer, J. R., & Bessell, M. S. 2009, AJ, 138, 1116
- Teixeira et al. (2012) Teixeira, P. S., Lada, C. J., Marengo, M., & Lada, E. A. 2012, A&A, 540, A83
- Testi et al. (2014) Testi, L., Birnstiel, T., Ricci, L., et al. 2014, ArXiv e-prints
- Tsujimoto et al. (2005) Tsujimoto, M., Feigelson, E. D., Grosso, N., et al. 2005, ApJS, 160, 503
- Čemeljić et al. (2013) Čemeljić, M., Shang, H., & Chiang, T.-Y. 2013, ApJ, 768, 5
- Venuti et al. (2014) Venuti, L., Bouvier, J., Flaccomio, E., et al. 2014, A&A, 570, A82
- Venuti et al. (2015) Venuti, L., Bouvier, J., Irwin, J., et al. 2015, A&A, 581, A66
- Weisskopf et al. (2002) Weisskopf, M. C., Brinkman, B., Canizares, C., et al. 2002, PASP, 114, 1
- Wilms et al. (2000) Wilms, J., Allen, A., & McCray, R. 2000, ApJ, 542, 914
- Wolk et al. (2013) Wolk, S. J., Rice, T. S., & Aspin, C. 2013, ApJ, 773, 145
Appendix A Time resolved X-ray spectra of the stars with optical dips discussed in Sect. 5.3
In this appendix we show the X-ray spectra observed in the time intervals defined for those stars with dips and with simultaneous increase of X-ray absorption, discussed in Sect. 5.3.
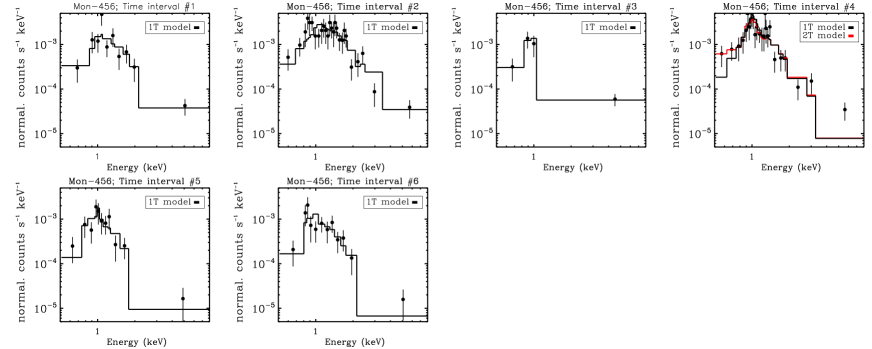
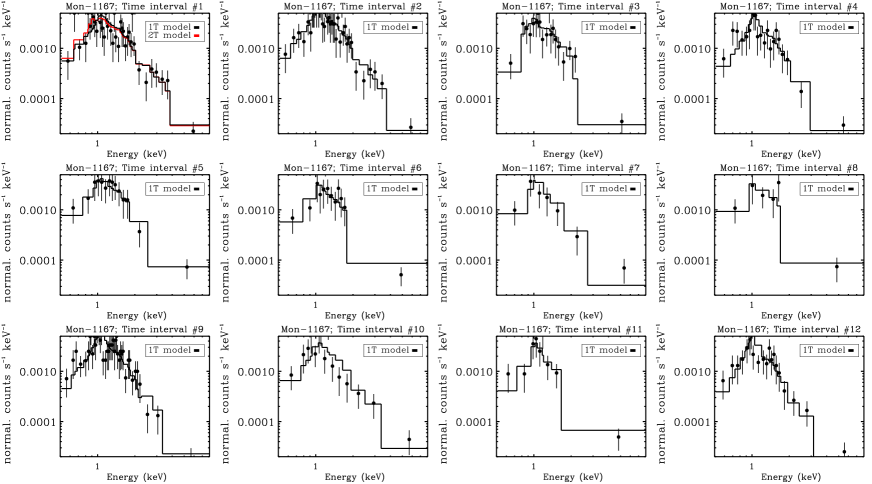
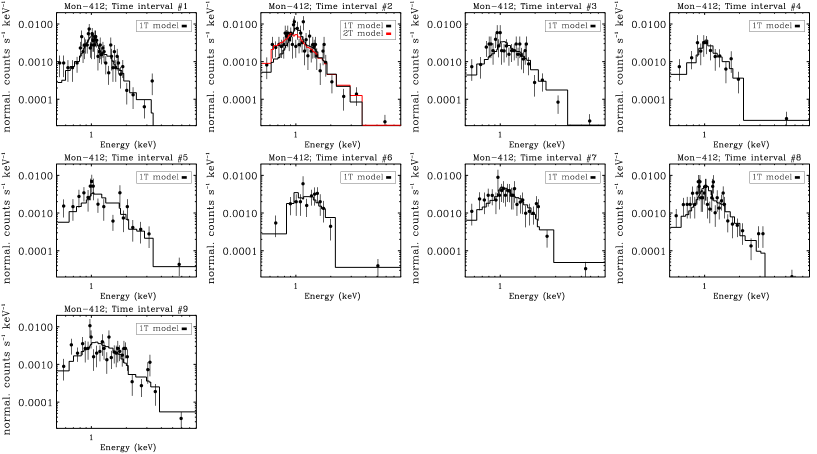
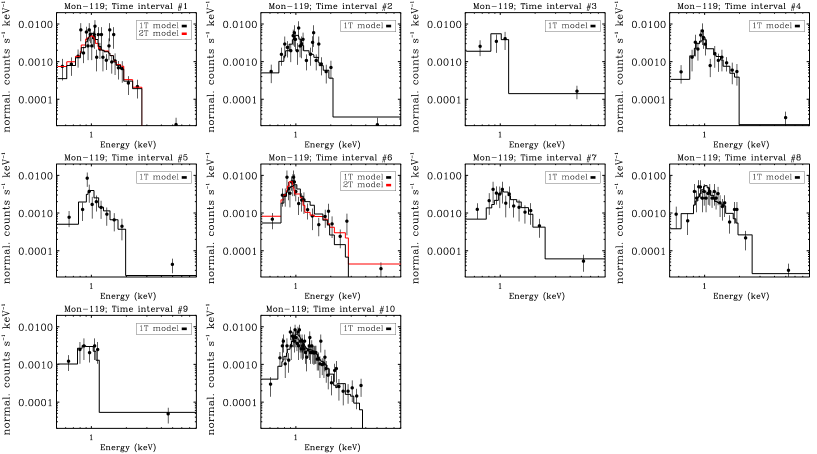

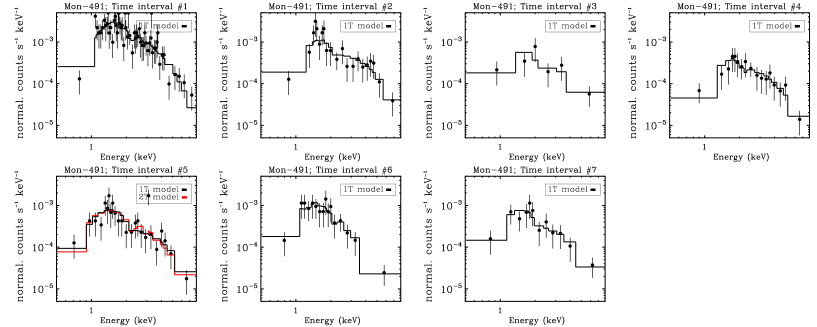
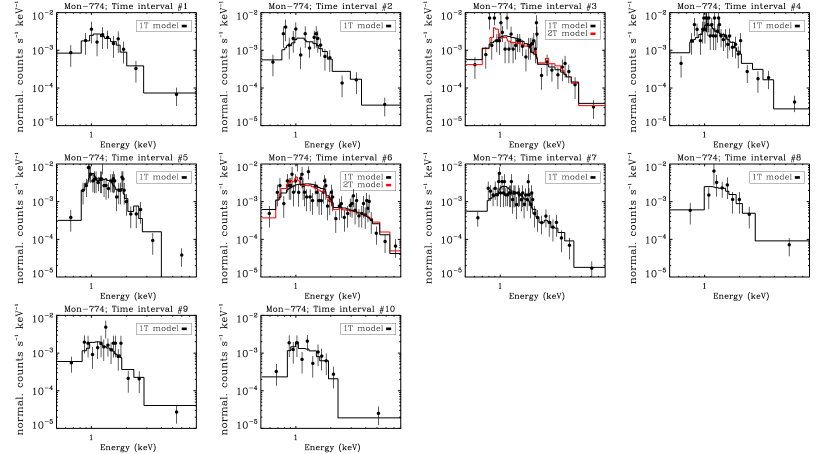

Appendix B Time variability of the 10% photon energy quantile in stars discussed in the paper
In this appendix, we show how the 10% photon energy quantile changes with time in the stars discussed in the paper. For each star, the time bin used to sample the variability of E10% is the shortest one resulting in a relative error (E10%)/E10% smaller than the threshold shown in the title of each panel. The values of E10% are marked with blue dots and the red lines indicate the size of the time bin. In each panel, we also show the observed CoRoT light curve, observed during the Chandra frames with the time intervals dominated by X-ray flares covered in black. These figures help us to understand how the soft X-ray spectrum of these stars changes over the time independently from the time sampling based on the optical variability. (Note that the larger NH the larger E10%, while the larger flux below 1 keV the lower E10%.)
![[Uncaptioned image]](/html/1701.04842/assets/x84.png)
![[Uncaptioned image]](/html/1701.04842/assets/x85.png)
![[Uncaptioned image]](/html/1701.04842/assets/x86.png)
![[Uncaptioned image]](/html/1701.04842/assets/x87.png)
![[Uncaptioned image]](/html/1701.04842/assets/x88.png)
![[Uncaptioned image]](/html/1701.04842/assets/x89.png)
![[Uncaptioned image]](/html/1701.04842/assets/x90.png)
![[Uncaptioned image]](/html/1701.04842/assets/x91.png)
![[Uncaptioned image]](/html/1701.04842/assets/x92.png)
![[Uncaptioned image]](/html/1701.04842/assets/x93.png)
![[Uncaptioned image]](/html/1701.04842/assets/x94.png)
![[Uncaptioned image]](/html/1701.04842/assets/x95.png)
![[Uncaptioned image]](/html/1701.04842/assets/x96.png)
![[Uncaptioned image]](/html/1701.04842/assets/x97.png)
![[Uncaptioned image]](/html/1701.04842/assets/x98.png)
Appendix C Optical and X-ray light variability of disk bearing stars not discussed in the paper
In this appendix, we show the optical and X-ray variability and the time resolved X-ray spectra of those stars with disks observed with CoRoT and Chandra which have not been discussed in the paper for the reasons explained in each caption. For each star, we show the CoRoT light curve observed during the four Chandra frames; the X-ray spectra observed in the time intervals; the variability of the following X-ray properties: NH (in units of cm-2), and kT (in keV), together with that of the 10% and 25% photon energy quantiles (in keV) for the stars analyzed “dippers”; kT and the 10%, 25%, and 50% photon energy quantiles for the stars analyzed as “bursters”; NH, kT, FX (in erg cms-1), and the median photon energy for the stars analyzed as periodic or quasi-periodic variable stars. We also show the variability of E10% as in the Appendix B.
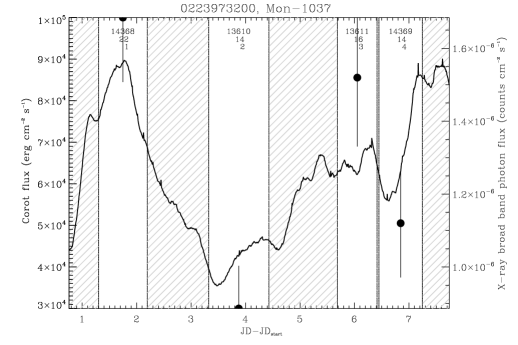
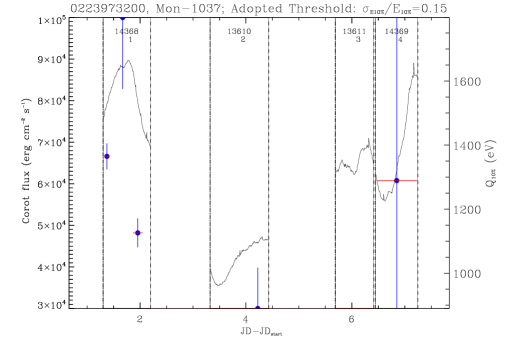


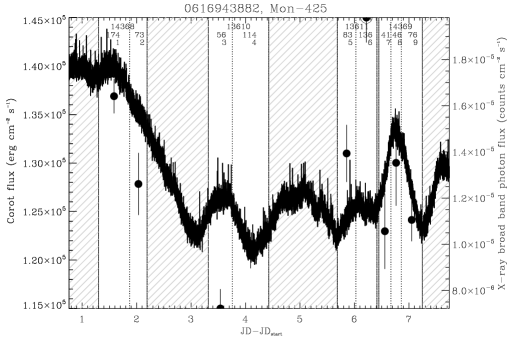
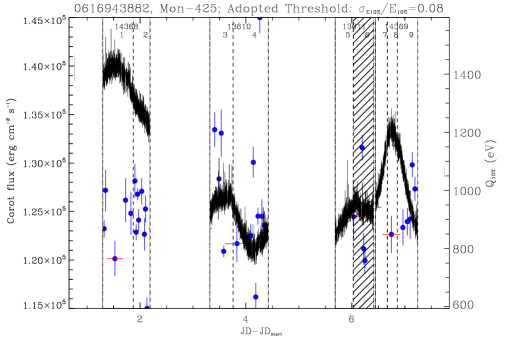
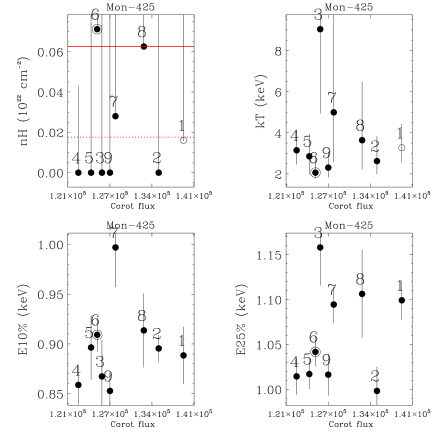
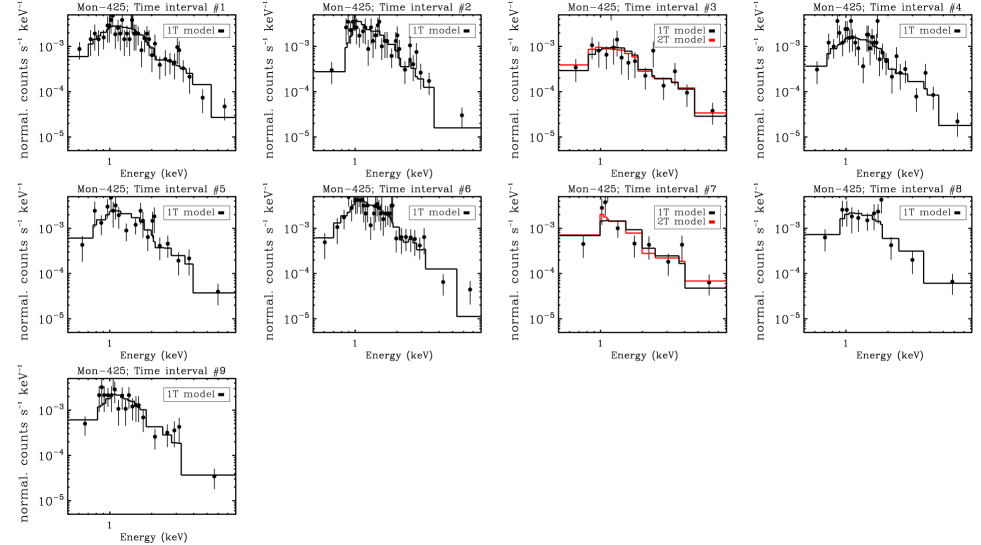
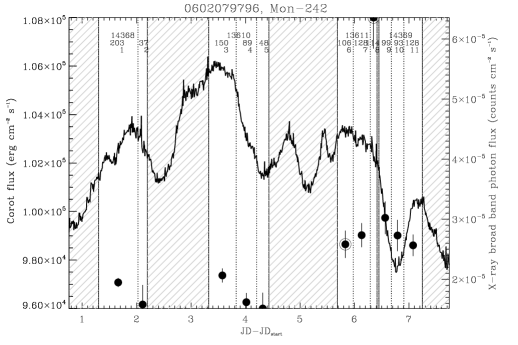
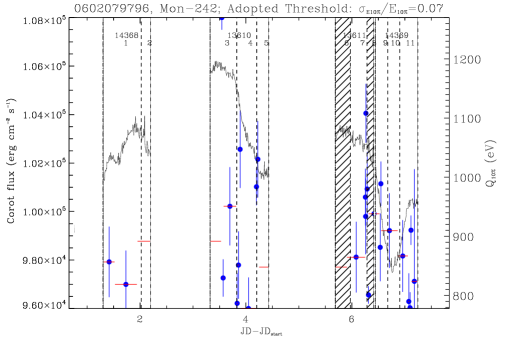
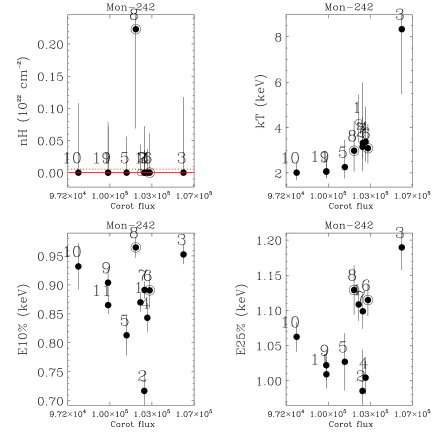
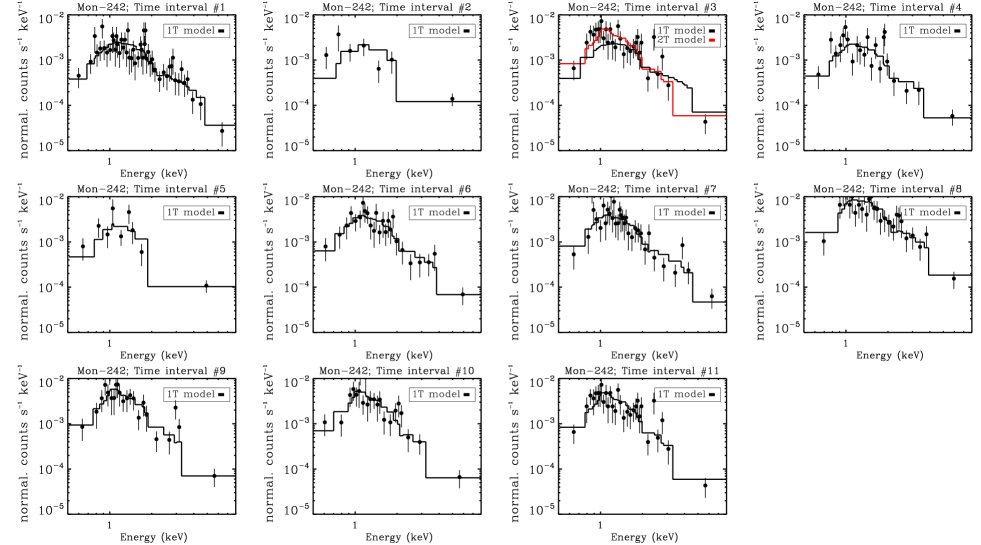
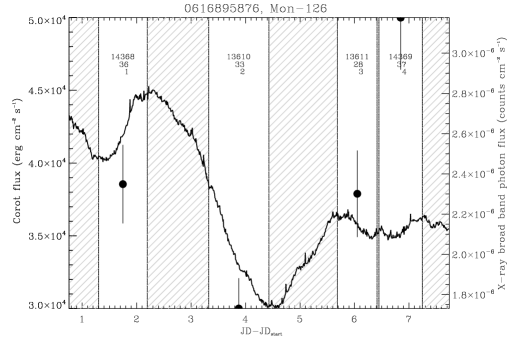
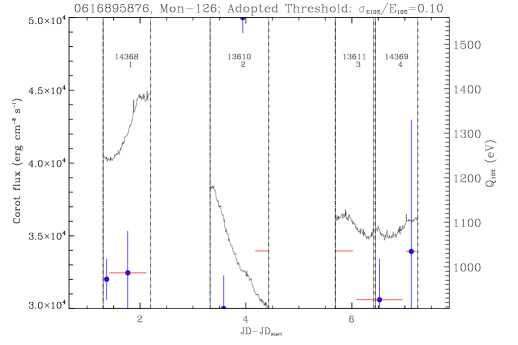
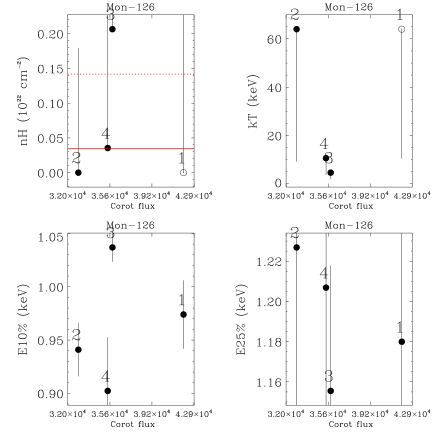

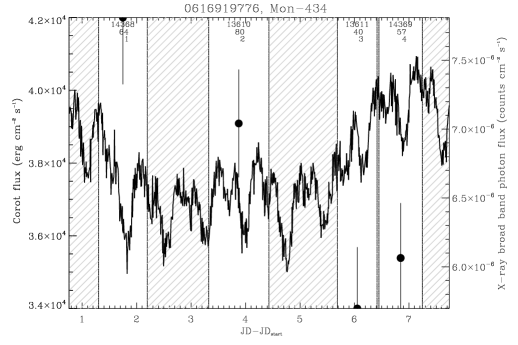
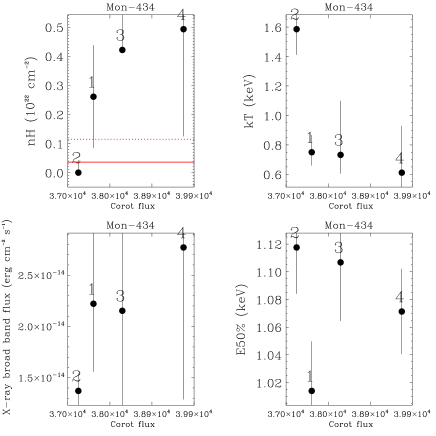

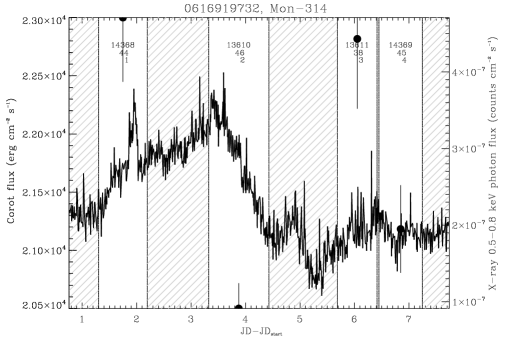
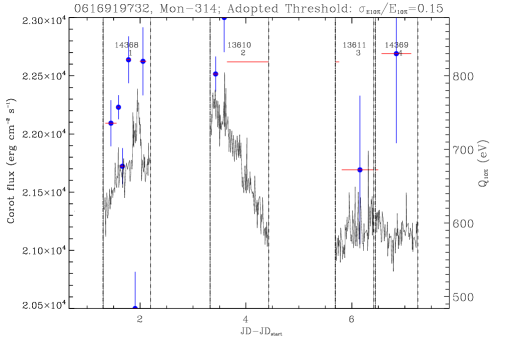


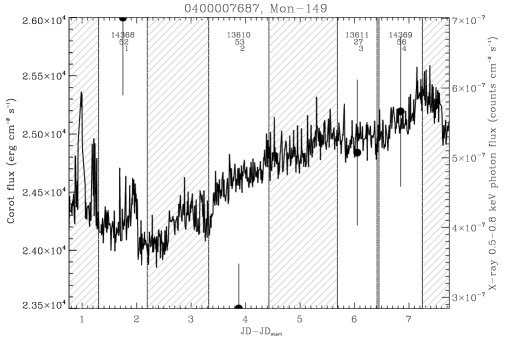
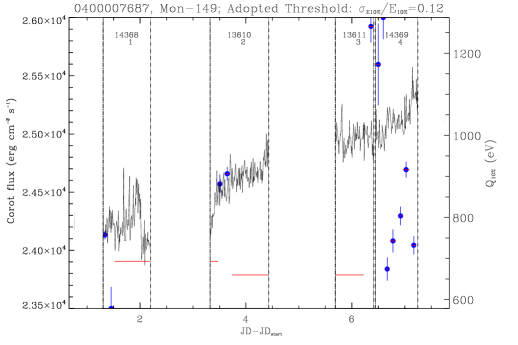


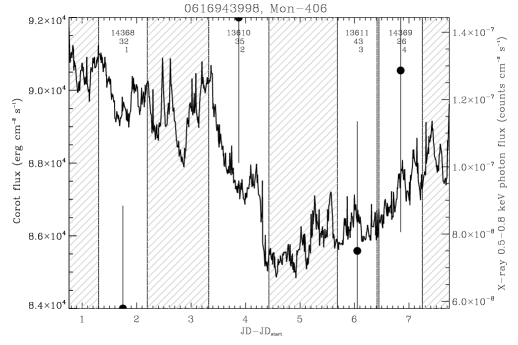
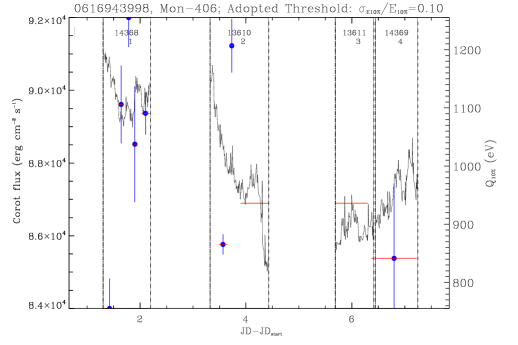


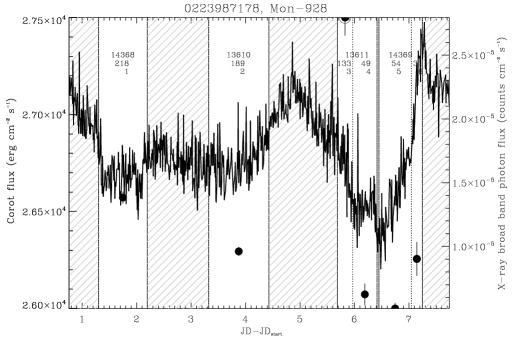
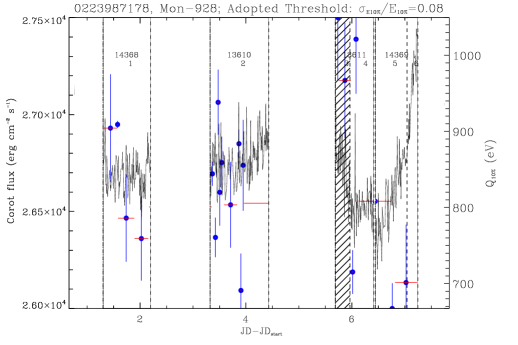
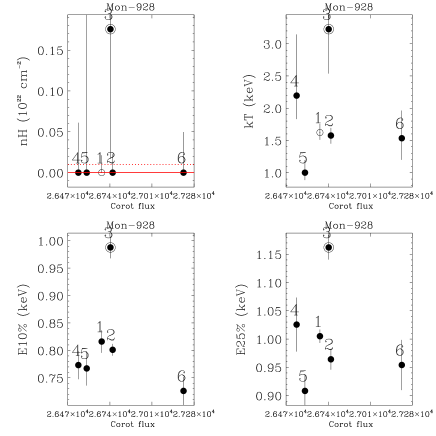

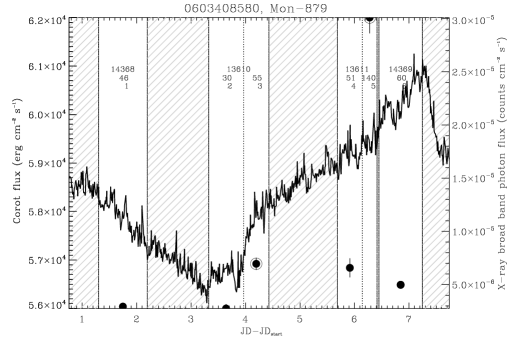
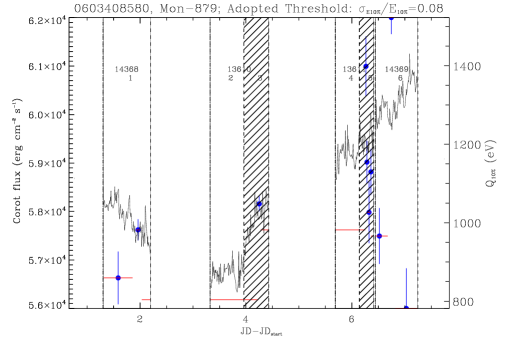


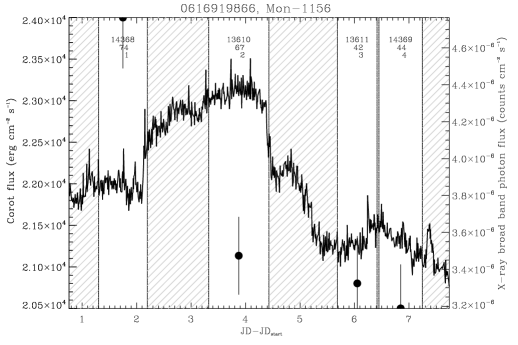
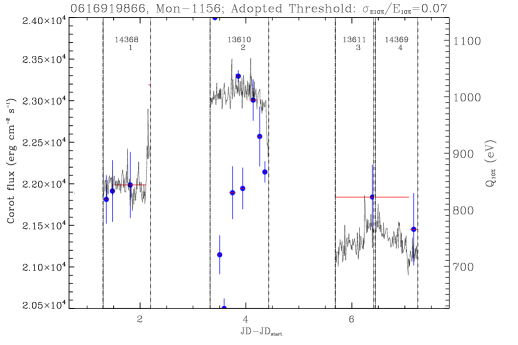


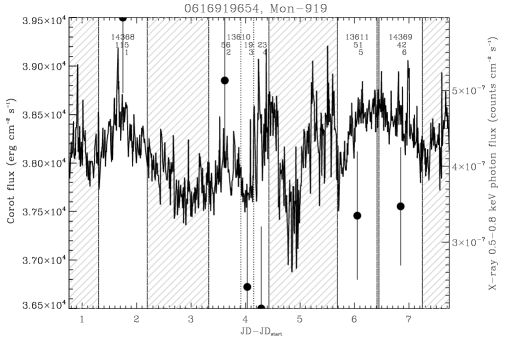
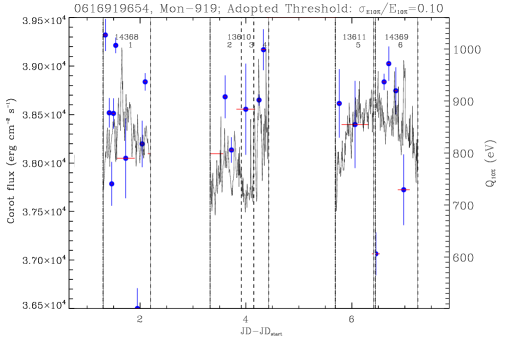
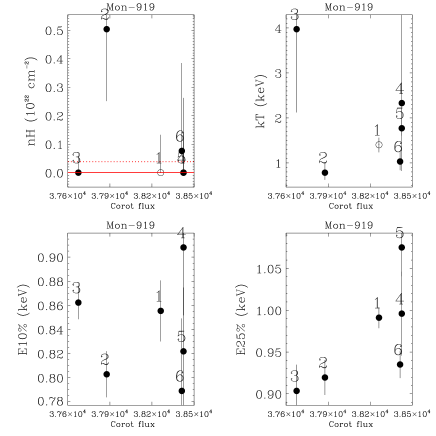

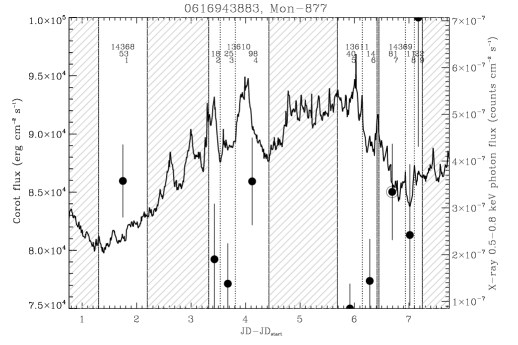
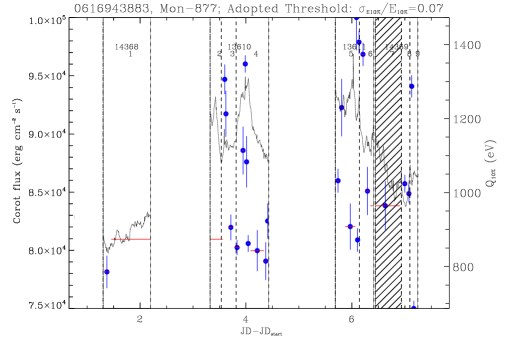
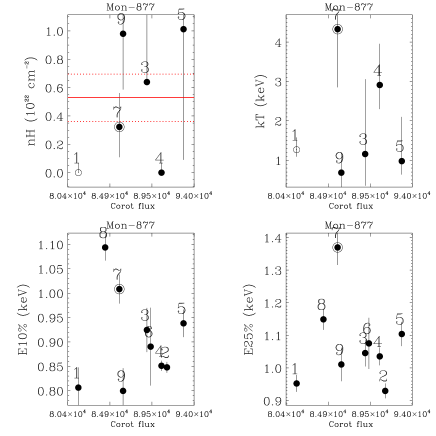

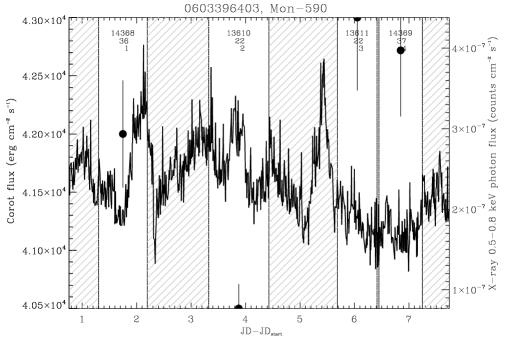
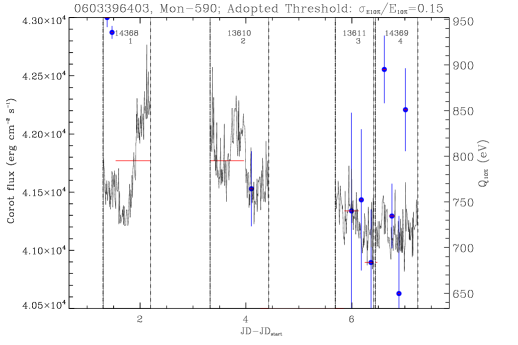
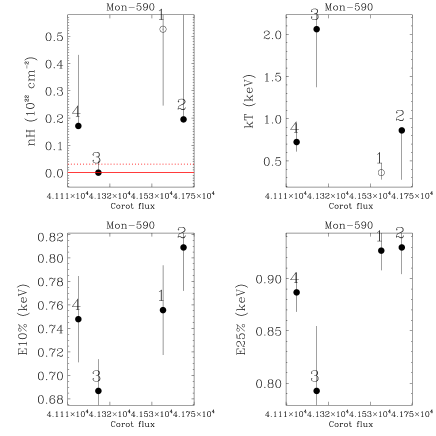

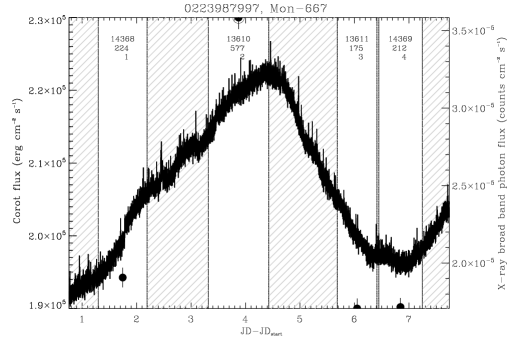
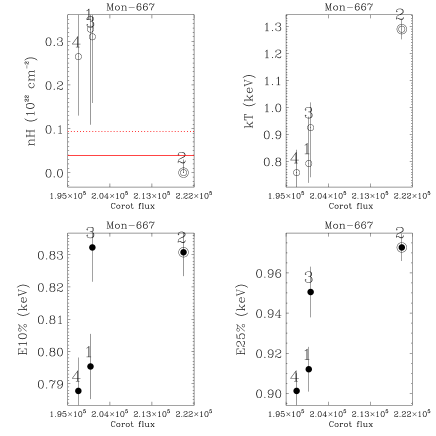
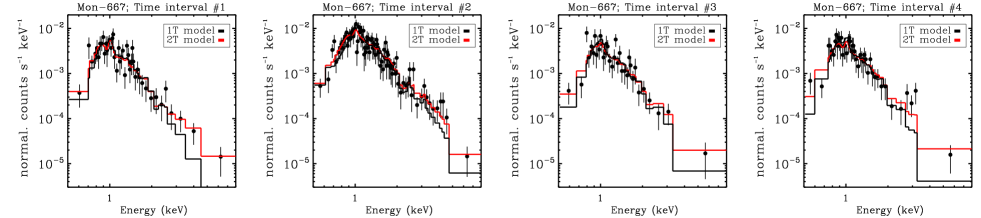
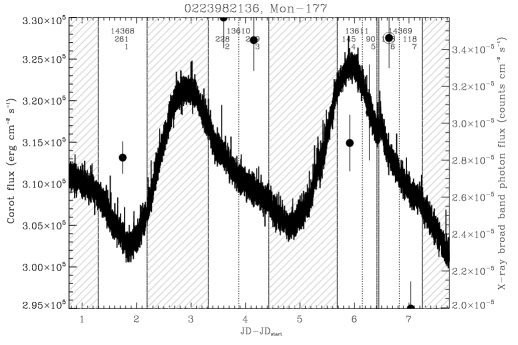
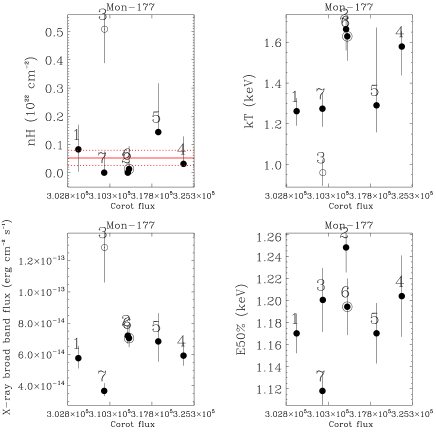
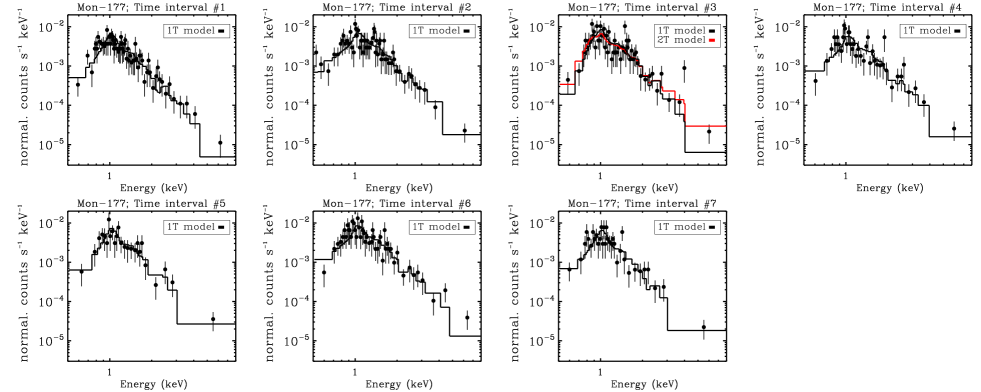
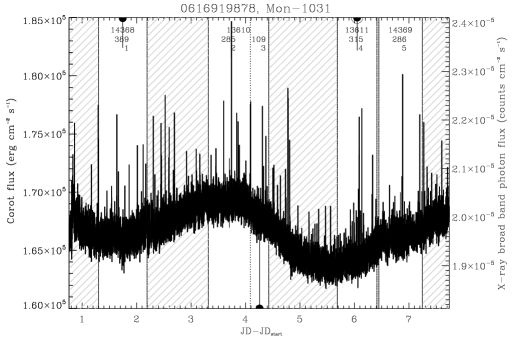
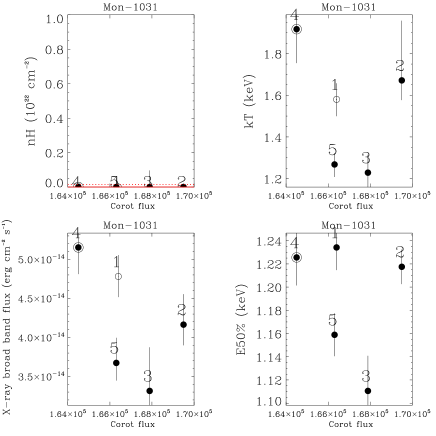
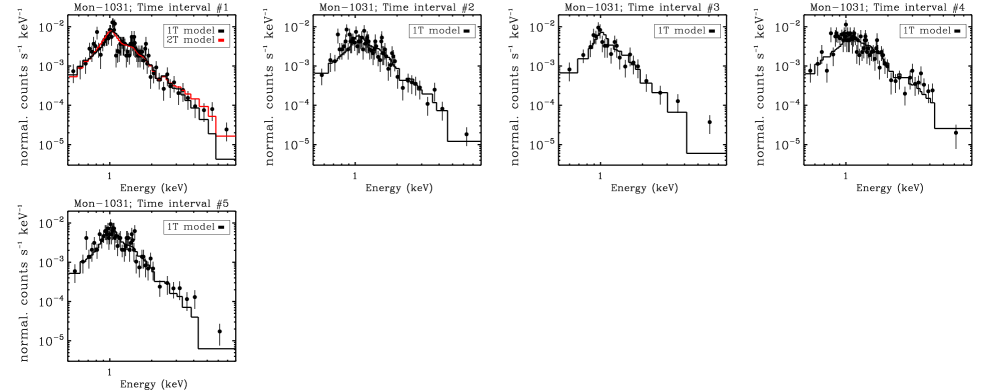
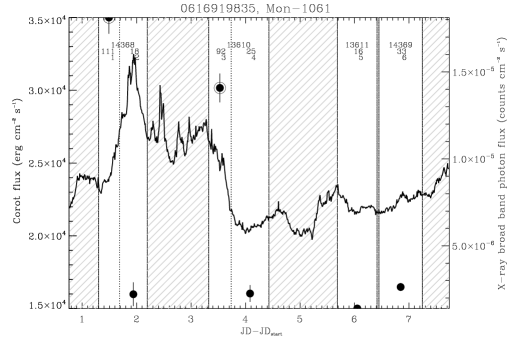
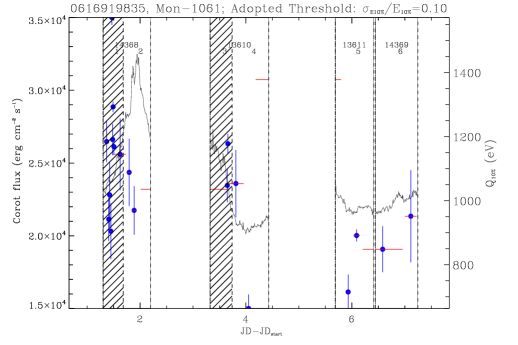
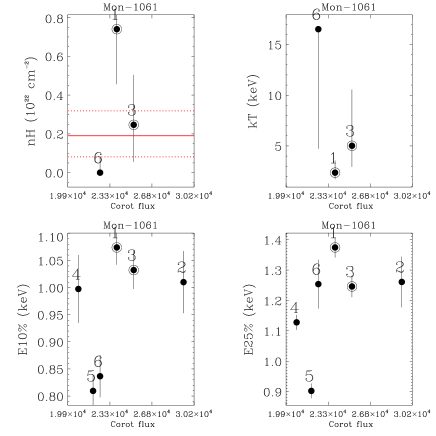

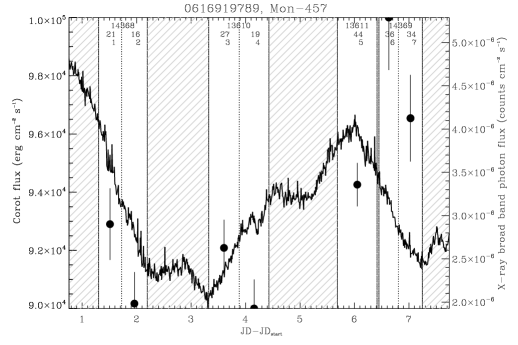
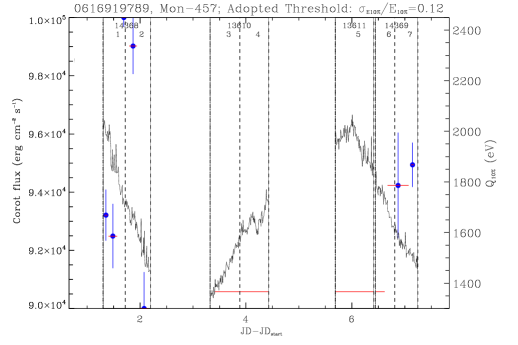
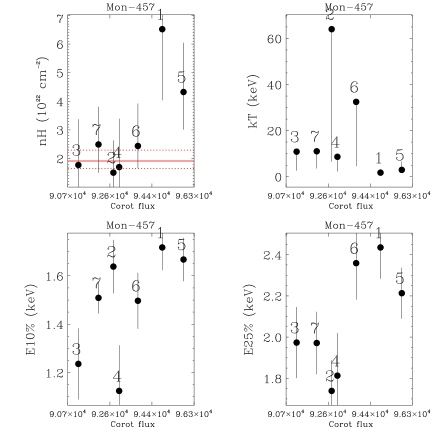

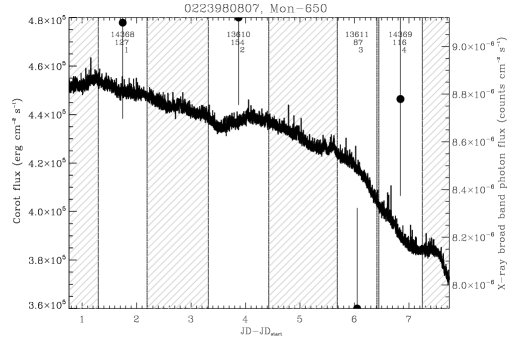

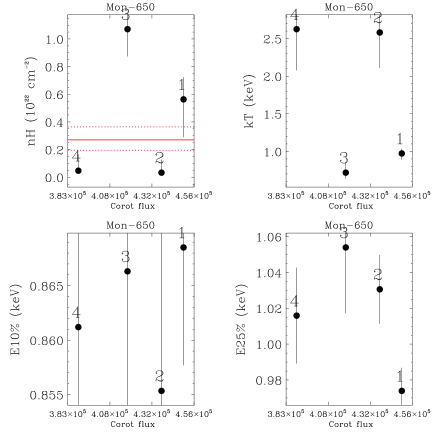

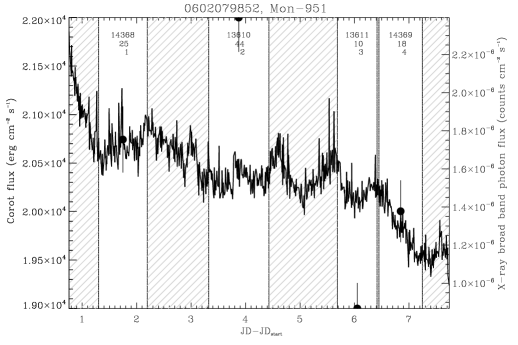
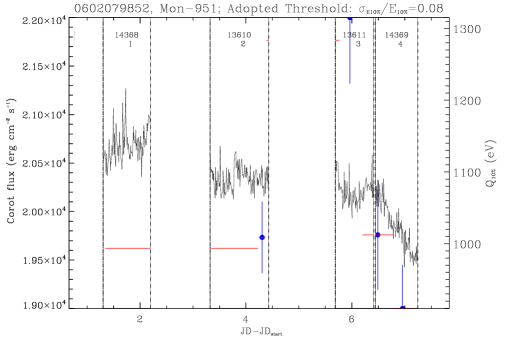
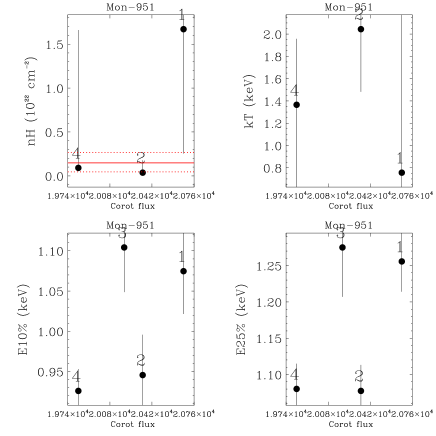

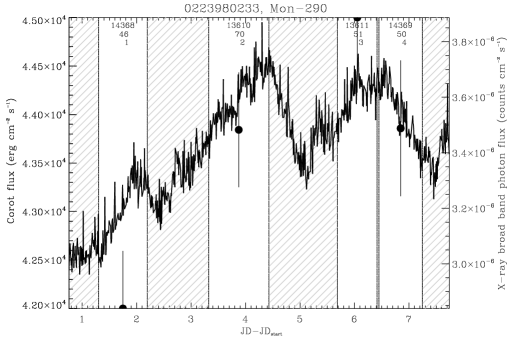
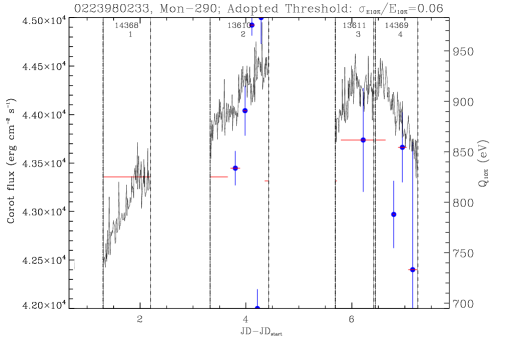
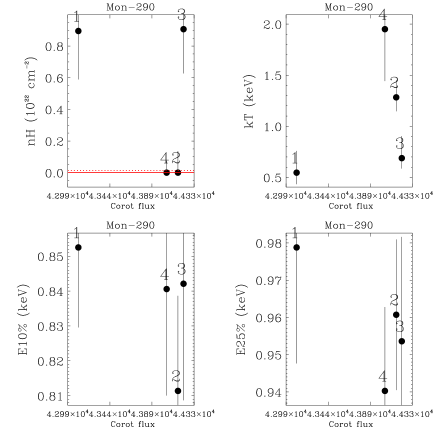

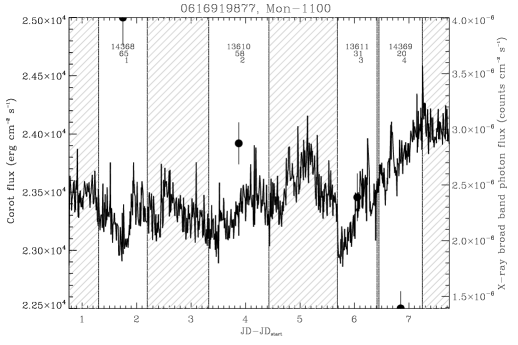
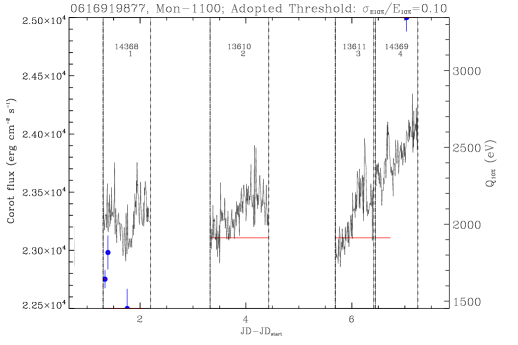
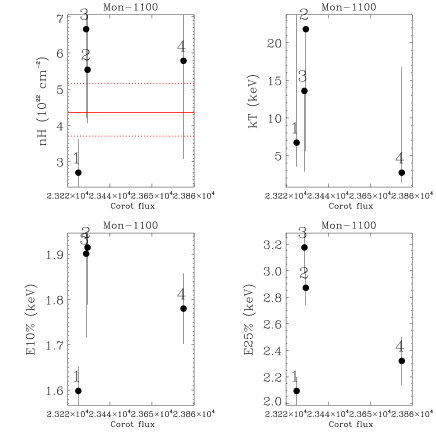

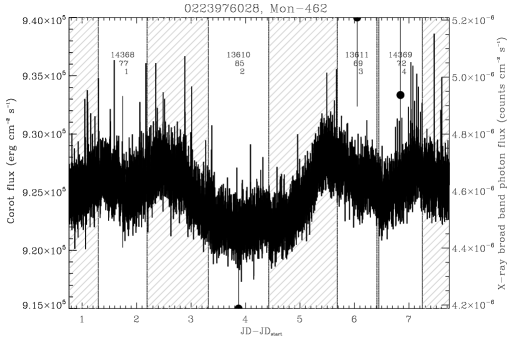
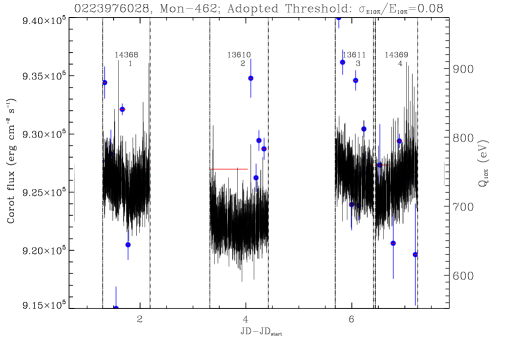
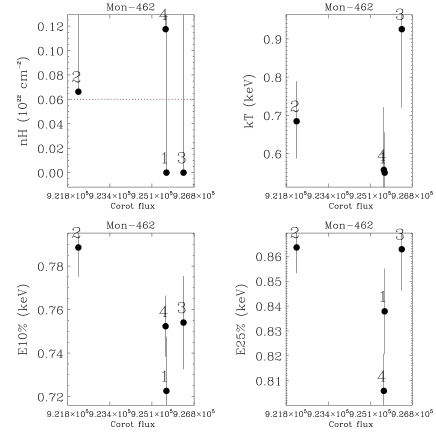

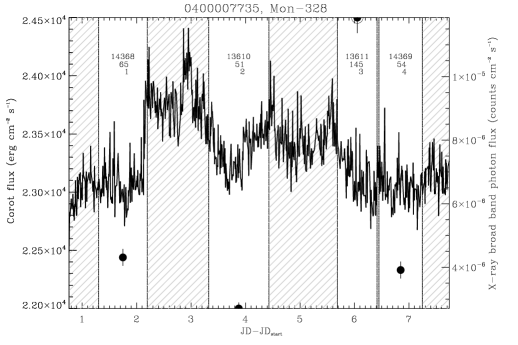
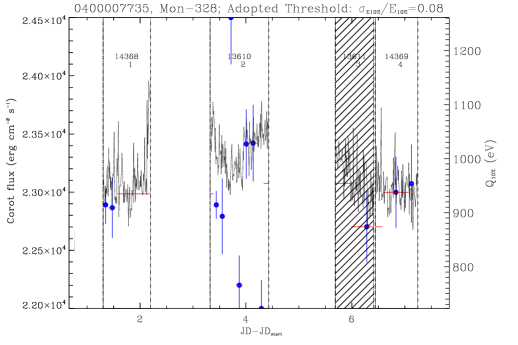
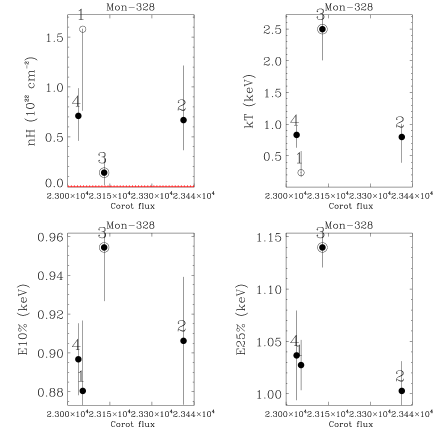
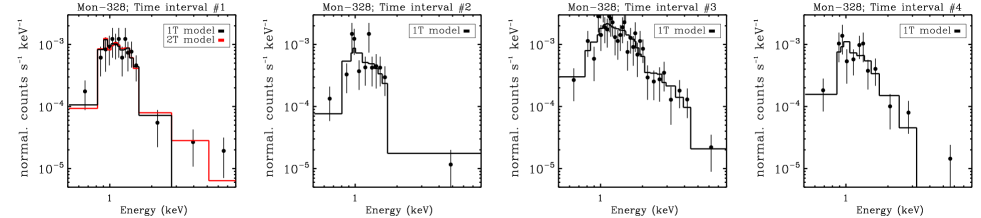
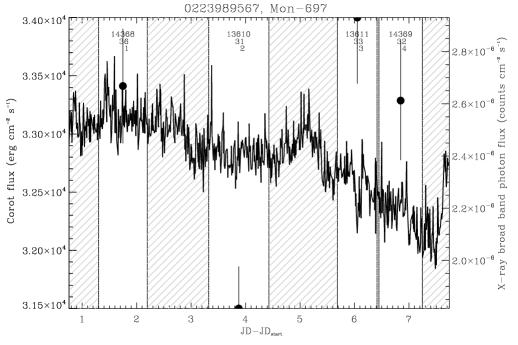
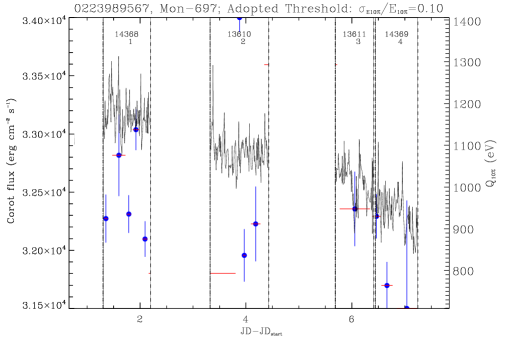
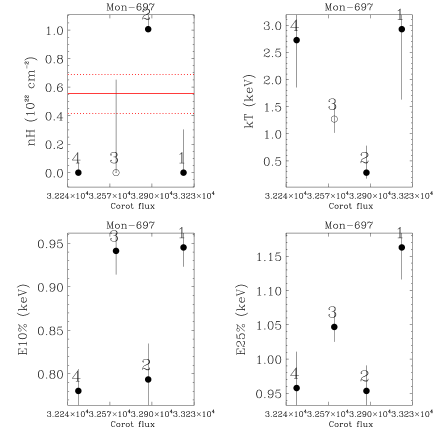

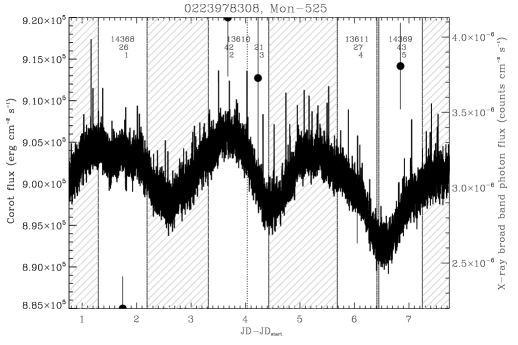
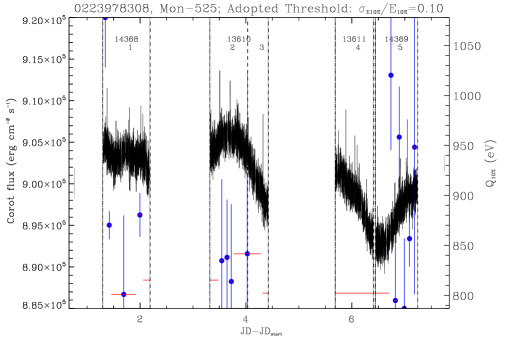
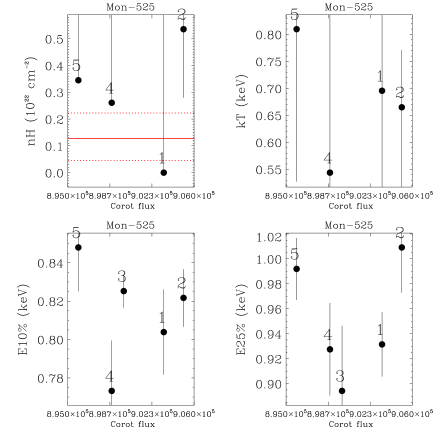

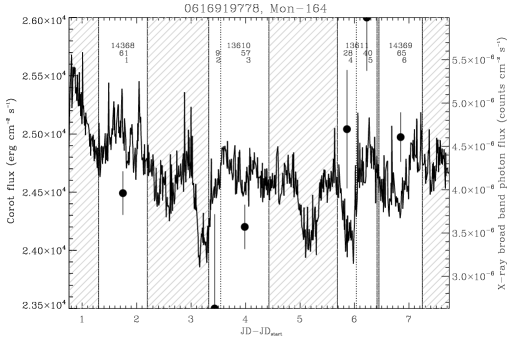
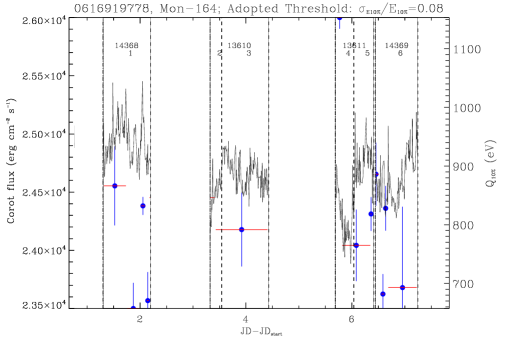
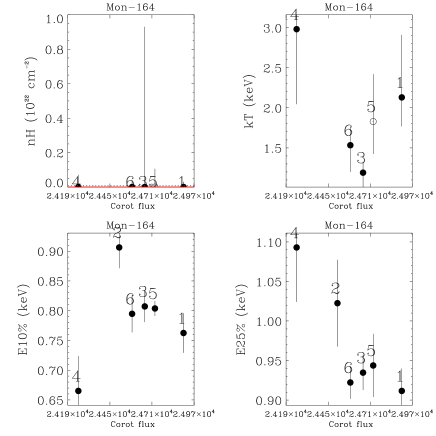
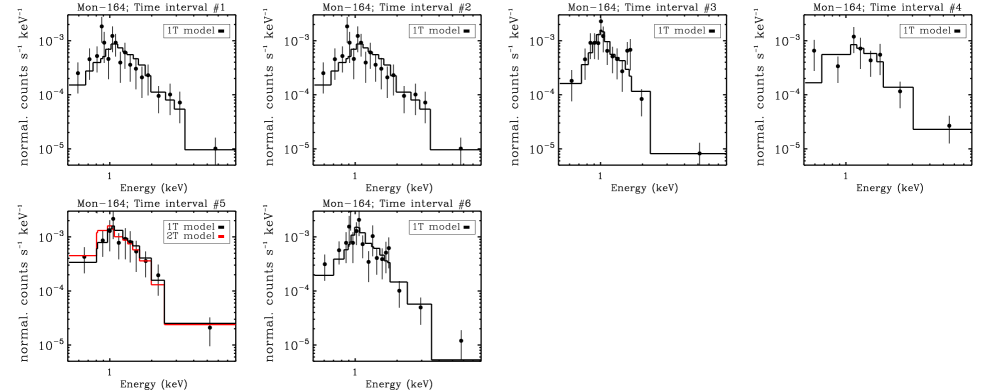
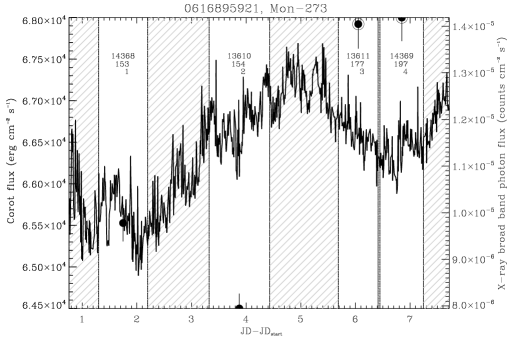
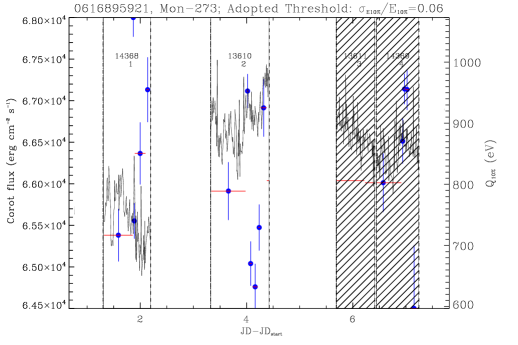
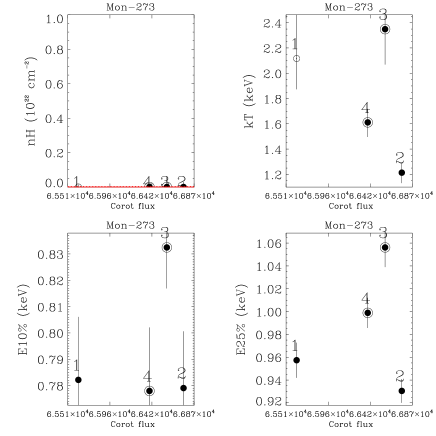

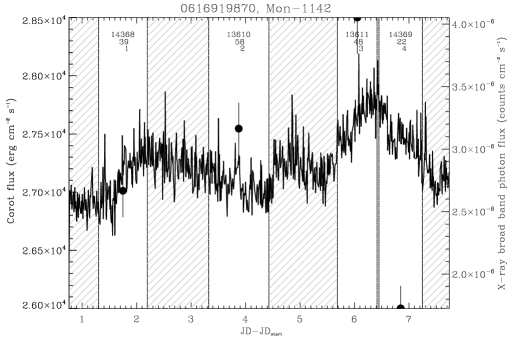
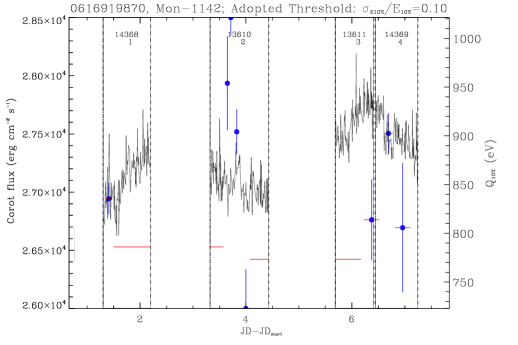
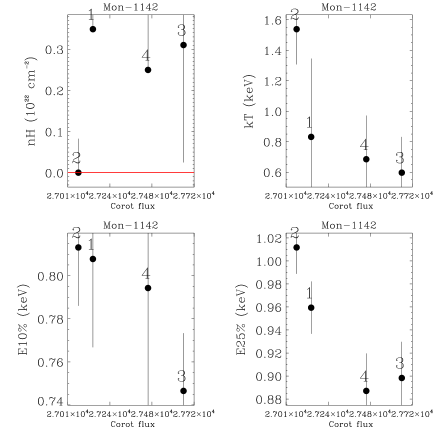

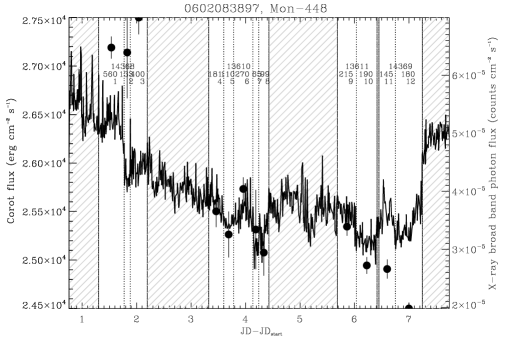
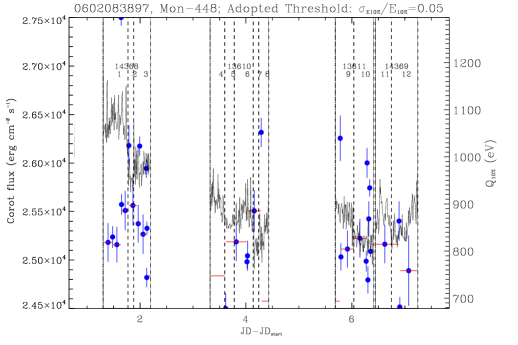
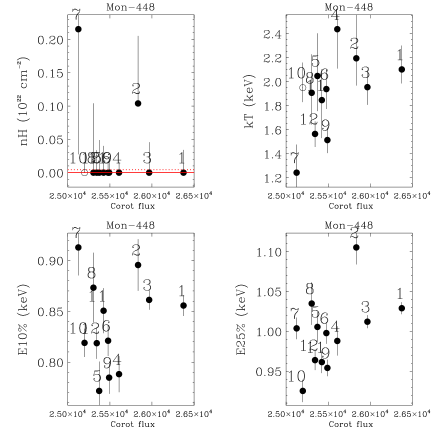
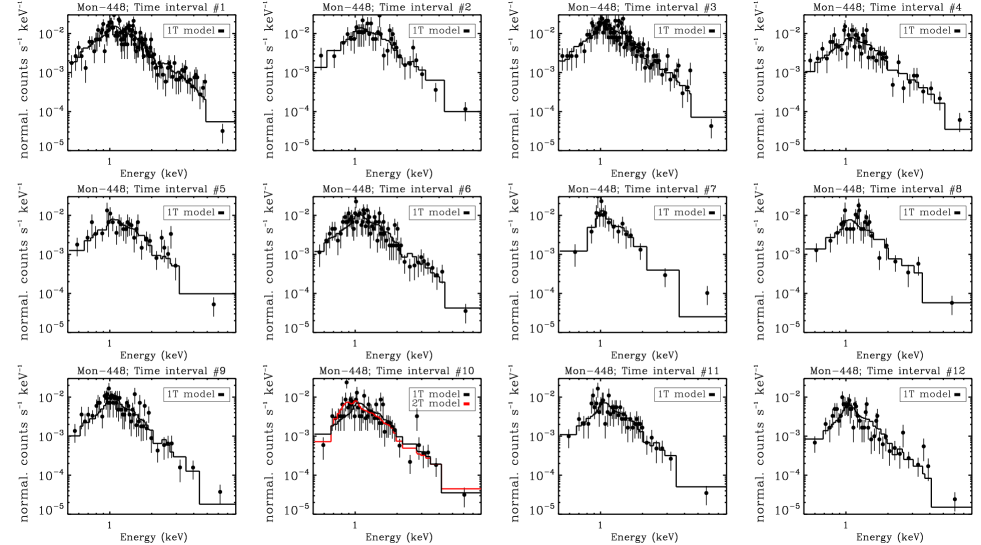
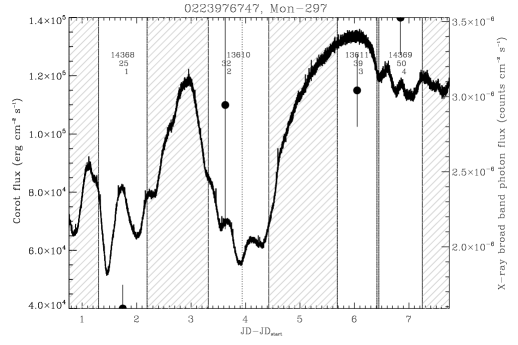
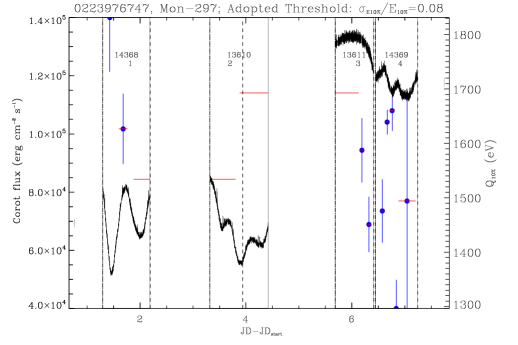
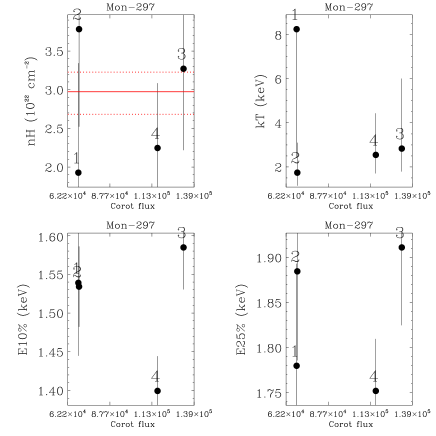

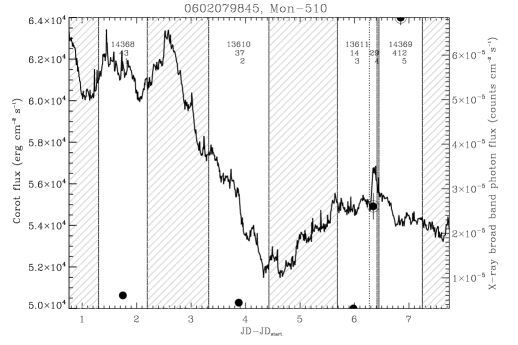
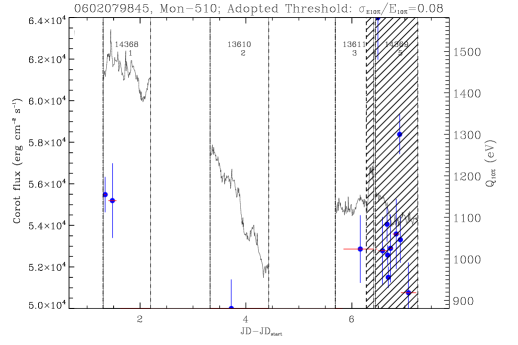

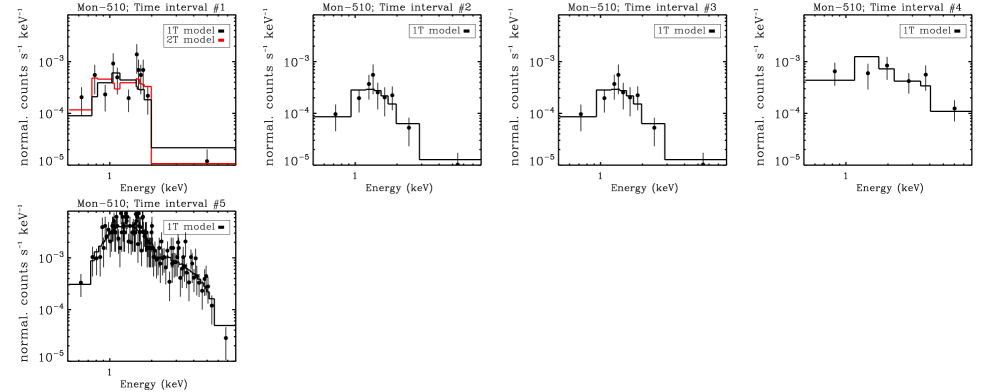
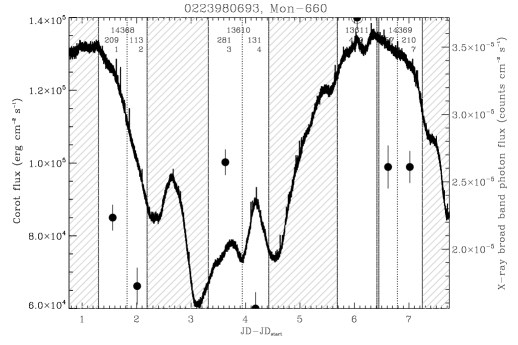
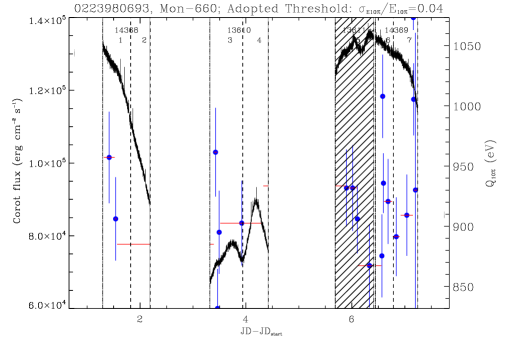

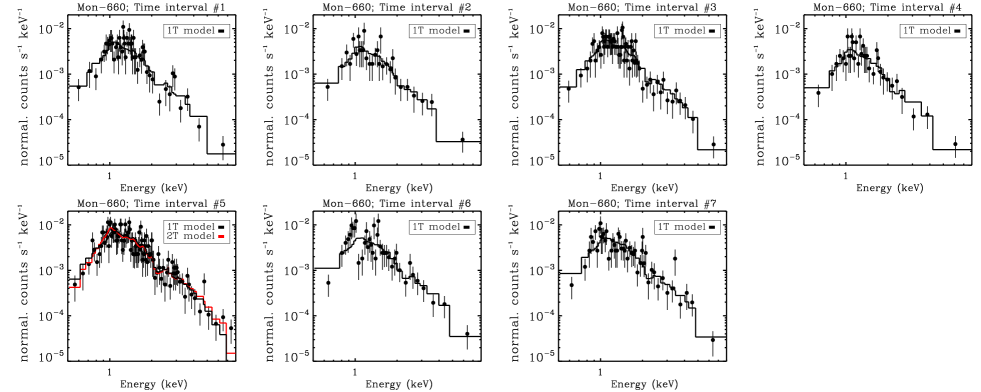
Appendix D Entire CoRoT light curves of the stars discussed in this paper
In this appendix we show the whole CoRoT light curves of the stars with disks discussed in this paper. The frames are the shaded time windows delimited by vertical lines.
![[Uncaptioned image]](/html/1701.04842/assets/x231.png)
![[Uncaptioned image]](/html/1701.04842/assets/x232.png)
![[Uncaptioned image]](/html/1701.04842/assets/x233.png)
![[Uncaptioned image]](/html/1701.04842/assets/x234.png)
![[Uncaptioned image]](/html/1701.04842/assets/x235.png)
![[Uncaptioned image]](/html/1701.04842/assets/x236.png)
![[Uncaptioned image]](/html/1701.04842/assets/x237.png)
![[Uncaptioned image]](/html/1701.04842/assets/x238.png)
![[Uncaptioned image]](/html/1701.04842/assets/x239.png)
![[Uncaptioned image]](/html/1701.04842/assets/x240.png)
![[Uncaptioned image]](/html/1701.04842/assets/x241.png)
![[Uncaptioned image]](/html/1701.04842/assets/x242.png)
![[Uncaptioned image]](/html/1701.04842/assets/x243.png)
![[Uncaptioned image]](/html/1701.04842/assets/x244.png)
![[Uncaptioned image]](/html/1701.04842/assets/x245.png)
![[Uncaptioned image]](/html/1701.04842/assets/x246.png)
![[Uncaptioned image]](/html/1701.04842/assets/x247.png)
![[Uncaptioned image]](/html/1701.04842/assets/x248.png)
![[Uncaptioned image]](/html/1701.04842/assets/x249.png)
![[Uncaptioned image]](/html/1701.04842/assets/x250.png)
![[Uncaptioned image]](/html/1701.04842/assets/x251.png)
![[Uncaptioned image]](/html/1701.04842/assets/x252.png)
![[Uncaptioned image]](/html/1701.04842/assets/x253.png)
![[Uncaptioned image]](/html/1701.04842/assets/x254.png)
![[Uncaptioned image]](/html/1701.04842/assets/x255.png)
![[Uncaptioned image]](/html/1701.04842/assets/x256.png)
![[Uncaptioned image]](/html/1701.04842/assets/x257.png)
![[Uncaptioned image]](/html/1701.04842/assets/x258.png)
![[Uncaptioned image]](/html/1701.04842/assets/x259.png)
![[Uncaptioned image]](/html/1701.04842/assets/x260.png)
![[Uncaptioned image]](/html/1701.04842/assets/x261.png)
![[Uncaptioned image]](/html/1701.04842/assets/x262.png)
![[Uncaptioned image]](/html/1701.04842/assets/x263.png)
![[Uncaptioned image]](/html/1701.04842/assets/x264.png)
![[Uncaptioned image]](/html/1701.04842/assets/x265.png)
![[Uncaptioned image]](/html/1701.04842/assets/x266.png)
![[Uncaptioned image]](/html/1701.04842/assets/x267.png)
![[Uncaptioned image]](/html/1701.04842/assets/x268.png)
![[Uncaptioned image]](/html/1701.04842/assets/x269.png)
![[Uncaptioned image]](/html/1701.04842/assets/x270.png)
![[Uncaptioned image]](/html/1701.04842/assets/x271.png)
![[Uncaptioned image]](/html/1701.04842/assets/x272.png)
![[Uncaptioned image]](/html/1701.04842/assets/x273.png)
![[Uncaptioned image]](/html/1701.04842/assets/x274.png)
![[Uncaptioned image]](/html/1701.04842/assets/x275.png)
![[Uncaptioned image]](/html/1701.04842/assets/x276.png)
![[Uncaptioned image]](/html/1701.04842/assets/x277.png)
![[Uncaptioned image]](/html/1701.04842/assets/x278.png)
![[Uncaptioned image]](/html/1701.04842/assets/x279.png)
![[Uncaptioned image]](/html/1701.04842/assets/x280.png)
![[Uncaptioned image]](/html/1701.04842/assets/x281.png)
![[Uncaptioned image]](/html/1701.04842/assets/x282.png)
![[Uncaptioned image]](/html/1701.04842/assets/x283.png)