Morphology and the Color-Mass Diagram as Clues to Galaxy Evolution at
Abstract
We study the significance of mergers in the quenching of star formation in galaxies at , by examining their color-mass distributions for different morphology types. We perform 2-dimensional light profile fits to GOODS images of 5,000 galaxies and X-ray selected active galactic nucleus (AGN) hosts in the CANDELS/GOODS-north and south fields in the redshift range . Distinguishing between bulge-dominated and disk-dominated morphologies, we find that disks and spheroids have distinct color-mass distributions, in agreement with studies at . The smooth distribution across colors for the disk galaxies corresponds to a slow exhaustion of gas, with no fast quenching event. Meanwhile, blue spheroids most likely come from major mergers of star-forming disk galaxies, and the dearth of spheroids at intermediate green colors is suggestive of rapid quenching. The distribution of moderate luminosity X-ray AGN hosts is even across colors, in contrast, and we find similar numbers and distributions among the two morphology types with no apparent dependence on Eddington ratio. The high fraction of bulge-dominated galaxies that host an AGN in the blue cloud and green valley is consistent with the scenario in which the AGN is triggered after a major merger, and the host galaxy then quickly evolves into the green valley. This suggests AGN feedback may play a role in the quenching of star formation in the minority of galaxies that undergo major mergers.
Subject headings:
keywords1. Introduction
The distribution of galaxies on color-mass diagrams can be used to study how galaxies evolve. The stellar mass of a galaxy tracks its hierarchical growth via mergers, as well as its integrated star formation, and the dust-corrected rest-frame colors reflect its current state of star formation. Both local and high redshift galaxies show bimodal color-mass distributions (e.g., Strateva et al. 2001; Baldry et al. 2004, 2006; Brammer et al. 2009), with a ‘blue cloud’ of star forming galaxies and a ‘red sequence’ of more massive, quiescent galaxies which build up over cosmic time. The relative lack of galaxies in the ‘green valley’ between these two populations is generally interpreted as evidence of rapid quenching, after which galaxies migrate quickly to the red sequence as the stellar population ages (Bell et al. 2004; Faber et al. 2007).
Feedback from active galactic nuclei (AGNs) is a possible quenching mechanism frequently assumed in galaxy evolution models. The tight correlations between supermassive black hole mass and galaxy properties suggest there is some kind of co-evolution between them, with mergers possibly being the common cause of both AGN accretion and bulge mass buildup (Hopkins et al. 2007). The enormous amount of energy emitted during the AGN phase may couple to the surrounding gas and heat or expel it from the galaxy, thus suppressing further star formation. In addition, AGN feedback is regularly invoked in cosmological simulations to recover the observed local luminosity function, the bimodality, and the number density of massive galaxies (e.g., Somerville et al. 2008), although these simulations have not yet converged on the strength of the effect.
Direct evidence of AGN feedback remains elusive, and recent studies of the relationship between AGN activity and star formation have arrived at different conclusions (e.g., Hickox et al. 2014; Schawinski et al. 2014). Moreover, while AGN hosts are found to reside predominantly in the green valley, several recent studies have suggested that mergers do not play a dominant role in triggering most AGN (Grogin et al. 2005; Gabor et al. 2009; Cisternas et al. 2011; Kocevski et al. 2012; Schawinski et al. 2012; Treister et al. 2012; Simmons et al. 2013; Rosario et al. 2015).
Galaxy morphology holds clues to past merger history, as bulges and elliptical galaxies typically form from merger events. It can therefore can be used to distinguish between galaxies on different evolutionary tracks if mergers are significant in evolving the galaxy. Schawinski et al. (2014) showed that local disk-dominated galaxies do not show signs of fast quenching; rather, they evolve slowly until the halo mass reaches a critical point (), after which they redden more dramatically. Meanwhile the early-type galaxies, assumed to have undergone a major merger, migrate rapidly through the green valley to the red sequence, as per the standard paradigm. Smethurst et al. (2015) built on this using Bayesian inference to create a statistically rigorous approach to finding the star formation histories of the same galaxy sample, and found similar results. However these studies address only local galaxies, for which star formation rates and black hole accretion rates are very low, and thus the conclusions may have little to do with galaxy evolution at the epoch of peak star formation and black hole growth at .
In this paper, we examine the morphology-dependent evolution of higher redshift galaxies toward the peak of galaxy evolution, at . We take advantage of deep, multi-wavelength Hubble Space Telescope (HST) imaging, for which is comparable in resolution and sensitivity to Sloan Digital Sky Survey (SDSS) imaging of galaxies, and use galaxy morphologies to indicate which galaxies have undergone a recent major merger. We then compare to matched samples of X-ray AGNs. This paper is organized as follows. We describe the HST data and our AGN selection in Section 2; Section 3 describes the morphological analysis and sample cuts; results are presented and discussed in Section 4 for both inactive and active galaxy populations; and we present main conclusions in Section 5. We assume a standard CDM Cosmology ( and km s-1 Mpc-1). All magnitudes are in the AB system.
2. Data
For this analysis we used HST ACS data from the north and south fields of the Great Observatories Origins Deep Survey (GOODS; Giavalisco et al. 2004). Optical observations were taken in F435W (B), F660W (V), F775W (i), and F850LP (z) bands, each with a resolution of per pixel. We used the and band images for galaxies in order to fit their morphologies in the rest-frame B band. The magnitude limits for extended sources are mag and mag. We used galaxies in the redshift range that were in the footprint of the Cosmic Assembly Near-IR Deep Extragalactic Legacy Survey (CANDELS; Grogin et al. 2011; Koekemoer et al. 2011), so that deep near-infrared WFC3/IR data from HST as well as an abundance of other multi-wavelength data were available. The depth and multi-wavelength coverage of the CANDELS fields make them ideal for investigating galaxies and AGN hosts at .
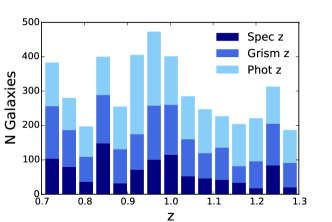
We used catalogs from the 3D-HST spectroscopic survey, which provides grism spectroscopy in addition to multiwavelength photometric data over the five CANDELS fields (Brammer et al. 2012; Momcheva et al. 2016); ground-based spectroscopy exists for a fraction of the galaxies. The coverage of the two GOODS fields in this survey are 116 arcmin2 and 147 arcmin2 for north and south, respectively. For the objects with photometry only, Skelton et al. (2014) derived photometric redshifts by fitting each object’s spectral energy distribution (SED) with a linear combination of seven EAZY galaxy templates (Brammer et al. 2008), obtaining and outliers for GOODS-N and and outliers for GOODS-N. For objects with grism data, Momcheva et al. (2016) fit the two-dimensional (2D) spectra and photometry simultaneously to produce redshifts with . The authors then obtained the rest-frame colors by using the best-fitting redshift with the EAZY templates, and derived the stellar masses and extinction values from SED fits to stellar population models with the FAST code (Kriek et al. 2009), as described in Skelton et al. (2014) and Brammer et al. (2012). Their star formation rates were obtained by including UV light from massive stars re-radiated in the FIR, calculated in Whitaker et al. (2014). More details on the 3D-HST survey can be found in Momcheva et al. (2016) and Brammer et al. (2012).
We selected galaxies with a rest-frame B magnitude and CLASSSTAR in the redshift range stated above, based on their ‘zbest’ redshift, which used the photometric redshift ( of the sample) if no spectroscopic redshift () was available. We note that the use of photo-zs do not change our conclusions; we include the galaxies with only photo-zs to increase the statistics. There are 4479 galaxies cross-matched between the GOODS and 3D-HST catalogs. Figure 1 shows the redshift distribution of the galaxy sample.
2.1. Identification of AGNs
Hard X-ray selection is one of the least biased and most efficient AGN selection techniques, as all but the most obscured systems can be detected, and relatively few non-AGNs are selected by this method. Additionally, X-ray AGNs have been shown to have no bias with respect to star formation rate (Azadi et al. 2016). We select the AGN by cross-matching the positions of objects within in the north and south Chandra Deep Field (CDF), using the CDFN 2 Ms point source catalog (Alexander et al. 2003; Xue et al. 2016) and the CDFS 4 Ms catalog (Xue et al. 2011). We use objects above an absorption-corrected, rest-frame 0.5-8 keV luminosity threshold ergs s-1 to reduce non-AGN contamination, and verify the redshifts match those of the galaxies. A total of 106 AGNs meet these criteria.
The color contamination of AGN host galaxies due to the central nucleus has previously been examined for these same HST-observed galaxies (Cardamone et al. 2010). By comparing the color before and after the point source was subtracted, Cardamone et al. concluded that the integrated galaxy color does not appear to be significantly affected by the central AGN light for these moderate luminosity AGNs, as long as the quasar light does not dominate its host galaxy. We have verified this applies to the AGN sample studied here by comparing the magnitudes of the point spread function (PSF) and galaxy from our morphological analysis. We therefore use the integrated color for all AGN host galaxies. Similarly, the bias the of stellar mass estimates for AGN hosts was found to be dex (Brammer et al. 2009; Cardamone et al. 2010).
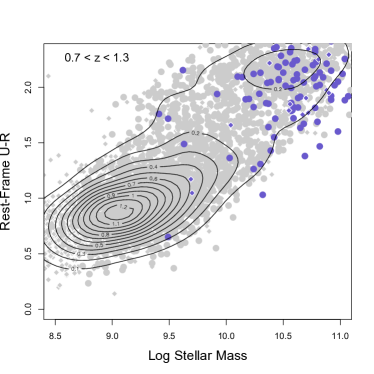
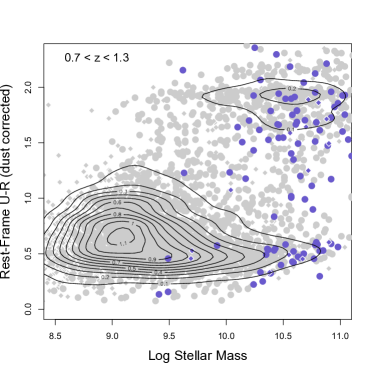
Figure 2 (left) shows the rest-frame U-R color versus log stellar mass of our 4479 galaxies. The gray dots and black density contours are associated with the inactive galaxy population, and the 106 AGN hosts are shown in purple.
It is known that obscuring dust can redden galaxies, so we correct the U-R colors for this reddening using the Calzetti et al. (2000) extinction law
| (1) |
with extinction values from the 3D-HST catalog. After de-reddening, the red sequence and blue cloud are further separated, as seen in Figure 2 (right). AGN host galaxy colors are distributed uniformly across the full range, while most galaxies are in the blue star-forming cloud, with a much smaller number in the red sequence and still fewer in the green valley. The red sequence is not as prominent as at because there has been much less time since the peak of star formation for the red sequence to build up.
It appears that the AGNs preferentially lie in galaxies of large stellar mass. However several recent studies have characterized this as a selection effect, such that the probability that a galaxy hosts an AGN only depends on the underlying Eddington ratio distribution (Aird et al. 2010; Jones et al. 2016; Azadi et al. 2016), and thus only a larger fraction of AGNs are found in massive galaxies. Additionally, we eliminate a larger fraction of the less massive AGN hosts by selecting AGNs with ergs s-1.
3. Morphological Analysis
3.1. Analysis Method
We performed 2D morphological analysis with GALFIT (Peng et al. 2002), which uses minimization to fit parameters based on initial guesses for each component. An arbitrary number of components can be fit at once. We used PSFs from the 3D-HST survey, which were obtained by averaging between 35 and 200 carefully selected stars in each filter (Brammer et al. 2012).
Initial parameter guesses, including integrated magnitude, half-light radius, axis ratio, and position angle, were obtained from the SExtractor catalogs (Bertin & Arnouts 1996) produced by the GOODS survey (Giavalisco et al. 2004). We made no assumption about Sérsic index for each galaxy, using for the initial guess. If multiple components were fit, we input equal initial magnitudes for each component.
We first batch fit the inactive galaxies with a simple Sérsic profile, then classified as disks those with Sérsic index , and spheroids with . If or convergence problems occurred, we then tried bulge/disk decomposition to determine the dominant component. If the fit was still poor (), the galaxies were individually fit with multiple components, with the brightest component determining the morphological type. The active galaxies were individually fit with a Sérsic profile and PSF, or with a bulge, disk, and PSF. To simulate the effect of how unresolved features affect the fit, we fit a sample of inactive galaxies with an additional PSF, and found that the Sérsic index typically changed by less than 0.1 (and no more than 0.5) from when fit with only a Sérsic profile.
We additionally measured the asymmetry of each galaxy to estimate the fraction in our sample that are in ongoing mergers. Asymmetry was measured by calculating the fractional residuals of the image and the image rotated by (Conselice et al. 2000; Conselice 2003; Menanteau et al. 2006; Shi et al. 2009):
| (2) |
where is the correction term due to the sky noise, calculated as ( is the area of the aperture; Menanteau et al. 2006). We use an aperture radius of , where is the best fit half-light radius found from GALFIT. Local galaxies with asymmetries almost always have disturbed morphologies from major mergers, however galaxies of the same morphology at higher redshift are more symmetric due to surface brightness dimming (Conselice 2003; Shi et al. 2009). This can be corrected by decreasing the asymmetry threshold for mergers by for galaxies (Conselice 2003). Additionally, it was found that a significant fraction of galaxies above this asymmetry threshold can be contaminated with nearby stars or non-interacting galaxies (De Propris et al. 2007; López-Sanjuan et al. 2009). By visual inspection of all galaxies with , this fraction is for our sample. We therefore calculate the number of mergers as of the number of galaxies with asymmetries .
3.2. Sample Selection
In this section we explain the cuts made to the galaxy sample to ensure the robustness of the morphological analysis.
We eliminated fits with a , and those with determined Sérsic indices of to reduce contamination in each morphological category. If there are other sources in the field of view of the cutout, this could also cause error in GALFIT’s index estimation, but this effect is reduced when removing fits with .
For the AGN hosts that were fit individually, we excluded any with significant azimuthally symmetric residuals, indicating poor fits to the Sérsic profile, or any irregular mergers. This cut out AGNs. Simmons & Urry (2008), who analyzed 55,000 simulated HST ACS images to precisely define the limits within which galaxy morphologies can be well determined, found that fits to AGN host galaxies observed in GOODS are accurate as long as the host luminosity is greater than of the point source luminosity; based on this criterion, we excluded four more AGN host galaxies. Also, from following the results in Simmons & Urry (2008), we make an effective radius cut for both inactive and active galaxy fits, which eliminates of bad fits.
For the measuring asymmetries, we follow Shi et al. (2009) and disregard galaxies with pixels for a reliable measurement. This cuts out a negligible number of galaxies (40; of each morphology type) from our merger fraction calculation.
Our final sample has 3010 galaxies and 83 AGN hosts, and we verified that it has the same color, stellar mass, and redshift distributions as the original sample.
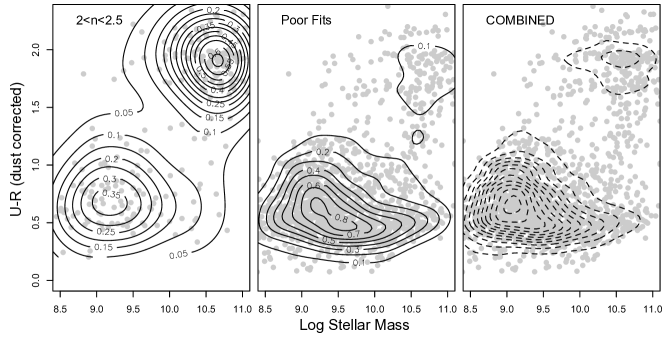
Figure 3 shows the color-mass diagram of sources that were excluded from this analysis, disaggregated into galaxies with intermediate Sérsic indices and galaxies that are poorly fitted with a Sérsic model. Galaxies with intermediate Sérsic indices are evenly split between red sequence and blue cloud, as expected, which means this cut excludes a larger fraction of bulge-dominated galaxies. Galaxies with poor fits (i.e. or large effective radius) have similar colors and masses as the total galaxy sample, so their exclusion does not cause any bias in the color-mass distribution.
3.3. Morphology Results
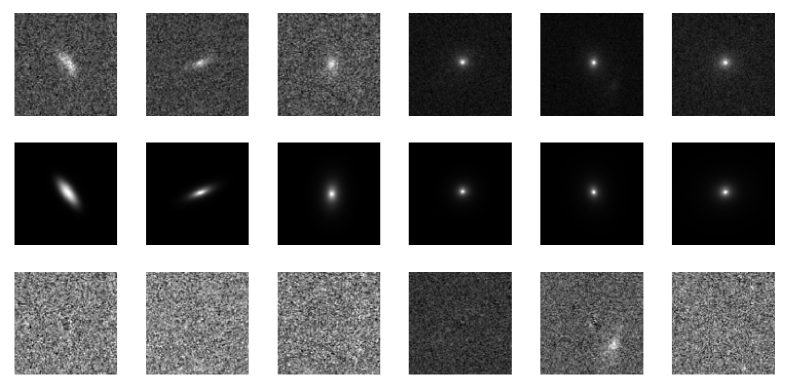
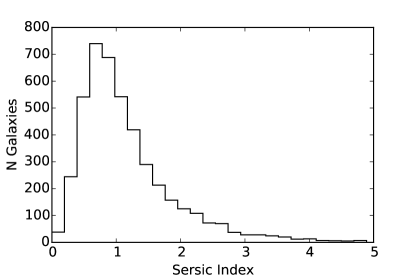
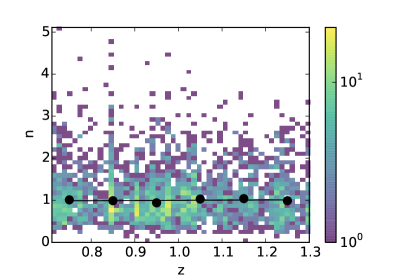
Figure 4 shows the image data, model, and residuals for example galaxies of the different morphological types, and the Sérsic index distribution is shown in Figure 5. We find that a large majority of the galaxies () at are disk dominated, and there is no redshift dependence of morphology, shown in Figure 6. These results are generally consistent with other morphological analyses of galaxies in GOODS (Bundy et al. 2005; van der Wel et al. 2012); we compare our results to those in more detail in the Appendix A.
4. Color-Mass and Morphology
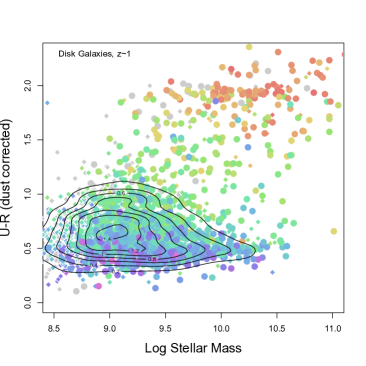
Figure 7 shows color-mass plots for disk and bulge-dominated inactive galaxies at with the associated density contours. The colors of the points correspond to the specific star formation rates of the galaxies from 3D-HST (Whitaker et al. 2014), showing the decline in star formation as galaxies move to the red sequence. The disk-dominated galaxies peak in the blue cloud while the bulge-dominated galaxies peak in the red sequence, unsurprisingly, but both span the entire range in color. The demographics of galaxies in the blue cloud, green valley, and red sequence for each morphology are summarized in Table 1. We define green valley galaxies as galaxies with dust-corrected rest-frame U-R colors between 1 and 1.5 mag; most are transitioning to the red sequence but at least 15 (estimated from visual inspection of a random sample of 100 galaxies) are simply blue disk galaxies with a red bulge.

| Galaxy Sample | Population | |
|---|---|---|
| Early-type, blue cloud | 26 | 20.6 |
| Early-type, green valley | 5 | 4.0 |
| Early-type, red sequence | 95 | 75.4 |
| Early-type, all | 126 | 100.0 |
| Late-type, blue cloud | 2257 | 85.1 |
| Late-type, green valley | 193 | 7.3 |
| Late-type, red sequence | 201 | 7.6 |
| Late-type, all | 2651 | 100.0 |
The left-hand plot of Figure 7 shows that the number of disk-dominated galaxies peaks in the blue cloud but extends up to the red sequence, similar to what Schawinski et al. (2014) found at , namely, that the disk galaxies experience a gradual decline in star formation. The disks span the color-mass diagram, but there is no bimodality to suggest a rapid transition through the green valley. This is in agreement with other recent studies of the star formation histories of low redshift disk galaxies (Wolf et al. 2009; Masters et al. 2010; Tojeiro et al. 2013; Lopes et al. 2016).
In contrast, bulge-dominated galaxies (Fig 7, right) peak in the red sequence with very few in the green valley. This closely resembles what is seen at (Schawinski et al. 2014), in which spheroidal galaxies quench more rapidly. We find that only of green valley (inactive) galaxies are bulge-dominated. However, the fraction of spheroids that are blue is much higher than what was found locally; of early-type galaxies are in the blue cloud, compared with at (Schawinski et al. 2014). It should be noted that in Schawinski et al. the galaxy morphologies were classified by eye via the Galaxy Zoo citizen science project (Lintott et al. 2008), and that intermediate galaxy shapes were excluded from the analysis, similar to our exclusion of intermediate Sérsic indicies. These excluded galaxies were mainly disks with bulges, so we are comparing similar sub-samples.
There are several possibilities for the origin of the blue spheroidal population besides forming from major mergers. One possibility is from violent disk disruption, which would compactify disks into small star-forming ellipticals (Dekel & Burkert 2014). However, these compact ‘nugget’ galaxies are generally observed at higher redshift, , and the their effective radii are of order 1 kpc (Dekel & Burkert 2014). The blue ellipticals we measured here have effective radii of several kpc, of the same order as elliptical galaxies at . Additionally, some spheroidal galaxies could trickle down from the red sequence after a spontaneous burst of star formation, perhaps after a minor merger. Recent studies investigating this population have not converged on a single evolutionary scenario for the blue bulge population, but have found evidence that there are contributions from both major mergers as well as ‘rejuvination’ (Smethurst et al. 2015; Tojeiro et al. 2013; Lopes et al. 2016).
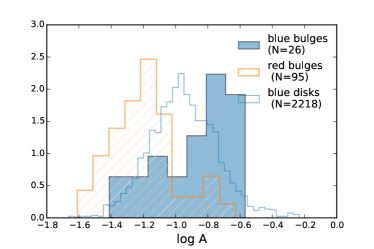
We investigated further by measuring the asymmetry of the blue spheroids. If they formed from recent major mergers they should have a higher fraction of disturbed morphologies compared with the blue cloud disks and red sequence ellipticals. We found that is indeed the case, shown by Figure 8. The offset of asymmetry between the blue elliptical peak and the red elliptical peak is evidence that there is at least a significant fraction of blue ellipticals that are associated with mergers, agreeing with recent findings (Smethurst et al. 2015; Lopes et al. 2016). By visual inspection, it was clear that the galaxies with were significantly asymmetric.
The merger fraction, along with the relative timescales between the change in morphology from a major merger and the change of color, should dictate the fraction of merger-formed blue ellipticals that we see. Mergers were more common at than at , with an observed dependence that goes roughly as (Lotz et al. 2008), and so the increase in the fraction of blue spheroids by a factor 4 or 5 that we see is consistent within error of what would be expected if they were formed by major mergers. By measuring the asymmetries of all blue cloud galaxies, we calculated a merger fraction for our sample of . This is low compared to other merger fraction calculations in the literature; however, different galaxy selections, aperture areas, and contamination correction factors make direct comparisons difficult (Lotz et al. 2011). We emphasize that our calculation is an order of magnitude estimate.
The fraction of blue ellipticals that we find in the blue cloud and green valley is (), within error of the calculated merger fraction. This would be the fraction expected if these galaxies are the result of major mergers. The timescale for a galaxy’s morphology to relax is estimated to be a few hundred Myrs (e.g., Conselice 2006; Lotz et al. 2008) while the quenching timescale for early-type galaxies is of the same order or longer, Gyr (Schawinski et al. 2014; Smethurst et al. 2015), making it difficult to predict the number of relaxed blue spheroids for a given merger rate. However our findings are consistent with the picture in which the morphology changes before the onset of rapid quenching for a significant fraction of galaxies that have undergone a major merger.
In summary, given our calculated merger fraction and observed number of blue ellipticals and their asymmetries, we argue that they are mostly late-stage mergers. Assuming this, and the fact that the estimated timescales of morphological relaxation is not significantly shorter than the timescale for quenching, our results are consistent with the scenario where quenching is delayed after galaxies undergo a major merger, possibly due to delayed black hole accretion. However this depends on exact merger rates and the relative timescales between a galaxy’s morphology change and color change, and we cannot currently break these degeneracies.
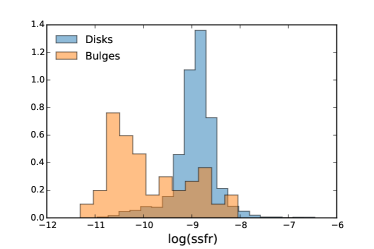
Figure 9 shows the normalized distributions of specific star formation rate estimates for both morphology types. The disk galaxies peak at a higher rate than bulges, confirming the association of disks with long-term star formation and of bulges with recent quenching. The bulge-dominated galaxies have more of a bimodal distribution as can also be seen on the color-mass diagram. The peak at higher specific star formation rate again suggests blue bulge-dominated galaxies stay blue for some time following a merger, implying that quenching is delayed after galaxies undergo a major merger. This would be expected if AGNs were responsible for quenching, as it takes time for gas to funnel to the center of the galaxy before igniting the AGN.
4.1. AGN Host Galaxies
If AGNs are responsible for the quenching we should expect some AGN hosts to be in the blue cloud, because it takes several hundred Myr for a stellar population to age to green valley colors (Schawinski et al. 2007). Additionally, if the initial AGN luminosity is the highest, as some models claim (e.g., Hopkins et al. 2007), we should see AGNs with higher Eddington ratios closer to the blue cloud than to the red sequence.
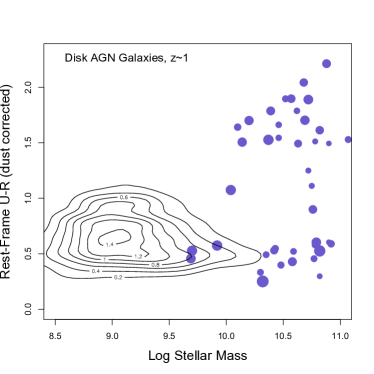
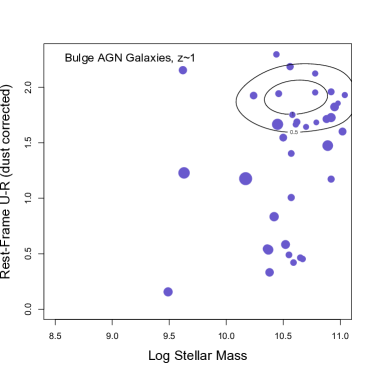
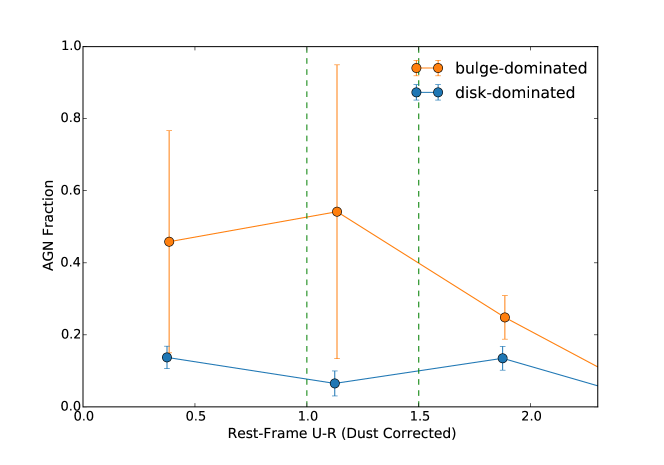
Separating the the AGN hosts into disk-dominated and bulge-dominated, their color-mass diagrams are shown in Figure 10 along with the density contours of the inactive galaxies for comparison. The size of the points corresponds to 0.5-8 keV X-ray luminosity divided by stellar mass, which should approximate the Eddington ratio if the bolometric correction and the ratio of black hole to stellar mass are roughly constant (the bolometric correction was empirically found for most obscured GOODS AGNs to be in Simmons et al. 2011). We also plot the fraction of galaxies of each morphological type hosting an AGN above a stellar mass threshold of for various color bins in Figure 11. We chose the mass threshold so that AGN incompleteness at low stellar mass does not affect the conclusions. As there can be selection issues with AGN fractions, we looked at how restricting our sample to high or would affect Figure 11; as there was effectively no qualitative change except larger error bars, we include the full sample of AGNs in Figure 11. The morphological demographics for the AGN host galaxies are given in Table 2.
The absolute distributions of disk-dominated and bulge-dominated AGN hosts are similar, i.e, that both uniformly span the color space at higher masses, and they are also approximately equal in number. This suggests both that mergers may trigger some AGNs but cannot trigger more than about half the AGNs at , since half are disk dominated indicating no recent major merger. Although we are limited by small statistics, there is no evidence for a difference of stellar mass between the two populations that was found at (Schawinski et al. 2010). A Kolmogorov-Smirnov test confirms their distributions in the color-mass plane are not significantly different (p-value 0.08 for the null hypothesis). On the face of it, this would suggest that AGNs have little to do with morphology, and by extension, with mergers. Additionally, there is no systemic discrepancy of the Eddington ratios between the two morphologies (with a p-value of being drawn from different distributions 0.65).
Considering the fraction of galaxies that host AGNs, there are marked differences with galaxy morphology. The fraction of disk galaxies hosting an AGN is small and shows little color dependence, as seen in Figure 11. This implies that secular triggering of significant black hole growth is relatively rare. The trigger for these disk-dominated AGNs must not be a major merger, as their disk morphologies last to the red sequence. Also, because we find no excess of these hosts in the blue cloud or green valley we conclude that AGN feedback cannot be the major driver of galaxy evolution for disk galaxies.
For the minority of galaxies that undergo a major merger and become bulge-dominated, we see a higher incidence of AGN activity while the host galaxy colors are still blue, although the significance is limited by the small sample size. This does imply a possible role for feedback in moving them from the blue cloud into the green valley, as was found by Schawinski et al. (2014). However, there is no evidence for a trend in the black hole’s Eddington ratio with respect to the color. While this may challenge the idea that luminous AGNs quench star formation, our AGN sample excludes the rare high-luminosity quasars because of the small survey volume. For our sample of moderate-luminosity AGNs, we find no significant evidence that AGN hosts evolve differently from inactive galaxies, agreeing with other recent studies on AGN host galaxies (Goulding et al. 2014).
Lastly, we note that if the AGN phase is continuous it must last long enough to reach the red sequence, namely Gyr, as there are AGNs of both morphological types with red host galaxies. However, recent studies have suggested AGNs flicker on and off within the time scale of traversing the green valley (e.g., Cavaliere & Padovani 1989; Schawinski et al. 2015), or even much shorter time scales (Hickox et al. 2014). In that case, the location of an AGN in the color-mass diagram is essentially random, i.e., unrelated to the age of the stellar populations. This is what we see, as the AGN colors are distributed across the full color space. Of course, the density of AGNs relative to galaxies does change across the diagram and so the flickering cannot be random across the entire galaxy lifetime. Rather, the AGN flickering should occur after quenching starts, as the stellar population is aging. This should become more clear with larger samples.
| AGN Sample | Population | |
|---|---|---|
| Early-type, blue cloud | 10 | 25.0 |
| Early-type, green valley | 7 | 17.5 |
| Early-type, red sequence | 23 | 57.5 |
| Early-type, all | 40 | 100.0 |
| Late-type, blue cloud | 19 | 46.3 |
| Late-type, green valley | 5 | 12.2 |
| Late-type, red sequence | 17 | 41.5 |
| Late-type, all | 41 | 100.0 |
5. Summary
We have measured morphologies of 3000 galaxies in the CANDELS/GOODS north and south fields to examine the dependence of major mergers on the evolution of redshift galaxies. Taking advantage of deep, multi-wavelength data available in these fields, we have plotted the distributions on the color-mass diagram for both disk-dominated and bulge-dominated galaxies. We then compared to the X-ray selected AGN hosts in the same field to study the role of mergers in triggering AGNs, and the role of AGN feedback in quenching star formation.
Our main conclusions are as follows:
-
•
The distribution of disk-dominated galaxies on the color-mass diagram is unimodal, but spans the entire diagram up to the red sequence. This suggests that these galaxies evolve gradually, slowly exhausting gas via secular processes.
-
•
The lack of bulge-dominated galaxies in the green valley suggests faster quenching for galaxies that have undergone a major merger.
-
•
Disk-dominated AGN hosts range from the blue cloud to the red sequence, but there is little evidence for AGN feedback. The trigger for these AGNs must be a mechanism that does not disrupt the disk.
-
•
There is a larger fraction of bulge-dominated AGN hosts in the blue cloud and green valley, allowing for the possibility of AGN feedback occasionally playing a role in quenching.
-
•
There are more blue ellipticals at than at . We infer that this is due at least partially to the fact that mergers were more common at higher redshift.
-
•
The absolute distributions of disk-dominated and bulge-dominated AGN hosts are similar; both uniformly span the color space at higher masses with similar numbers. There is no evidence for color-mass or morphology trends with respect to the black hole’s Eddington ratio.
Acknowledgements
We thank the referee for their helpful comments that improved the paper. This work is based on observations made with the NASA/ESA Hubble Space Telescope, obtained from the data archive at the Space Telescope Science Institute. STScI is operated by the Association of Universities for Research in Astronomy, Inc. under NASA contract NAS 5-26555. This work is also based on observations taken by the 3D-HST Treasury Program (GO 12177 and 12328) with NASA/ESA HST, which is operated by the Association of Universities for Research in Astronomy, Inc., under NASA contract NAS5-26555. M.C.P. and C.M.U. are also grateful to Yale University for support, and for summer stipends for S.Y. and M.K. Support for this work was also provided by the National Aeronautics and Space Administration through Einstein Postdoctoral Fellowship Award Number PF5-160143 issued by the Chandra X-ray Observatory Center, which is operated by the Smithsonian Astrophysical Observatory for and on behalf of the National Aeronautics Space Administration under contract NAS8-03060. K.S. gratefully acknowledges support from Swiss National Science Foundation Grant PP00P2_138979/1.
References
- Aird et al. (2010) Aird, J., Nandra, K., Laird, E. S., et al. 2010, MNRAS, 401, 2531
- Alexander et al. (2003) Alexander, D., Bauer, F., Brandt, W., et al. 2003, AJ, 126, 539
- Azadi et al. (2016) Azadi, M., Coil, A. L., Aird, J., et al. 2016, ApJ, in press, arXiv:1608.05890
- Baldry et al. (2006) Baldry, I. K., Balogh, M. L., Bower, R. G., et al. 2006, MNRAS, 373, 469
- Baldry et al. (2004) Baldry, I. K., Glazebrook, K., Brinkmann, J., et al. 2004, ApJ, 600, 681
- Bell et al. (2004) Bell, E. F., Wolf, C., Meisenheimer, K., et al. 2004, ApJ, 608, 752
- Bertin & Arnouts (1996) Bertin, E., & Arnouts, S. 1996, A&AS, 117, 393
- Brammer et al. (2008) Brammer, G. B., van Dokkum, P. G., & Coppi, P. 2008, ApJ, 686, 1503
- Brammer et al. (2009) Brammer, G. B., Whitaker, K. E., van Dokkum, P. G., et al. 2009, ApJ, 706, L173
- Brammer et al. (2011) Brammer, G. B., Whitaker, K. E., van Dokkum, P. G., et al. 2011, ApJ, 739, 24
- Brammer et al. (2012) Brammer, G. B., van Dokkum, P. G., Franx, M., et al. 2012, ApJS, 200, 13
- Bundy et al. (2005) Bundy, K., Ellis, R. S., & Conselice, C. J. 2005, ApJ, 625, 621
- Calzetti et al. (2000) Calzetti, D., Armus, L., Bohlin, R. C., et al. 2000, ApJ, 533, 682
- Cardamone et al. (2010) Cardamone, C. N., Urry, C. M., Schawinski, K., et al. 2010, ApJ, 721, L38
- Cavaliere & Padovani (1989) Cavaliere, A., & Padovani, P. 1989, ApJ, 340, L5
- Cisternas et al. (2011) Cisternas, M., Jahnke, K., Inskip, K. J., et al. 2011, ApJ, 726, 57
- Conselice (2003) Conselice, C. J. 2003, ApJS, 147, 1
- Conselice (2006) —. 2006, ApJ, 638, 686
- Conselice et al. (2000) Conselice, C. J., Bershady, M. A., & Jangren, A. 2000, ApJ, 529, 886
- De Propris et al. (2007) De Propris, R., Conselice, C. J., Liske, J., et al. 2007, ApJ, 666, 212
- Dekel & Burkert (2014) Dekel, A., & Burkert, A. 2014, MNRAS, 438, 1870
- Faber et al. (2007) Faber, S. M., Willmer, C. N. A., Wolf, C., et al. 2007, ApJ, 665, 265
- Gabor et al. (2009) Gabor, J. M., Impey, C. D., Jahnke, K., et al. 2009, ApJ, 691, 705
- Giavalisco et al. (2004) Giavalisco, M., Dickinson, M., Ferguson, H. C., et al. 2004, ApJ, 600, L103
- Goulding et al. (2014) Goulding, A. D., Forman, W. R., Hickox, R. C., et al. 2014, ApJ, 783, 40
- Grogin et al. (2005) Grogin, N. A., Conselice, C. J., Chatzichristou, E., et al. 2005, ApJ, 627, L97
- Grogin et al. (2011) Grogin, N. A., Kocevski, D. D., Faber, S. M., et al. 2011, ApJS, 197, 35
- Hickox et al. (2014) Hickox, R. C., Mullaney, J. R., Alexander, D. M., et al. 2014, ApJ, 782, 9
- Hopkins et al. (2007) Hopkins, P. F., Lidz, A., Hernquist, L., et al. 2007, ApJ, 662, 110
- Jones et al. (2016) Jones, M. L., Hickox, R. C., Black, C. S., et al. 2016, ApJ, 826, 12
- Kocevski et al. (2012) Kocevski, D. D., Faber, S. M., Mozena, M., et al. 2012, ApJ, 744, 148
- Koekemoer et al. (2011) Koekemoer, A. M., Faber, S. M., Ferguson, H. C., et al. 2011, ApJS, 197, 36
- Kriek et al. (2009) Kriek, M., van Dokkum, P. G., Labbe, I., et al. 2009, ApJ, 700, 221
- Lintott et al. (2008) Lintott, C. J., Schawinski, K., Slosar, A., et al. 2008, MNRAS, 389, 1179
- Lopes et al. (2016) Lopes, P. A. A., Rembold, S. B., Ribeiro, A. L. B., Nascimento, R. S., & Vajgel, B. 2016, MNRAS, 461, 2559
- López-Sanjuan et al. (2009) López-Sanjuan, C., Balcells, M., Pérez-González, P. G., et al. 2009, A&A, 501, 505
- Lotz et al. (2011) Lotz, J. M., Jonsson, P., Cox, T. J., et al. 2011, ApJ, 742, 103
- Lotz et al. (2008) Lotz, J. M., Davis, M., Faber, S. M., et al. 2008, ApJ, 672, 177
- Masters et al. (2010) Masters, K. L., Mosleh, M., Romer, A. K., et al. 2010, MNRAS, 405, 783
- Menanteau et al. (2006) Menanteau, F., Ford, H. C., Motta, V., et al. 2006, AJ, 131, 208
- Momcheva et al. (2016) Momcheva, I. G., Brammer, G. B., van Dokkum, P. G., et al. 2016, ApJS, 225, 27
- Peng et al. (2002) Peng, C. Y., Ho, L. C., Impey, C. D., & Rix, H.-W. 2002, AJ, 124, 266
- Rosario et al. (2015) Rosario, D. J., McIntosh, D. H., van der Wel, A., et al. 2015, A&A, 573, A85
- Schawinski et al. (2015) Schawinski, K., Koss, M., Berney, S., & Sartori, L. F. 2015, MNRAS, 451, 2517
- Schawinski et al. (2012) Schawinski, K., Simmons, B. D., Urry, C. M., Treister, E., & Glikman, E. 2012, MNRAS, 425, L61
- Schawinski et al. (2007) Schawinski, K., Thomas, D., Sarzi, M., et al. 2007, MNRAS, 382, 1415
- Schawinski et al. (2010) Schawinski, K., Urry, C. M., Virani, S., et al. 2010, ApJ, 711, 284
- Schawinski et al. (2014) Schawinski, K., Urry, C. M., Simmons, B. D., et al. 2014, MNRAS, 440, 889
- Shi et al. (2009) Shi, Y., Rieke, G., Lotz, J., & Perez-Gonzalez, P. G. 2009, ApJ, 697, 1764
- Simmons et al. (2011) Simmons, B. D., Duyne, J. V., Urry, C. M., et al. 2011, ApJ, 734, 121
- Simmons & Urry (2008) Simmons, B. D., & Urry, C. M. 2008, ApJ, 683, 644
- Simmons et al. (2013) Simmons, B. D., Lintott, C., Schawinski, K., et al. 2013, MNRAS, 429, 2199
- Skelton et al. (2014) Skelton, R. E., Whitaker, K. E., Momcheva, I. G., et al. 2014, ApJS, 214, 24
- Smethurst et al. (2015) Smethurst, R. J., Lintott, C. J., Simmons, B. D., et al. 2015, MNRAS, 450, 435
- Somerville et al. (2008) Somerville, R. S., Hopkins, P. F., Cox, T. J., Robertson, B. E., & Hernquist, L. 2008, MNRAS, 391, 481
- Strateva et al. (2001) Strateva, I., Ivezic, Z., Knapp, G. R., Narayanan, V. K., & Strauss, M. A. 2001, AJ, 122, 1861
- Tojeiro et al. (2013) Tojeiro, R., Masters, K. L., Richards, J., et al. 2013, MNRAS, 432, 359
- Treister et al. (2012) Treister, E., Schawinski, K., Urry, C. M., & Simmons, B. D. 2012, ApJ, 758, L39
- van der Wel et al. (2012) van der Wel, A., Bell, E. F., Häussler, B., et al. 2012, ApJS, 203, 24
- Whitaker et al. (2014) Whitaker, K. E., Franx, M., Leja, J., et al. 2014, ApJ, 795, 104
- Wolf et al. (2009) Wolf, C., Aragón-Salamanca, A., Balogh, M., et al. 2009, MNRAS, 393, 1302
- Xue et al. (2016) Xue, Y. Q., Luo, B., Brandt, W. N., et al. 2016, ApJS, 224, 15
- Xue et al. (2011) —. 2011, ApJS, 195, 10
Appendix A Comparison to GOODS Morphology in the Literature
A.1. Van der Wel et al. 2012
van der Wel et al. (2012) found structural parameters for 100,000 galaxies in all five CANDELS fields, using GALFIT on YJH images. We found that we obtained systematically lower Sérsic indices (we will label ) than their values for the Y band (). The difference of the two Sérsic indices () is shown in Figure 12.
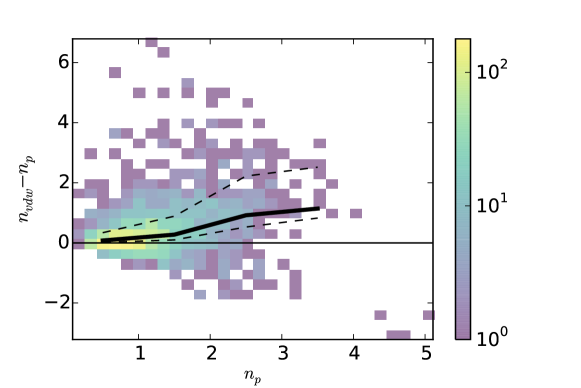
The difference can be attributed to the fact that the redder images that van der Wel et al. (2012) used measured the morphology of the older stellar population of the galaxy, which tends be more spheroidal than the star forming disk. However we note that had we used their Sérsic index determinations, would be classified differently. The color mass distributions largely look similar.
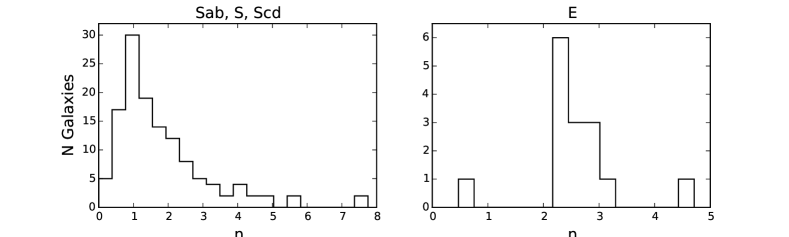
A.2. Bundy et al. 2005
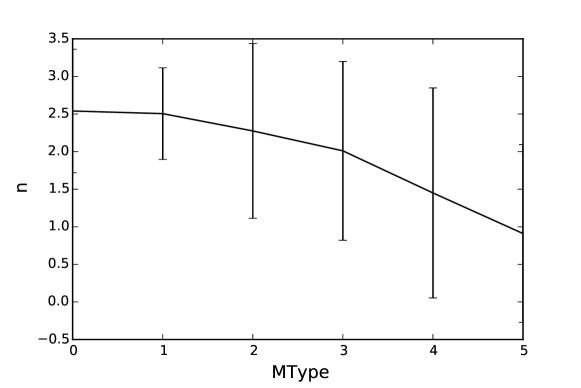
Bundy et al. (2005) assigned morphological types to -band GOODS galaxies (). Figure 13 shows the distributions of Sérsic indices for classified spiral galaxies (types Sab, S, and Scd) and for elliptical galaxies (E). The majority of spiral (late-type) galaxies classified in Bundy et al. (2005) were also found to have in our analysis. Conversely, elliptical galaxies were mostly measured to have . We also plot the median of our Sérsic index for each morphological type determined in Bundy et al. (2005) (which goes from 0 to 5 along the Hubble diagram, corresponding to E, E/S0, S0, Sab, S, Scd, respectively) in Figure 14. While there is a large spread, our Sérsic indices decrease as the Bundy morphology shifts to late-type, as expected.