e-mail: bugaich@iop.kiev.ua
MULTIPLEXING AND SWITCHING
OF LASER BEAMS BASED ON CROSS-CORRELATION
INTERACTION OF PERIODIC FIELDS
Abstract
The work is devoted to the study of the correlation technique of formation of laser beams under conditions of the interaction of coherent fields spatially periodic in the transverse direction. It is aimed at the application of this technique to the multiplexing (splitting) of an input laser beam to several output ones, management of the energy of these beams, and their clustering and debunching according to required time algorithms.
1 Introduction
The idea to use periodic diffraction elements for a directional transformation of light beams was appeared simultaneously with the invention of these elements. Well known is the importance of a diffraction grating, which splits the incoming beam into several secondary ones. In dependence on the structure of a groove of the grating, one can amplify, decrease, or make equal the intensities in the diffraction orders [1, 2]. Taking into consideration that the autocorrelation function of any periodic distribution represents also a periodic structure [3], the diffraction gratings are applied to practically important correlation schemes for the information processing (in particular, to the schemes with synthetic aperture [4], holographic correlatora with discrete representation of the signal [5], and so on). In the present work, we are developing further capabilities to use periodic structures for the management of laser beams, according to [6]. The purpose of the work is to increase the factors of influence on the formed field and, consequently, to enlarge the area of practical problems, which can be solved in such a way. We are considering the task, when the interference pattern created by two laser beams illuminates a flat phase diffraction grating, which can be moved in the transverse direction. This problem represents a special case of the correlation approach (two-stage method) to form an optical field, which has a complex structure and a required distribution of the energy at a technological target [7]. In addition, it can be considered as an extension of the dynamic holography [8, 9] to the case where the phase elements, in which a strong link between the distribution of the phase of the grating and the intensity fringes of the interference pattern is broken, are in use. In our method, the light field illuminating a phase mask has a periodic structure. In so doing, both the phase distribution of the field and the phase mask itself may be varied by changing their periods, the structure of phase indices, and their mutual shift. In particular, this distribution of the illumination field, which is created by the interference of two or more beams, can be replaced by its synthetic analog, which forms an ‘‘equivalent’’ field. The specially calculated synthetic hologram, which is illuminated only by one beam, may be used as such analog. In our work, we will investigate the ‘‘equivalent’’ field formed by a periodic phase grating, which has the rectangular profile. We will prove also that the field formed by such grating substitutes a generally known pattern of interference fringes. The lack of the obligatory correspondence of the distributions of phase profiles between the input field and the diffraction grating also promotes to introduce new dynamical algorithms for the multiplexing, scanning, and switching of shaped beams.
2 Mathematical Background of the Correlation Method for Periodic Functions
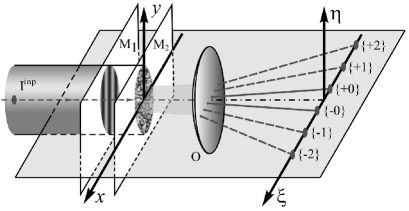
The basic scheme of the correlation method based on the periodic structures for a transformation of laser beams is shown in Fig. 1.
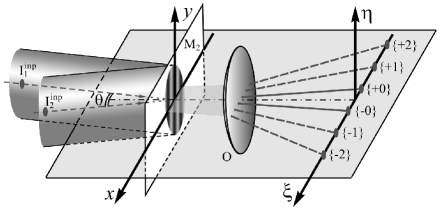
According to this scheme, two plane waves form the interference fringe pattern (let us call it the light grating), which illuminates a periodic phase grating. The periodic intensity distribution on the input is transformed into a set of diffraction orders at the back focal plane of the objective on the output of the system. The intensity of each diffraction order is easily controllable by changing the parameters of the scheme, including the mutual spatial shift of the periodic structures relative to one another.
The main idea of the proposed technique consists in the fact that one should create a ‘‘coupled system’’ of the light grating and the material grating. In such coupled system, each diffraction order on the output is formed as a result of the interference of partial waves of the light grating.
The purpose becomes to find the special conditions to manage the intensity in each diffraction order. That may be either the amplification or suppression of some of them, nullification, or doing them with equal intensities, what is made in the multiplexing schemes.
The theoretical framework of the correlation technique with periodic structures involves the known theorems for the displacement and for the convolution of two functions. They are used to find matching between the product of the distributions of two fields and the convolution for the Fourier transforms (angular spectra) of these fields. Thus, the correlation method of the formation of beams in different diffraction orders lies in the consistent impact of amplitude-phase converters on a previously diffracted field. In the frame of this work, this is a transformation of the periodic light field by means of a phase grating.
Now, let us consider the case where a plane light wave propagates through two sequentially arranged modulators and . Note that the description of one of the modulators () will correspond to the fringe pattern of the light intensity in the interference area (see Fig. 1).
The angular spectrum of the output field is defined as the Fourier transform of the diffraction field after these both modulators:
| (1) |
where and are the operators of Fourier transformation and convolution of functions, respectively:
| (2) |
Here, are the spatial coordinates in the plane of the modulators (in the front focal plane of the objective, which makes the Fourier transformation of the light field), are the angular coordinates in the plane of the formation of diffraction orders (in the back focal plane of the objective).
In the case of one-dimensional periodic structures, we can present the transmittance of the modulators in the form of the convolution between the distribution in a single ‘‘window’’ (of an individual groove) and a comb function:
| (3) |
where is the width of the ‘‘window’’ . In the extended form, we have the integral
| (4) |
Thus, the output angular spectrum will be calculated according to formula (1) with regard for integral (4), which contains the specific profile of a converter.
3 Calculations of Algorithms
for Switching and Spatial
Multiplexing
for the Correlation Scheme
As an example, we consider the transformation of the interference field with a sinusoidal intensity profile by means of a phase diffraction grating, which has either rectangular (meander) or triangular phase profile. Then we will have the following expressions for the rectangular and triangular phase profiles in the ‘‘window’’, respectively:
| (5) |
| (6) |
and
| (7) |
where the constant sets the phase profile of the grating. We choose the physical size (the grating aperture) so that it includes an integer number of grooves, i.e., . The parameter determines the shift of the grating along the coordinate and relative to the interference fringes.
The input interference field is formed by two beams and that have equal intensities and plane wavefronts:
| (8) |
where is the frequency of the laser radiation, are the wave vectors of the beams, and are their input phases. The wave vectors have the components
and their interference occurs at the plane .
Let, at the initial time moment, and . Then the expression for the interference pattern has the form
| (9) |
The angle of convergence of the beams is chosen from the condition that numbers of the periods of the interference pattern fits on the aperture of the diffraction grating. Then formula (9) can be rewritten as follows:
| (10) |
The period of the interference pattern will be related to the aperture of the grating by the expression . The distribution of the intensity of the interference pattern on the plane at an arbitrary time in dependence on the coordinate will be proportional to the expression
| (11) |
The position and the intensities of diffraction orders are determined by the following important parameters: by a relative spatial shift between the grating and the interferences fringes, by the multiplicity of the period of the diffraction grating relative to the interference pattern, and by a phase profile of the grating.
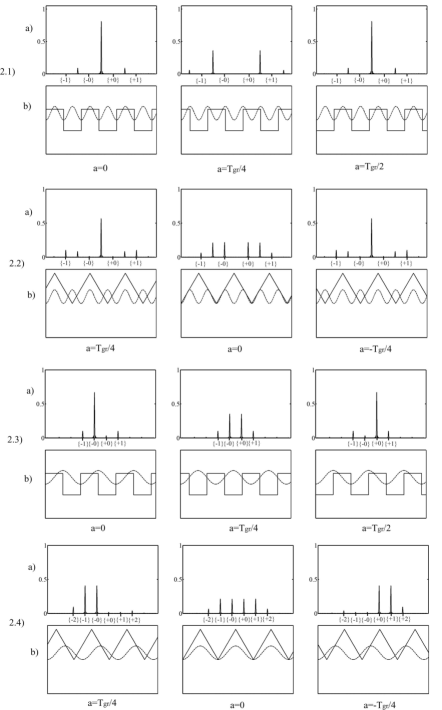
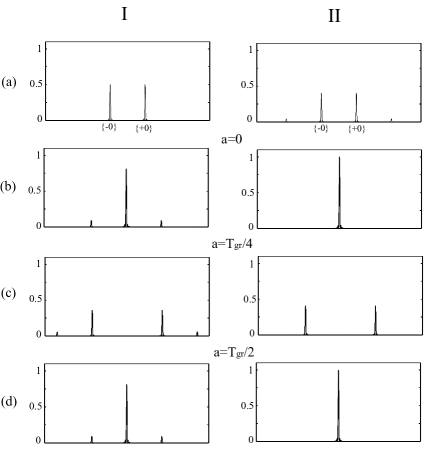
We have found the conditions of the implementation of several scenarios to make the spatial multiplexing, as well as the management of the intensities of the output beams, when the fringe interference pattern illuminates a phase grating, which has either the rectangular or triangular form of grooves. The results are given in Fig. 2.
In Figs. 2.1 and 2.2, the period of the interference pattern is doubled in comparison with the period of the diffraction grating. The central peak in Fig. 2.1, which is created under the conditions of and , may be redistributed to two channels (left and right) with equal intensities under the condition . Therefore, the parameter of the switching of channels is the mutual spatial shift between the light periodic structure and the diffraction grating.
If we replace the rectangular grating by a triangular one, then the left and right channels will become doublets, as it is seen from Fig. 2.2 under the condition . Thus, one can create four beams with the same intensity. We have obtained the possibility to form either one, or two, or four beams of equal intensities by changing the grating profile and the mutual transverse shift. Owing to the simple structures of the phase profiles, the intensities of created beams can be easily adjusted with the use of computer-controlled phase modulators.
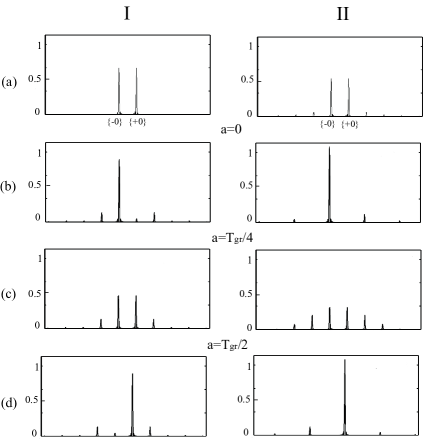
In Figs. 2.3 and 2.4, the periods of the light pattern and of the diffraction grating are the same. For the rectangular grating profile, one can create two channels for the switching: we can either leave only the left one (Fig. 2.3 for ), or only the right one (), or the both simultaneously (). In the case of a triangular grating profile (Fig. 2.4) under the condition , four diffraction maxima (communication channels) with equal intensities are created. If the shift is changed by the value of , only two left channels appear, and there are only two right channels for the shift .
Each of the described scenarios for the change of both the intensity and the location of the diffraction orders are determined due to the shift, phase relief, and mutual dispositions of the periodic structures. Therefore, all these factors are important to make manipulation of the spatial channels on the output of the correlation scheme. On a practical level, controlling these parameter may be implemented with the help of a spatial electro-optical modulator of phases, which is placed on the area of the formation of interference (or created by another way) fringes. This modulator could create a grating, parameters of which can be changed with a computer.
4 Experimental Study
We have studied the angular spectra of the generated fields, namely the distribution of the intensities in the diffraction orders of the correlation scheme. The optical scheme of the experimental set-up corresponds to Fig. 2.1. The radiation of a He–Ne laser was expanded by a telescopic system and filtered by a system of diaphragms. The resulting beam with uniform distribution of the energy in the cross-section and with a plane wavefront is forwarded onto a beam-splitter device to obtain two beams for their later interference. Moreover, the block of the beam-splitter device provides a fine adjustment of the angle between two beams. These two beams form the interference pattern, which illuminates a diffraction grating. The grating is mounted in a holder, which adjusts a required orientation of the grating in the horizontal and in the vertical directions. The necessary ratio between the period of interference fringes and the period of the diffraction grating is achieved by the adjustment of the convergence angle between the interfering beams.
The angular spectrum of the diffraction field is observed on a back focal plane of a high-quality Fourier objective. The beams of the diffraction orders, after a necessary magnification, have been directed to photodiodes by a system of prisms. Their oscillograms have been registered and then processed by a computer. In the experimental investigations, we used the phase gratings, which had a rectangular profile.
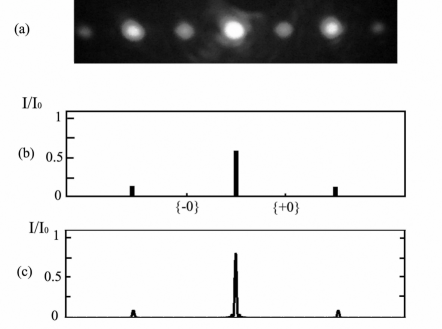
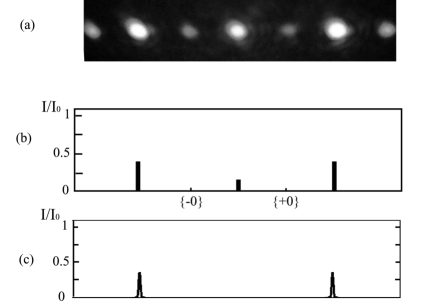
The results of experimental researches of the management of the angular spectrum and their comparison with the theoretical calculations are presented in Fig. 3. The grating has the rectangular phase profile with the modulation depth equal to . Such value of the modulation depth can be easily controlled experimentally, because, in this case, one can observe the appearance of a strong maximum between and diffraction orders together with a strong decrease in the intensities in these main diffraction orders. This effect is well observed in Fig. 3. In the experiments, we apply a usual interference pattern on the input of the system that was formed by two plane waves of equal intensities. In Figs. 3 and 4, the data of the experimental implementation of two scenarios depending on the spatial shift of the diffraction grating relative to the interference pattern and the comparison with the theoretical calculations are given.
Moreover, the measured values of the normalized intensities practically coincide with the theoretical calculations: in Fig. 3, the measured values are for the central maximum and for the side peaks, whereas corresponding calculated values are and . In the Fig. 4 the measured intensities are for the side peaks and for the central peak, the calculated intensities for the side peaks are . Note, that the central maximum is damped not completely in the experiments. We explain it by the fact that the two input waves could not be entirely equal in a real experimental set-up.
5 Equivalent Mask with one Plane Wave
for the Substitution of Interference Pattern
For practical using of the correlation scheme, there will be appropriate the exclude the interferometer, which play a role of a ‘‘generator’’ of a light periodic pattern in a form of interference fringes. The best decision for this purpose is the substitution of the interferometer (as well as the interference pattern) by some amplitude-phase mask, which has such the complex amplitude of the transmittance that is identical to the complex amplitude describing the interference pattern, and therefore, it has the following form:
| (12) |
After the illumination of this mask with the help of one flat wave, we obtain the same distribution of the fringe pattern, like in the previous cases, on the plane , where the diffraction grating is set. The calculations with the use of this mask give, naturally, the same results, as in the case of using the interference pattern. For the only exception, that the amplitude of distribution (12) takes a half of the energy of the beam illuminating this mask. Therefore, it has the sense to consider the case in the correlation technique where one uses a distribution similar to (12), but another mask, which contains only the phase part of , i.e,
| (13) |
One can see that such mask represents a simple periodic phase structure with rectangular profile of a relief with the depth equals to radians, in fact, the diffraction grating with rectangular profile of the grooves. Such grating can be easily fabricated or be simulated on the controllable phase modulator.
The experimental set-up of the correlation scheme with equivalent mask is shown in Fig. 5, and it is differ only by the input part comparing with the scheme in Fig. 1. In the case of the ‘‘artificial’’ interference pattern, only one plane wave comes on the input of the optical scheme, and it goes through two diffraction gratings, which are sequentially arranged close to each other. The phase distribution in the equivalent grating is rectangular according to expression (13), but the phase distribution for the grating of a converter may be arbitrary, in particular, like it was described in the previous section.
In the Figs. 6 and 7, we present the results of calculations corresponding to the use of the ‘‘equivalent’’ mask (13) together with the converter grating with the rectangular profile of a groove. In Fig. 6, the diffraction grating of a converter has the rectangular phase profile with the modulation depth and the double period compared with the period of the equivalent mask (see Fig. 2.1). In Fig. 7, the converter has the rectangular phase profile with the modulation depth and the same period as the period of the equivalent mask (see Fig. 2.3).
One can see that the substitution of the interference pattern by the equivalent mask gives very similar results, and they are completely suitable in practical schemes of the switching and multiplexing.
We have carried out the experimental researches, which are similar to those described in Section 4. The same diffraction converters are used in this experiments, but, instead of the interference pattern, we apply the equivalent phase mask placed before the converter . So that, the plane wave firstly diffracts on the equivalent mask. After that, the created field diffracts on the grating. The latter is set in the near field of the mask at the distance according to our estimations. We have obtained that the equivalent mask very efficiently replaces the interference pattern.
6 Conclusion
The application of the correlation technique based on a periodic structure expands capabilities of the schemes for the multiplexing of a laser beam for such problems, where one needs changes of the intensities in the output beams, their location on a technological target, as well as for the switching of the optical channels. During this process, one can implement dynamic scenarios of the multiplexing, that are almost not attainable during the traditional use of one diffraction grating even with a complicated profile of an individual groove. These advantages of the correlation technique are achieved due to increasing the number of factors, which impact the formation of beams. In particular, they are the dynamics of a transverse shift of two gratings relative to each other and the possibility to change the multiplicity of their periods. At the same time, the correlation approach conserves a relative simplicity of a phase relief in individual grooves in both used modulators, which facilitates their practical application as computer-controllable converters.
References
- [1] V.A. Soifer, V. Kotlar, L. Doskolovich, Iterative Methods for Diffractive Optical Elements Computation (London, Taylor and Francis, 1997).
- [2] Yu.V. Miklyaev, W. Imgrunt, V.S. Pavel’ev, V.A. Soifer, V.G. Kachalov, V.A. Eropolov, L. Aschke, M.V. Bolshakov, V.N. Lisochenko, Komp’yuter. Opt. 35, 42 (2011).
- [3] A. Papoulis, Systems and Transforms with Application in Optics (McGraw-Hill, New York, 1968).
- [4] A.N. Malov, V.N. Morozov, I.N. Kompanets, Yu.M. Popov, Kvant. Elektr. 4, 1981 (1977).
- [5] A. Gnatovsky, O.V. Zolochevskaya, A.P. Loginov, L.K. Yarovoi, SPIE 3055, 186 (1996).
- [6] V.O. Gnatovskyy, S.A. Bugaychuk, A.M. Negriyko, I.I. Pryadko, A.V. Sidorenko, IEEE CFP13814, 378 (2013).
- [7] O.V. Gnatovskiy, A.M. Negriyko, V.O. Gnatovskyy, A.V. Sidorenko, Ukr. J. Phys. 58, 122 (2013).
- [8] V.L. Vinetskii, N.V. Kukhtarev, Dynamic Holography (Kyiv, Naukova Dumka, 1983) (in Russian).
-
[9]
S. Odoulov, M. Soskin, A. Khyzhnyak,
Oscillators with Degenerate Four-Wave Mixing (Harwood, Chur, London, 1991).
Received 03.04.15
С.А. Бугайчук, В.О. Гнатовський,
А.М. Негрiйко, I.I. Прядко
МУЛЬТИПЛIКАЦIЯ ТА КОМУТАЦIЯ
ЛАЗЕРНИХ ПУЧКIВ ПРИ
КРОС-КОРЕЛЯЦIЙНIЙ
ВЗАЄМОДIЇ ПЕРIОДИЧНИХ ПОЛIВ
Р е з ю м е
Робота присвячена
дослiдженню кореляцiйного методу формування лазерних пучкiв пiд час
взаємодiї перiодичних у поперечному напрямку когерентних полiв i
спрямованого на застосування цiєї методики для мультиплiкацiї
(розщеплення) первинного лазерного пучка на декiлька вторинних,
керуванням величиною енергiї в цих пучках, їх групуванням i
розгрупуванням згiдно з потрiбним часовим алгоритмом.