Ultraviolet and Optical Emission-line Outflows in the Heavily Obscured Quasar SDSS J000610.67+121501.2: At the Scale of the Dusty Torus and Beyond
Abstract
Broad emission-line outflows of active galactic nuclei (AGNs) have been proposed for many years but are very difficult to quantitatively study because of the coexistence of the gravitationally-bound and outflow emission. We present detailed analysis of a heavily reddened quasar, SDSS J000610.67+121501.2, whose normal ultraviolet (UV) broad emission lines (BELs) are heavily suppressed by the Dusty Torus as a natural “Coronagraph”, thus the blueshifted BELs (BBELs) can be reliably measured. The physical properties of the emission-line outflows are derived as follows: ionization parameter , column density cm-2, covering fraction of and upper limit density of cm-3. The outflow gases are located at least 41 pc away from the central engine, which suggests that they have expanded to the scale of the dust torus or beyond. Besides, Ly shows a narrow symmetric component, to our surprise, which is undetected in any other lines. After inspecting the narrow emission-line region and the starforming region as the origin of the Ly narrow line, we propose the end-result of outflows, diffusing gases in the larger region, acts as the screen of Ly photons. Future high spatial resolution spectrometry and/or spectropolarimetric observation are needed to make a final clarification.
1 Introduction
The blueshifted emission lines (blueshifted-ELs) and broad absorption lines (BALs), which are the typical presentations of active galactic nuclei (AGNs) outflows, have been widely studied. They are potentially one of the most important pieces of feedback from AGNs and may play a crucial role in galaxy formation and evolution, connecting the central supermassive black holes (SMBHs) to their host galaxies and regulating their co-evolution (e.g., Granato et al. 2004; Scannapieco & Oh 2004; Hopkins et al. 2008). Previous works suggested that the AGN outflows can reach from the small scale (at or outside of the broad-line region (BELR), e.g., Zhang et al. 2015b; Williams et al. 2016), to the intermediate scale (the dusty torus, e.g., Leighly et al. 2015; Zhang et al. 2015c; Shi et al. 2016), the large scale (the inner narrow-line region (NELR), e.g., Komossa et al. 2008; Crenshaw et al. 2010; Ji et al. 2015; Liu et al. 2016), and even the entire host galaxy of the quasar (e.g., Zakamska et al. 2016). There is general agreement that there has to be a radial component of motion and some opacity source; however, questions regarding the origins, whether homologous or not, and the properties themselves of the blueshifted-ELs and BALs remain interesting subjects of debate. They can also be used as important test beds for models of the BELR, broad absorption line region (BALR), and NELR.
Comparatively, studies on the blueshifted-ELs are more difficult than those on the BALs. This is because the BALs have high-speed blueshifted (up to a velocity of ) and broad-width (at least 2000 km s-1) troughs from a wide range of species, such as Mg II, Al III, and Fe II, to N V, C IV, Si IV, and O VI (e.g., Weymann et al. 1991; Hall et al. 2002; Reichard et al. 2003; Trump et al. 2006; Gibson et al. 2009; Zhang et al. 2010), and even from the hydrogen Balmer series (e.g., Hall 2007; Ji et al. 2012, 2013; Zhang et al. 2015c) and metastable He I (e.g., Liu et al. 2015, 2016), whose obvious features allow the BALs to be easily detected and measured. Unfortunately, the broad and narrow blueshifted-ELs (BBELs and BNELs) are generally mixed with the normal broad or narrow lines. The existence of the blueshifted-ELs is expressed by the differences in the line profile (e.g., asymmetry, width, peak and/or velocity centroid) with respect to the lines emitting from the BELR and NELR (e.g., Gaskell 1982; Wilkes 1984; Crenshaw et al. 1986, 2010; Marziani et al. 1996, 2013; Richards et al. 2002; Zamanov et al. 2002; Boroson 2005; Snedden & Gaskell 2007), and the strength measurement relies on the blueshift and asymmetry index (BAI) for C IV (Wang et al. 2011, 2013), or the distinguishment of the blueshifted wings for [O III]5007 (e.g., Komossa et al. 2008; Zhang et al. 2011; Zakamska et al. 2016) and for H and Mg II (e.g., Marziani et al. 2013).
Though the fundamental parameters of AGNs that affect the blueshifted-ELs have been found, such as the Eddington ratio (e.g., Komossa et al. 2008; Wang et al. 2011), the physical properties and locations of these outflows are hard to be investigate, except for a limited number of sources, in which the spectra of the blueshifted-ELs from a range of species can be reliably measured. For example, Leighly et al. (2004a) identified broad, strongly blueshifted high-ionization lines of C IV and N V, which are dominated by emission from the wind in two extreme narrow-line Seyfert 1 galaxies ( 1000 km s-1): IRAS 13224-3809 and 1H 0707-495. The photoionization analysis favors a wide range of densities () and a relatively high ionization parameter (). Moreover, the blueshifted-EL emission regions and the BELRs do not differ in the location, as was inferred for both (Leighly et al. 2014b). Liu et al. (2016) identified the above three phenomena produced by the AGN outflows in the optical to near-infrared (NIR) spectra of SDSS J163459.82+204936.0, i.e., a cuspy BNEL component in H, He I5876,10830, a BBEL component of He I10830, the bulk blueshifting of [O III]5007, and BALs in Na I D and He I5876,10830. The physical parameters determined with for absorption-line and emission-line outflows are very close, with and , and the distance of the outflow materials are from the central, exterior of the torus. Of special interest is the similarity of the physical parameters and the locations, which strongly suggest blueshifted-ELs and BALs should be generated in the common outflowing gas.
In a study of the intermediate-width emission lines (IELs), Li et al. (2015) used the Dusty Torus as a “Coronagrap”, which heavily suppress the normal broad emission lines (BELs) in OI 287, thus, the ultraviolet (UV) IELs can be reliably detected from the quasar emission-line spectra. This work reminds to us that partially obscured quasars may provide an opportunity to reliably detect the blueshifted-ELs. If the blueshifted-ELs does exist, they would become prominent in the shorter wavelength range where the normal BELs are heavily suppressed. In this work, we report such a infrared-luminous quasar J000610.67+121501.2 (hereafter SDSS J0006+1215), at with outflows revealed in C IV, Ly, and N V BBELs. The organization of this paper is as follows. The data we used will be described in Section 2. We will fit the spectrum and analyze the UV BBELs in Section 3, and discuss the properties and possible origins of BBEL outflows in Section 4. A summary of our results will be given in Section 5. Throughout this paper, we adopt the cold dark matter ‘concordance’ cosmology with H0 = 70 km s-1Mpc-1, , and .
2 Observations
SDSS J0006+1215 is an infrared-luminous quasar with faint ultraviolet (UV) emission. It was first imaged by the Sloan Digital Sky Survey (SDSS; York et al. 2000) at the five optical wide-bands. Meanwhile, the UKIRT Infrared Deep Sky Surveys (UKIDSS; Lawrence et al. 2007) and the Wide-field Infrared Survey Explorer (WISE; Wright et al. 2010) provide the NIR to middle-infrared (MIR) photometric data for SDSS J0006+1215. The photometric data are summarized in Table 1.
The optical spectrum of SDSS J0006+1215 was taken with the SDSS 2.5 m telescope on Dec. 16, 2011, in the SDSS-III Baryon Oscillation Spectroscopic Survey (BOSS; Dawson et al. 2013) and published in the SDSS Tenth Data Release (DR10; Ahn et al. 2013). The BOSS spectrum has a wider wavelength range covering 361 nm - 1014 nm with a resolution of 1300 at the blue side and 2600 at the red side. This instrument is fed by smaller optical fibers, each subtending 2” on the sky (Smee et al. 2013).
The NIR spectrum of SDSS J0006+1215 was performed with the TripleSpec spectrograph of the Hale 200-inch telescope (P200) at Palomar Observatory on Dec. 4, 2015. Four exposures of 240 seconds each are taken in an A-B-B-A dithering model. TripleSpec (Wilson et al. 2004) provides simultaneous wavelength coverage from 0.9 to 2.46 m at a resolution of 1.4 - 2.9 Å with two gaps at approximately 1.35 and 1.85 m owing to the telluric absorption bands. Fortunately, the redshifted H and H emission lines are detected with the TripleSpec at and band, respectively. The raw data were processed using IDL-based Spextool software (Vacca et al. 2003; Cushing et al. 2004).
3 Data Analysis and Results
3.1 Broadband Spectral Energy Distribution
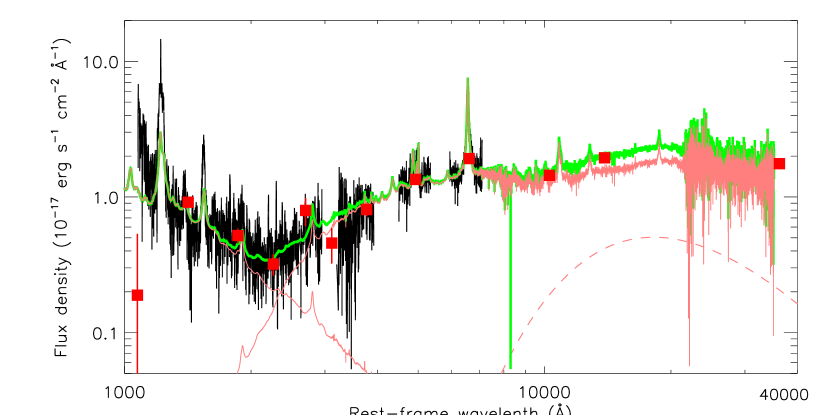
After correcting for the Galactic reddening of mag (Schlegel et al. 1998), we transformed the photometric data and the optical and NIR spectroscopic flux into the rest-frame values with its emission redshift of , which is carefully determined by fitting a Gaussian to the Ly narrow line. The photometric and spectroscopic data are shown by red squares and black and blue curves in Figure 1. Noting that, the absolute flux calibration is operated based on the SDSS and UKIDSS photometry for both optical and NIR spectra. With the multi-wavelength spectroscopic and photometric data, we construct the broadband SED of SDSS J0006+1215 spanning from 1100 Å to 6.65 m in the rest frame. For comparison, the quasar composite combined from the SDSS DR7 quasar composite ( Å; Jiang et al. 2011) and the NIR template ( Å; Glikman et al. 2006). It is obvious that the observed SED of SDSS J0006+1215 shows a very different shape from the quasar composite. There is a striking “V”-shape turning at -band in the SED of SDSS J0006+1215, which is likely to be caused by a type of excess broadband absorption or the spectral combination of two different continuum slopes.
For the first case, the unusual shape is quite similar to the excess broadband absorption near 2250 Å (EBBA) in BAL quasars reported by Zhang et al. (2015a). Therefore, the spectrum of SDSS J0006+1215 is fit to search the quasar-associated 2175 Å absorber using the quasar composite reddened by a parameterized extinction curve (Fitzpatrick & Massa 1990) in the quasar restframe, where a Drude component represents the potential 2175 Å bump (more details can be found in Section 2 of Zhang et al. 2015a). For SDSS J0006+1215, the parameters of the Drude component are , m-1, and m-1. The bump strength is m. Apparently, the width () and strength () of the bump deviate heavily from those of the bumps for the Milky Way (Fitzpatrick & Massa 1990), LMC (Gordon et al. 2003) curves, and the quasar-associated 2175 Å extinction curves (Jiang et al. 2011; Zhang et al. 2015a) (see Figure 2 of Zhang et al. 2015a). Therefore, the broadband absorption model is not preferred.
For the second case, the fibers feed the SDSS-III BOSS spectrograph subtend a diameter of 2” on the sky, and light from quasar pairs with small angular separations can be included through such a fixed aperture. The physical size, to which the diameter corresponds, indicates that the spectrum of SDSS J0006+1215 would also be polluted by its host galaxy. However, the Ly and H emission lines simultaneously presented in the blue and red ends of the optical-NIR spectrum suggest that both spectral components of SDSS J0006+1215 could be quasar-type spectra. Thus, we try the combination of a red quasar spectrum and a blue one, which are the dominant components of the spectrum of SDSS J0006+1215 with Å and Å, respectively. Here, we use (1) a quasar composite scaled and multiplied by the SMC extinction law with a free parameter to refer to the red component, (2) a quasar composite scaled by a power-law form () to match the warped blueward. In addition, a hot dust emission component is used to add the emission lack of the infrared composite ( Å). Finally, we can decompose the broad-band SED in rest frame wavelength with the following model:
| (1) |
where , and are the factors for the respective components, is the dust extinction to the quasar emission, is the quasar composite, and is the Planck function. We perform least-squares minimization using the Interactive Data Language (IDL) procedure MPFIT developed by C. Markwardt111The Markwardt IDL Library is available at http://cow.physics.wisc.edu/ craigm/idl/idl.html.. The values of and are and , respectively. The typical temperature of hot dust is K. In Figure 1, the sum and three components of the best-fit model are shown by green and pink curves.
The fitting results suggest that the continuum of SDSS J0006+1215 is heavily suppressed by dust reddening; however, the warped blueward is even bluer than the average slope of quasars. We notice that the broadband SED of SDSS J0006+1215 is similar to those of three high polarized quasars, i.e., PKS 2355-535 (Scarpa & Falomo 1997), OI 287 (Li et al. 2015) and SDSS J091501.71+241812.1222 SDSS J0915+2418 was observed with the TripleSpec spectrograph of the Hale 200-inch telescope (P200) at Palomar Observatory on 2014 January 18, and the SPOL CCD imaging/spectropolarimeter at the 6.5 m MMT on 2016 April 3. The MMT/SPOL observation shows that the mean polarzed degree of the optical spectrum is (C.-W. Yang, et al. 2016, in preparation).. This provides a guess that the warped blueward of SDSS J0006+1215 is the scattered component arising from an extensive region. In such a situation, the warped blueward would present high polarized fluxes; unfortunately, the faint magnitudes of SDSS J0006+1215 are unfit for the current spectropolarimetry observation.
3.2 Emission-Line Spectrum
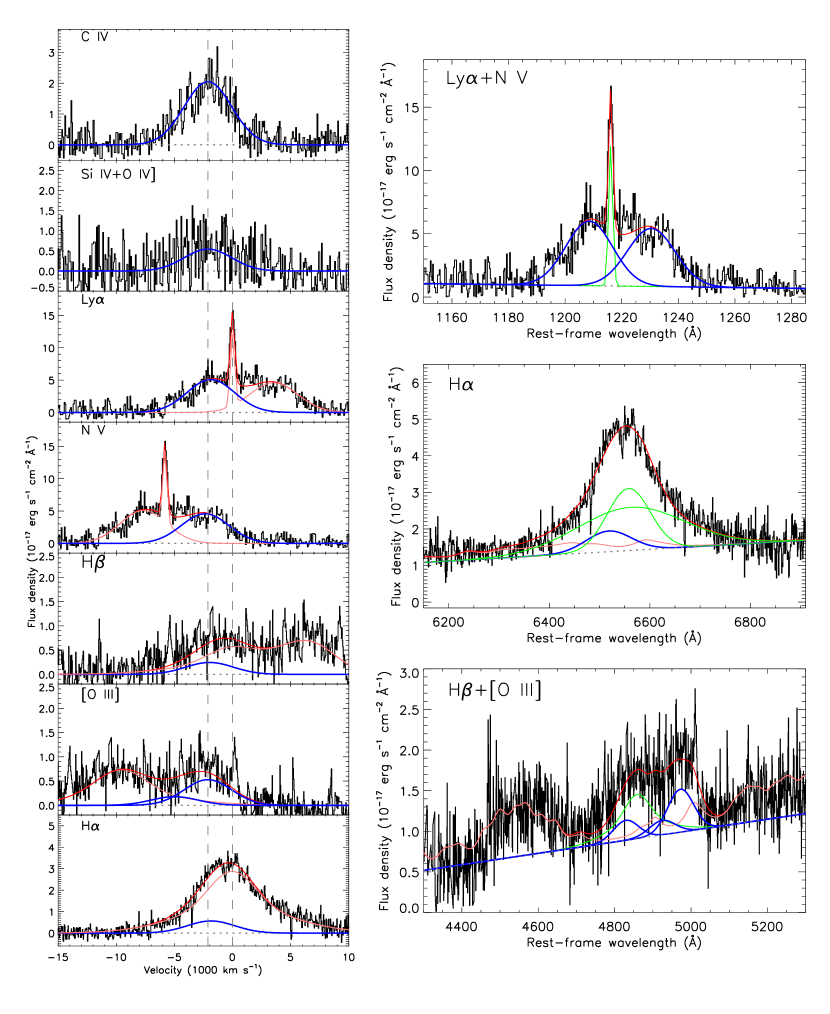
The spectrum of SDSS J0006+1215 shows strong Ly+N V, Si IV+O IV],C IV, H+[O III] and H emission lines; however, ambiguous C III]+Si III]+Al III, and Mg II emission lines are submerged in large noises. To further study the emission lines, we first subtract the underling pseudo continuum from the observed spectra. In this work, linear functions () estimated from two continuum windows are used as the local continua of the emission lines. In H+[O III] and H regimes, we also adopt the I Zw 1 Fe II template provided by Véron-Cetty et al. (2004) and convolve it with a Gaussian kernel in velocity space to match the width of Fe II multiplets in the observed spectra. The continuum windows are [1160, 1180] Å and [1270, 1290] Å for Ly+N V, [1320, 1350] Å and [1430, 1450] Å for Si IV+O IV], [1480, 1500] Å and [1600, 1620] Å for C IV, [4320, 4720] Å and [5080, 5300] Å for H+[O III], and [6150, 6250] Å and [6850, 6950] Å for H. In the right panels of Figure 2, the local continua and Fe II multiplets are marked by gray dashed and pink lines. After subtracting the continuum model, we show the profiles of emission lines in their common velocity space in the left panels of Figure 2.
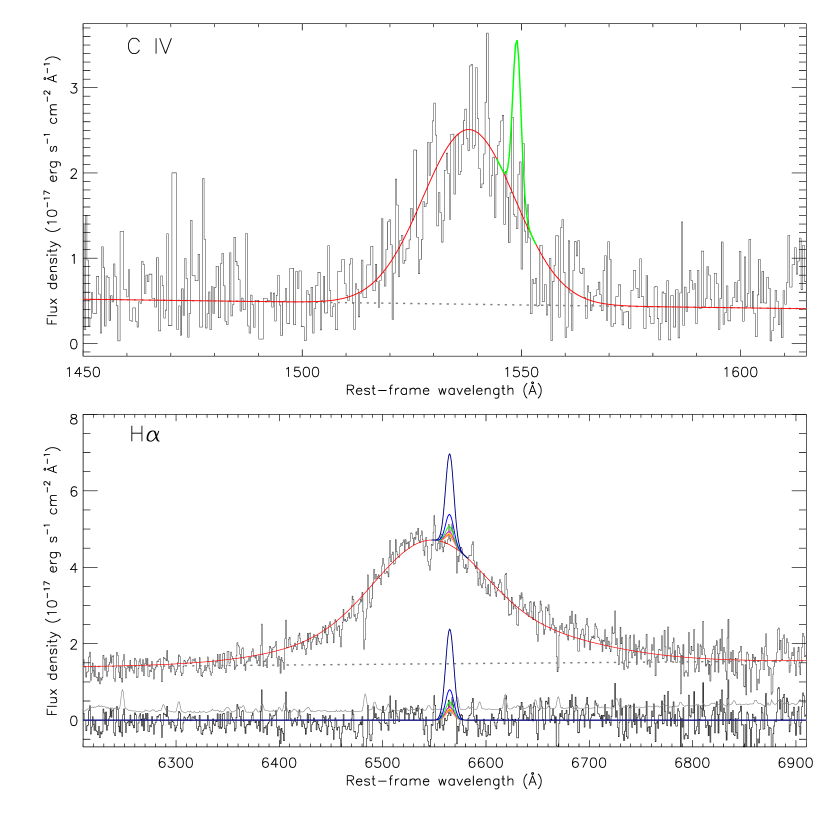
It is also clearly shown that the peaks of broad lines in SDSS J0006+1215 tend to be blueshifted with respect to the Ly narrow line, which indicates the profiles of these broad lines contains an emission-line outflow component. In particular, the line profiles of C IV and Ly+N V of SDSS J0006+1215 are almost the same as those of IRAS 13224-3809 and 1H 0707-495 reported by Leighly et al. (2004a). The profile of the C IV line is even entirely blueshifted (left-top panel); the unusual C IV/H width ratio, , is larger than the value in the quasar composite spectrum (see Table 2). Those suggest that the normal UV BELs of SDSS J0006+1215 might also be obscured as the continuum. If it is true, the C IV profile we observed is dominated by the emission-line outflows and the gravitationally-bound component, i.e.,the normal BEL, of C IV is possibly absence. Here, we start the line profile fittings with the C IV line by one Gaussian. The peak velocity of the C IV BBEL is blueshifted 2119 km s-1 and the full width at half maximum (FWHM) is 4821 km s-1. Later, we use the modelled profile of C IV line to recover the BBEL outflows of other emission lines.
Firstly, the emission line of Si IV is depicted by the scaled C IV profile. Actually, the strength of Si IV line is polluted by the emission of O IV]1397,1399,1401,1404,1407 (see Figure 7 of Vanden Berk et al. 2001). A similar approach is taken in the fitting of the Ly and N V lines, where the normal BEL components of of which the normal BEL components are absent. Then we use one narrow Gaussian component to model the Ly narrow line and two broad Gaussian components to model the Ly and N V BBEL components. The shifts and widths of broad Gaussian components are tied to those of the C IV line. In the right-top panel, the sum of the local continuum (gray dotted line) and the Ly narrow Gaussian (green line) plus the Ly and N V BBEL outflows (blue lines) can well recover the observed spectrum.
Compared with UV emission lines, hydrogen Balmer lines in the optical waveband are still dominated by the gravitationally-bound BELRs, and their profiles might only contain weak BBEL outflows. To separate the hydrogen Balmer emission-line outflows, we use three Gaussian profiles to model the entire profile of the H line. One with the shift and width settings of the C IV line represents the BBEL outflows, and the other two with the center wavelengths set to 6564.41 Å represent the normal H BEL. They are shown by blue and green lines in the right-middle panel, respectively. In the H+[O III] regime, we use the unshifted two-Gaussian profile of the H line to model the normal H BEL (green line) and three Gaussians (blue lines) with the same shifts and widths as the C IV line to model the BBEL outflows of the H and [O III]-doublets in sequence. The details of these components are shown in the right-bottom panel of Figure 2.
For all of the emission lines, we list the best-fit parameters in Table 2. Here, let us revert to the left panels of Figure 2. We show the total fitted profile of each emission line by red lines and the sum of the unblueshifted components of the corresponding line (and other lines only in the Ly+N V or H+[O III] regimes) by pink lines. The differences between the two above items are the BBEL outflows of each line (blue line). The fit between the observed spectra with the continuum subtracted and the total fitted profiles indicates the rationality of the existence of the BBEL outflows in all emission lines. Although the shifts of the peaks of the H line and the profile fitting of the H+[O III] regime strongly suggest the existence of hydrogen Balmer line outflows, it must be said that the BBEL strengths of hydrogen Balmer lines,have large measurement uncertainty because of the multicomponent decomposition.
The errors of line fluxes provided by MPFIT do not account for the uncertainty introduced by the pseudo continuum subtraction. To take this and other possible effects into account, we adopt a bootstrap approach to estimate the typical errors for our emission-line measurement. We generate 500 spectra by randomly combining the scaled model outflow emission lines (denoted as ‘A’) and the scaled model unblueshifted emission lines (denoted as ‘B’), to the scaled model pseudo continuum (denoted as ‘C’). Then, we fit the simulated spectra following the same procedure as described in above paragraphs. For each parameter, we consider the error typical to be the standard deviation of the relative difference between the input () and the recovered (), . These relative differences turn out to be normally distributed for every parameter. The thus estimated typical 1 errors are for C IV, Ly and N V, and for H, H and [O III], the derived flux errors are listed in Table 2.
Various interesting facts are summarized as follows: (1) The Ly narrow line is the only narrow emission line in the spectrum of SDSS J0006+1215. The of the Ly narrow line is km s-1, and the flux is erg s-1. (2) The extreme C IV line with , far exceeds that of typical quasars (). SDSS J0006+1215 and 12 other extremely red objects with are actually classified as Extreme EW objects, which were considered to possibly be caused by suppressed continuum emission analogous to type II quasars in the unified model in Ross et al. (2015). However, flux emitted from the abnormal BELR is the other important reason, and it is interpreted as the BBEL outflows in this work. (3) The HH flux ratio of their unblueshifted components is ; however the intrinsic value of HH of BELR is 3.06, with a standard deviation of 0.03 dex (Dong et al. 2008). The extremely high flux ratio suggests that the extinction of the BELR is , which does not contradict the extinction we measured from the continuum of SDSS J0006+1215. (4) However, the HH flux ratio of the outflowing components is , which suggests that the outflow emission region is not obscured and reddened.
4 Discussion
4.1 Central black hole and underrated luminosity
From the emission line fittings, we can derive the central black hole mass using the commonly used virial mass estimators. We use the broad H line-based mass formalism given by Greene & Ho (2005):
| (2) |
where and are the luminosity and width of H line. Here, we only use the unblueshifted component emitted from the gravitationally-bound BELR. Supposing that the broad emission lines also follow the continuum extinction, the corrected luminosity of the normal H BEL is . Together with , the central black hole mass is estimated to be with an uncertainty of a factor of (from the intrinsic scatter dex for this single-epoch method compared with the results of reverberation mapping, Ho & Kim 2015). The monochromatic continuum luminosity at 5100 Å is directly calculated from the local continuum of the H regime, and the extinction corrected luminosity erg s-1. The bolometric luminosity, erg s-1, is estimated from the monochromatic luminosity, , using the conversion given by Runnoe et al. (2012). Our bootstrap approach showed the typical error of the continuum under H+[O III] emission lines is , then the uncertainty of is also in the order of ten per cent. The derived Eddington ratio is thus . Based on the bolometric luminosity, the amount of mass being accreted is estimated as , where we assumed an accretion efficiency of 0.1, and is the speed of light.
From the point of view of UV-band photometric and spectroscopic observations, SDSS J0006+1215 is a fairly blue but faint quasar. The relative color and absolute magnitude at -band are and , bluer and fainter than most quasars in the SDSS-III/BOSS survey. If our inference regarding the unusual SED of SDSS J0006+1215 is true, it is heavily obscured with . And the above-mentioned characters about color and luminosity are measured based on the scattering component. The luminosity of SDSS J0006+1215 is heavily underestimated; when we compare the UV magnitudes and spectrum of SDSS J0006+1215 with the quasar composite, it is easy to see that the observed magnitudes of SDSS J0006+1215 are fainter than the representation by approximately 4.5 mag. Following the quasar luminosity functions measured in the SDSS-III/BOSS and SDSS-IV/eBOSS (e.g, Ross et al. 2013; Palanque-Delabrouille et al. 2016), we can derive the quasar number density with similar redshift and luminosity as follows: . The total spectroscopic footprint of the BOSS DR12 is pproximately 10,400 deg2, and the value without masked regions due to bright stars and data that do not meet the survey requirement is 9376 deg2. If there are quite a number () of quasars that have a similar SED and redshift similar to those of SDSS J0006+1215, that will redouble the bright-end of the quasar luminosity function and lead to the statistical aberrations regarding the type-I and type-II ratio of the luminous AGNs at an intermediate redshift. A statistical sample study in the future would be very useful to sort out this question.
4.2 Physical properties of the outflows
As described in §3.3, the decomposition of the emission line profiles indicates that the presence of outflows in emission as revealed by the blueshifted components of C IV, Ly, N V, [O III]4959,5007, and hydrogen Balmer lines, with a similar symmetric profile with the blueshifted velocity of 2119 km s-1 and the of 4821 km s-1. In this subsection, we analyze and determine the physical properties of the emission-line outflows using the photoionization synthesis code (the latest version, last described by Ferland et al. 1998).
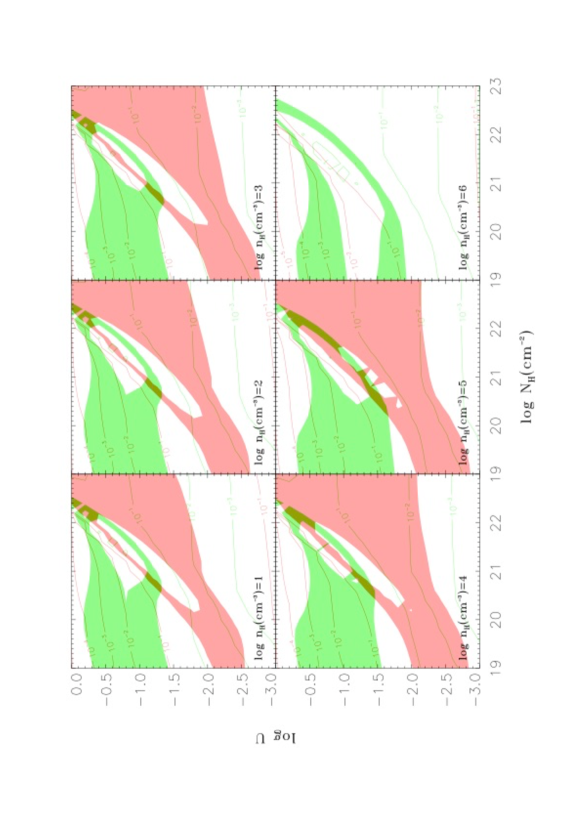
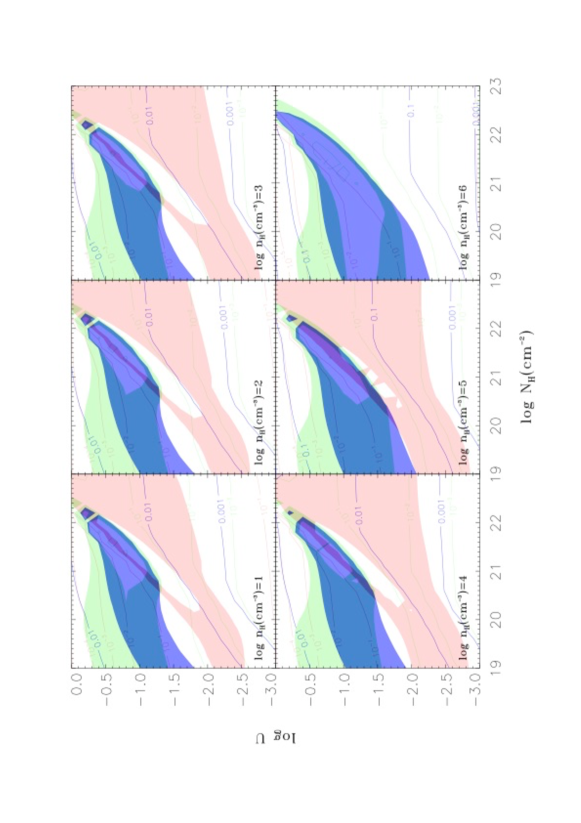
To investigate the physical properties for the emission-line outflows, we use the simulations and confront these models with the measured line ratios to determine the density (), the column density () and the ionization parameter (). We know that the BBEL manifests itself well in C IV, Si IV+O IV], Ly, and N V with the entire emission-line profile being blueshifted since the normal BELs are heavily suppressed, and the BBEL also dominates the emission of [O III]. However, Si IV+O IV] BBEL is weak with large uncertainty. Moreover, the resonant scattering can contribute a significant part of the N V line and it may give rise to anomalous strong N V line (Hamann, Korista & Morris 1993; Wang et al. 2007). Even in some objects, e.g., 0105-265, almost half of the Ly fluxes are scattered (Ogle et al. 1999). Thus, Ly, C IV and [O III] are chosen to confront the models, and Si IV+O IV] and the absent C III] are just used to examine the reasonability of the constrained parameter space. We consider that the BBEL emission region is not obscured, and adjacent lines are not urged. It is better for us to use the line ratios with large differences in ionization potential, i.e., [O III]5007/Ly and C IV/Ly, in order to probe different zone in a gas cloud. Furthermore, the critical density () of [O III]4959,5007 is , and we, thus, infer that the BBEL outflows should originate from the less dense part of the outflows, with a density lower than .
We consider a gas slab illuminated by a continuum source in the extensive parameter space. The outflowing gases are assumed to have uniform density and a homogeneous chemical composition of solar values and be free of dust. The incident SED applied is a typical AGN multi-component continuum described as a combination of a blackbody “Big Bump” and power laws333see details in Hazy, a brief introduction to ; http://www.nublado.org. The “Big Bump” component peaks at 1 Ryd and is parameterized by T= K. The slope of the X-ray component, the X-ray to UV ratio, and the low-energy slope are set to be , , and , respectively. This UV-soft SED is regarded more realistic for radio-quiet quasars than the other available SEDs provided by (see the detailed discussion in §4.2 of Dunn et al. (2010)). We calculated a series of photoionization models with different ionization parameters, electron densities and hydrogen column densities. The ranges of parameters are , and with a step of 0.2 dex.
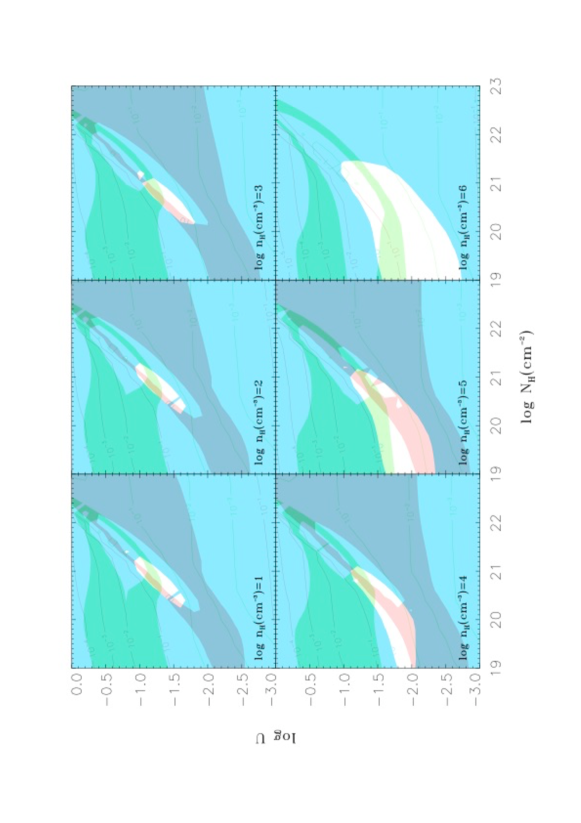
We extract the simulated [O III]5007, C IV and Ly fluxes from the Cloudy simulations and show the line ratios [O III]5007/Ly and C IV/Ly by the red and green lines in Figure 3. The red and green areas show the observed uncertainty ranges of [O III]5007/Ly and C IV/Ly, so the overlapping region is the possible parameter space for the BBEL outflows of this object. Model calculations suggest that the gas clouds in two irregular regions with and can generate the observed line ratios of SDSS J0006+1215 (Figure 3). Fortunately, the absence of C III] gives the upper limit of , the flux ratio of C III]/Ly (cyan area in Figure 4) just cover the high column density region as the reliable parameter space. It is regrettable that the density cannot be more firmly confined. The simulation gives a density range of , which is an upper limit, as [O III]4959,5007 also suggested. In Figure 5, the modeled and observed line ratios of Si IV+O IV] and Ly are shown in blue. It is clear that observed Si IV+O IV]/Ly is overlapped with the [O III]5007/Ly and C IV/Ly areas, but Si IV+O IV]/Ly makes the possible parameter space of the outflowing gases narrower. In summary, the outflowing gases can survive in the parameter space with , , and 22.0. Actually, the reliable parameter-space region is essentially dynamic with the gas density.
4.3 Kinetic luminosity and mass flux of the outflows
Based on the physical properties determined by , we estimate the distance of the outflows away from the central source. The ionization parameter depends on and the rate of hydrogen-ionizing photons emitted by the central source and is given by
| (3) |
in which, is the frequency corresponding the hydrogen edge, is is the density of the outflows and is the speed of light. To determine the hydrogen-ionizing rate , we scale the UV-soft SED to the extinction corrected flux of SDSS J0006+1215 at 5100Å (rest-frame) and then integrate over the energy range eV of this scaled SED. This yields . has been estimated as . Using this value together with the derived and , the lower limit of can be derived to as 41 pc. The radius of broad emission-line regions, , can be estimated using the formula based on the luminosity at 5100Å,
| (4) |
where the parameters, and are and given in Greene & Ho (2005). Thus, the luminosity yields pc. Meanwhile, the radius of the inner side of the dust torus, , can also be estimated based on the thermal equilibrium of the inner side of the torus as
| (5) |
where is the Stefan-Boltzmann constant, is the temperature of inner side of the tours. Then, we get pc. Formulas in Burtscher et al. (2013) and Kishimoto et al. (2011) gave the dust sublimation radii as 5.4 pc and 2.0 pc respectively, smaller than the above estimation. In any case, the outflows are located externally of the torus. This result is consistent with the supposition of our spectral qualitative analysis, i.e., the dusty torus only obscures the continuum and the normal BELR rather than the BBEL outflows.
Assuming that the outflow materials can be described as a thin partially filled shell, the average mass-flow rate () and kinetic luminosity () can be derived as follows (Borguet et al. (2012)),
| (6) |
| (7) |
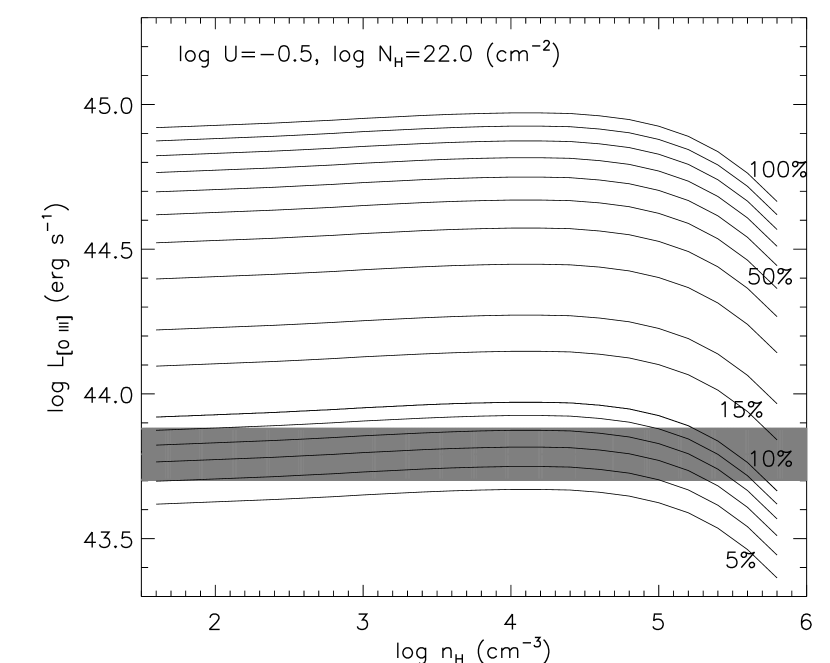
where is the distance of the outflows from the central source, is the global covering fraction of the outflows, is the mean atomic mass per proton, is the mass of proton, is the total hydrogen column density directly derived from the photoionization modeling of the outflow gases, and is the flux weight-averaged velocity of the outflow gases. Here, is replaced by the blueshifted velocity of the BBEL peaks. We note that the BBELs originate from the gases outflowing along different directions with respect to the observer, thus the observed outflow velocity of the BBEL is a sum of the projected velocities of the outflowing gases along different directions, and should be a lower limit of the velocity of the outflow materials. Furthermore, we can estimate the global covering fraction for SDSS J0006+1215 by comparing the measured with the predicted one by the model. In modeling, the emergent values of are output with the covering fraction being assumed to be 0.05 to 1 and are shown as a function of () and in Figure 6. Meanwhile, we show the measured with errors in gray. The comparation gives the global covering fraction for SDSS J0006+1215 to be . In the studies of BAL quasars, the fraction of BAL quasars is generally used to be as the global covering fraction of BAL outflow gases. The fraction is generally in optical-selected quasars (e.g., Trump et al. 2006; Gibson et al. 2009; Zhang et al. 2014), (e.g., Maddox & Hewett 2008) or even 44% (Dai et al. 2008) in NIR-selected quasars. We consider that BAL and BEL outflows may be different appearances viewed from different inclination angles but represent the same physical component which is suggested by many works (e.g., Richards et al. 2011; Wang et al. 2011; Liu et al. 2016), the global covering fraction of BEL outflows will follow these values. The value we obtained in SDSS J0006+1215 is slightly smaller than those estimated from optical-selected BAL quasars. Thus, for the upper limit of the density and the global covering fraction , the kinetic luminosity and mass loss rate are calculated as , for
In general, the high-velocity outflows require kinetic luminosities to be of the order of a few percent of the Eddington luminosity (e.g., Scannapieco & Oh 2004; Di Matteo et al. 2005; Hopkins & Elvis 2010); however, in the case of SDSS J0006+1215, the reported lower limit on the kinetic luminosity () is not of a sufficient value to efficiently drive AGN feedback. Note that this comparison is probably only a lower limit for the following reasons: (1) The weight-averaged velocity we use in Formula 5 is a sum of the projected velocities of the outflowing gases along different directions, the value of which is underestimated and should be a lower limit of the outflow velocity. (2) The distance of the outflows, , is also a lower limit, and the outflow gases perhaps survive at greater distances from the central source.
4.4 Origin of the Ly narrow line
As the only narrow emission line in SDSS J0006+1215, the Ly narrow line presents strong emission. In theory Ly photons scatter in neutral hydrogen until they either escape or are absorbed by dust grains. For SDSS J0006+1215, possible explanations are the NELR emission, the star formation in host galaxy, or the scattering of the obscured Ly emission by the outflows. Before proceeding further, we first discuss whether the NELR and star-forming contribution are preferred in SDSS J0006+1215 through other relevant narrow lines. If Ly of SDSS J0006+1215 is the narrow emission line from the NELR, this situation can be confirmed through the presence of high-ionization lines, e.g., C IV in the rest-frame UV, or other lines such as He II which may also indicate AGN activity. The typical relative intensities of Ly and C IV narrow emission lines in Seyfert 2 spectra are 55 and 12, respectively (from Ferland & Osterbrock 1986). Under this condition, the derived flux of the C IV narrow line is . Like the Ly narrow line, we use one Gaussian with a width of 429 km s-1 to model the theoretical C IV narrow line, which is shown via the green line in the top panel of Figure 7. Apparently, the theoretical the C IV narrow line would not appear in the spectrum of SDSS J0006+1215; otherwise, it should be detected at .
With the assumption that the Ly emission is produced by photoionization by stars and the absence of extinction, one can estimate the H flux while assuming a case B recombination theory (Osterbrock 1989), , where is the Ly escape fraction, is the observed Ly flux and is the H flux. When Ly photons are 100% escaped, we obtain the flux and luminosity of H for the H II region, erg s-1 cm-2 and . Following the relation star formation rate (Kennicutt 1998), is estimated to be . When we use the profile of the Ly narrow line to model the theoretical H (pink line in the bottom panel of Figure 7), the height of this Gaussian profile is 0.26 erg s-1 cm-2 Å-1, which is commensurate with the fluctuations of the NIR spectrum. Previous studies find that is not constant and spans a wide range of values. At a similar redshift to SDSS J0006+1215, the average escape fraction from various methods are per cent by performing a blind narrowband survey in Ly and H (Hayes et al. 2010), 29 per cent at with the comparison between Ly flux and dust-corrected UV continuum (Blanc et al. 2011), per cent at and 3.1 with the comparison between Ly flux and X-ray flux (Zheng et al. 2012), and per cent at with the comparison between Ly and H luminosity (Nakajima et al. 2012). In the bottom panel of Figure 7, we also show the theoretical H profiles with , 80%, 70%, 50%, 30%, and 10% in sequence. It becomes apparent that there is a threshold almost no possibility of the existence of the H narrow line superposed on the H narrow line, however, it also cannot be ruled out by the low spectrum quality of the H regime of SDSS J0006+1215. Thus, the scattering of the obscured Ly emission by the outflows is the most promising option.
Alternately, the NELR in AGNs is the largest spatial scale for the ionizing radiation from the central source. In the case of the NELR, the Ly emission comes from a spatially extended region, so at least some extent physical and kinematic distributions can be mapped out directly. In comparison to the NELR, the star-forming region in galaxies is generally of compact morphology and typically characterized by a small but resolved “core” with kpc scales rather the axisymmetric bi-conic ionized region. The high-resolution Ly imaging will also clearly demonstrate the presence or location of the extent structures. For the possible participation of scattering, spectropolarimetric observations of the Ly line will ask for final clarification.
5 Conclusion
We performed a multiwavelength study of the continuum and emission lines of SDSS J0006+1215, a high redshift quasar with striking “V”-shape SED turning at -band and signatures of outflows in blueshifted emission lines. The multiwavelength SED analysis indicates that the continuum of SDSS J0006+1215 is heavily suppressed by dust reddening with , reducing the high luminosity of to , and the detected UV radiation comes from scattering. In the optical and NIR spectra, the normal BELR-originated emission lines, and the continuum, are obscured, and, thus, the emission-line outflows are significantly presented, even the emission profiles of C IV, Ly and N V are totally dominated by the blueshifted components, suggestive of the AGN outflows. These lines can be used to constrain the physical properties of the outflowing gases by comparing the observed results with the model results of the photoionization synthesis code . The physical parameters we determined for emission-line outflows are and , and the density is regrettable given an upper limit of . Using the luminosity of [O III]5007 to obtain the global covering factor and the upper limit of the density, we estimate the lower limits on the distance of the outflow materials to the central source, the kinetic luminosity and mass loss rate of the outflows, which are pc, , and , respectively. Under conditions of the NELR emission and star formation in the host galaxy, the strengths of the C IV and H narrow lines are investigated based on the relations with the Ly narrow line. The non-detection of the C IV and H narrow lines suggests the Ly narrow line of SDSS J0006+1215 is not likely to be originated in the NELR or the starforming region in the host galaxy. Perhaps the outflow gases, which have expanded to the inner region of the NELR, finally diffuse in the larger region and ace as the scatterers of Ly photons.
References
- Ahn et al. (2014) Ahn, C. P., Alexandroff, R., Allende Prieto, C., et al. 2014, ApJS, 211, 17
- Blanc et al. (2011) Blanc, G. A., Adams, J. J., Gebhardt, K., et al. 2011, ApJ, 736, 31
- Borguet et al. (2012) Borguet, B. C. J., Edmonds, D., Arav, N., Dunn, J., & Kriss, G. A. 2012, ApJ, 751, 107
- Boroson (2005) Boroson, T. 2005, AJ, 130, 381
- Burtscher et al. (2013) Burtscher, L., Meisenheimer, K., Tristram, K. R. W., et al. 2013, A&A, 558, A149
- Crenshaw (1986) Crenshaw, D. M. 1986, ApJS, 62, 821
- Crenshaw et al. (2010) Crenshaw, D. M., Schmitt, H. R., Kraemer, S. B., Mushotzky, R. F., & Dunn, J. P. 2010, ApJ, 708, 419
- Cushing et al. (2004) Cushing, M. C., Vacca, W. D., & Rayner, J. T. 2004, PASP, 116, 362
- Dai et al. (2008) Dai, X., Shankar, F., & Sivakoff, G. R. 2008, ApJ, 672, 108-114
- Dawson et al. (2013) Dawson, K. S., Schlegel, D. J., Ahn, C. P., et al. 2013, AJ, 145, 10
- Di Matteo et al. (2005) Di Matteo, T., Springel, V., & Hernquist, L. 2005, Nature, 433, 604
- Dong et al. (2008) Dong, X., Wang, T., Wang, J., et al. 2008, MNRAS, 383, 581
- Ferland et al. (1998) Ferland, G. J., Korista, K. T., Verner, D. A., et al. 1998, PASP, 110, 761
- Ferland & Osterbrock (1986) Ferland, G. J., & Osterbrock, D. E. 1986, ApJ, 300, 658
- Fitzpatrick & Massa (1990) Fitzpatrick, E. L., & Massa, D. 1990, ApJS, 72, 163
- Fitzpatrick (1999) Fitzpatrick, E. L. 1999, PASP, 111, 63
- Gaskell (1982) Gaskell, C. M. 1982, ApJ, 263, 79
- Gibson et al. (2010) Gibson, R. R., Brandt, W. N., Gallagher, S. C., Hewett, P. C., & Schneider, D. P. 2010, ApJ, 713, 220
- Gordon et al. (2003) Gordon, K. D., Clayton, G. C., Misselt, K. A., Londolt, A. U., & Wolff, M. J. 2003, ApJ, 594, 279
- Glikman et al. (2006) Glikman, E., Helfand, D. J., & White, R. L. 2006, ApJ, 640, 579
- Granato et al. (2004) Granato, G. L., De Zotti, G., Silva, L., Bressan, A., & Danese, L. 2004, ApJ, 600, 580
- Greene & Ho (2005) Greene, J. E., & Ho, L. C. 2005, ApJ, 630, 122
- Hall et al. (2002) Hall, P. B., Anderson, S. F., Strauss, M. A., et al. 2002, ApJS, 141, 267
- Hall (2007) Hall, P. B. 2007, AJ, 133, 1271
- Hamann et al. (1993) Hamann, F., Korista, K. T., & Morris, S. L. 1993, ApJ, 415, 541
- Hayes et al. (2010) Hayes, M., Östlin, G., Schaerer, D., et al. 2010, Nature, 464, 562
- Ho & Kim (2015) Ho, L. C., & Kim, M. 2015, ApJ, 809, 123
- Hopkins et al. (2007) Hopkins, P. F., Richards, G. T., & Hernquist, L. 2007, ApJ, 654, 731
- Hopkins et al. (2008) Hopkins, P. F., Hernquist, L., Cox, T. J., & Kereš, D. 2008, ApJS, 175, 356-389
- Hopkins & Elvis (2010) Hopkins, P. F., & Elvis, M. 2010, MNRAS, 401, 7
- Komossa et al. (2008) Komossa, S., Xu, D., Zhou, H., Storchi-Bergmann, T., & Binette, L. 2008, ApJ, 680, 926-938
- Ji et al. (2012) Ji, T., Wang, T.-G., Zhou, H.-Y., & Wang, H.-Y. 2012, Research in Astronomy and Astrophysics, 12, 369
- Ji et al. (2013) Ji, T., Zhou, H.-Y., Wang, T.-G., & Wang, H.-y. 2013, Chinese Astron. Astrophys., 37, 17
- Ji et al. (2015) Ji, T., Zhou, H., Jiang, P., et al. 2015, ApJ, 800, 56
- Kennicutt (1998) Kennicutt, R. C., Jr. 1998, ARA&A, 36, 189
- Kishimoto et al. (2011) Kishimoto, M., Hönig, S. F., Antonucci, R., et al. 2011, A&A, 536, A78
- Jiang et al. (2011) Jiang, P., Ge, J., Zhou, H., Wang, J., & Wang, T. 2011, ApJ, 732, 110
- Lawrence et al. (2007) Lawrence, A., Warren, S. J., Almaini, O., et al. 2007, MNRAS, 379, 1599
- Leighly & Moore (2004) Leighly, K. M., & Moore, J. R. 2004a, ApJ, 611, 107
- Leighly (2004) Leighly, K. M. 2004b, ApJ, 611, 125
- Leighly et al. (2015) Leighly, K. M., Cooper, E., Grupe, D., Terndrup, D. M., & Komossa, S. 2015, ApJ, 809, L13
- Li et al. (2015) Li, Z., Zhou, H., Hao, L., et al. 2015, ApJ, 812, 99
- Liu et al. (2015) Liu, W.-J., Zhou, H., Ji, T., et al. 2015, ApJS, 217, 11
- Liu et al. (2016) Liu, W.-J., Zhou, H.-Y., Jiang, N., et al. 2016, ApJ, 822, 64
- Maddox et al. (2008) Maddox, N., Hewett, P. C., Warren, S. J., & Croom, S. M. 2008, MNRAS, 386, 1605
- Marziani et al. (1996) Marziani, P., Sulentic, J. W., Dultzin-Hacyan, D., Calvani, M., & Moles, M. 1996, ApJS, 104, 37
- Marziani et al. (2013) Marziani, P., Sulentic, J. W., Plauchu-Frayn, I., & del Olmo, A. 2013, ApJ, 764, 150
- Nakajima et al. (2012) Nakajima, K., Ouchi, M., Shimasaku, K., et al. 2012, ApJ, 745, 12
- Nemmen & Brotherton (2010) Nemmen, R. S., & Brotherton, M. S. 2010, MNRAS, 408, 1598
- Ogle et al. (1999) Ogle, P. M., Cohen, M. H., Miller, J. S., et al. 1999, ApJS, 125, 1
- Palanque-Delabrouille et al. (2016) Palanque-Delabrouille, N., Magneville, C., Yèche, C., et al. 2016, A&A, 587, A41
- Peng et al. (2002) Peng, C. Y., Ho, L. C., Impey, C. D., & Rix, H.-W. 2002, AJ, 124, 266
- Peng et al. (2010) Peng, C. Y., Ho, L. C., Impey, C. D., & Rix, H.-W. 2010, AJ, 139, 2097
- Reichard et al. (2003) Reichard, T. A., Richards, G. T., Hall, P. B., et al. 2003, AJ, 126, 2594
- Richards et al. (2002) Richards, G. T., Vanden Berk, D. E., Reichard, T. A., et al. 2002, AJ, 124, 1
- Ross et al. (2013) Ross, N. P., McGreer, I. D., White, M., et al. 2013, ApJ, 773, 14
- Ross et al. (2015) Ross, N. P., Hamann, F., Zakamska, N. L., et al. 2015, MNRAS, 453, 3932
- Runnoe et al. (2012) Runnoe, J. C., Brotherton, M. S., & Shang, Z. 2012, MNRAS, 422, 478
- Scannapieco & Oh (2004) Scannapieco, E., & Oh, S. P. 2004, ApJ, 608, 62
- Scarpa & Falomo (1997) Scarpa, R., & Falomo, R. 1997, A&A, 325, 109
- Schmidt et al. (1992) Schmidt, G. D., Stockman, H. S., & Smith, P. S. 1992, ApJ, 398, L57
- Shi et al. (2016) Shi, X., Zhou, H., Shu, X., et al. 2016, ApJ, 819, 99
- Smee et al. (2013) Smee, S. A., Gunn, J. E., Uomoto, A., et al. 2013, AJ, 146, 32
- Snedden & Gaskell (2007) Snedden, S. A., & Gaskell, C. M. 2007, ApJ, 669, 126
- Straatman et al. (2015) Straatman, C. M. S., Labbé, I., Spitler, L. R., et al. 2015, ApJ, 808, L29
- Szomoru et al. (2012) Szomoru, D., Franx, M., & van Dokkum, P. G. 2012, ApJ, 749, 121
- Trump et al. (2006) Trump, J. R., Hall, P. B., Reichard, T. A., et al. 2006, ApJS, 165, 1
- Vacca et al. (2003) Vacca, W. D., Cushing, M. C., & Rayner, J. T. 2003, PASP, 115, 389
- Vanden Berk et al. (2001) Vanden Berk, D. E., Richards, G. T., Bauer, A., et al. 2001, AJ, 122, 549
- Véron-Cetty et al. (2004) Véron-Cetty, M.-P., Joly, M., & Véron, P. 2004, A&A, 417, 515
- Wang et al. (2007) Wang, H.-Y., Wang, T.-G., & Wang, J.-X. 2007, ApJS, 168, 195
- Wang et al. (2011) Wang, H., Wang, T., Zhou, H., et al. 2011, ApJ, 738, 85
- Wang et al. (2013) Wang, H., Xing, F., Zhang, K., et al. 2013, ApJ, 776, L15
- Wilkes (1984) Wilkes, B. J. 1984, MNRAS, 207, 73
- Williams et al. (2016) Williams, R. J., Maiolino, R., Krongold, Y., et al. 2016, arXiv:1605.08046
- Wilson et al. (2004) Wilson, J. C., Henderson, C. P., Herter, T. L., et al. 2004, Proc. SPIE, 5492, 1295
- Wright et al. (2010) Wright, E. L., Eisenhardt, P. R. M., Mainzer, A. K., et al. 2010, AJ, 140, 1868
- York et al. (2000) York, D. G., Adelman, J., Anderson, J. E., Jr., et al. 2000, AJ, 120, 1579
- Zamanov et al. (2002) Zamanov, R., Marziani, P., Sulentic, J. W., et al. 2002, ApJ, 576, L9
- Zakamska et al. (2016) Zakamska, N. L., Hamann, F., Pâris, I., et al. 2016, MNRAS, 459, 3144
- Zhang et al. (2011) Zhang, K., Dong, X.-B., Wang, T.-G., & Gaskell, C. M. 2011, ApJ, 737, 71
- Zhang et al. (2010) Zhang, S., Wang, T.-G., Wang, H., et al. 2010, ApJ, 714, 367
- Zhang et al. (2014) Zhang, S., Wang, H., Wang, T., et al. 2014, ApJ, 786, 42
- Zhang et al. (2015) Zhang, S., Ge, J., Jiang, P., et al. 2015a, ApJ, 802, 92
- Zhang et al. (2015) Zhang, S., Zhou, H., Wang, T., et al. 2015b, ApJ, 803, 58
- Zhang et al. (2015) Zhang, S., Zhou, H., Shi, X., et al. 2015c, ApJ, 815, 113
- Zheng et al. (2012) Zheng, Z.-Y., Malhotra, S., Wang, J.-X., et al. 2012, ApJ, 746, 28
| Band | Magnitude | Date of Observation | Facility | Reference |
|---|---|---|---|---|
| u | 2008 Nov. 02 | SDSS | 1 | |
| g | 2008 Nov. 02 | SDSS | 1 | |
| r | 2008 Nov. 02 | SDSS | 1 | |
| i | 2008 Nov. 02 | SDSS | 1 | |
| z | 2008 Nov. 02 | SDSS | 1 | |
| 2010 July 26 | UKIDSS | 2 | ||
| 2010 July 26 | UKIDSS | 2 | ||
| 2010 July 26 | UKIDSS | 2 | ||
| 2010 July 26 | UKIDSS | 2 | ||
| 2010 June 28 | WISE | 3 | ||
| 2010 June 28 | WISE | 3 | ||
| 2010 June 28 | WISE | 3 | ||
| 2010 June 28 | WISE | 3 |
| SDSS J0006+1215 | Vanden Berk et al. composite | ||||||
|---|---|---|---|---|---|---|---|
| Ions | Velocity | FWHM | Flux | Note | Rel. Flux | ||
| Å | (km s-1) | (km s-1) | ( erg s-1 cm-2) | (100) | |||
| Ly | 1215.67 | 0 | 42930 | 20.811.91 | narrow | ||
| Ly | 1215.67 | -2119 | 4821 | 105.5512.20 | outflow | 100.00 | |
| N V | 1240.14 | -2119 | 4821 | 96.9411.40 | outflow | 2.46 | |
| Si IV+O IV] | 1396.76 | -2119 | 4821 | 13.004.32 | outflow | 8.13 | |
| C IV | 1549.06 | -2119179 | 4821486 | 54.076.31 | outflow | 25.29 | |
| C III] | 1908.73 | -2119 | 4821 | 9.71 | outflow, upper limit | 21.19 | |
| H | 4862.68 | 89.50 | total | 8.65 | |||
| - | 0 | 6927 | 69.0715.04 | broad | |||
| - | -2119 | 4821 | 20.434.15 | outflow | |||
| O III | 4960.30 | -2119 | 4821 | 15.01 | outflow | 0.69 | |
| O III | 5008.24 | -2119 | 4821 | 45.049.03 | outflow | 2.49 | |
| H | 6564.61 | 557.45 | total | 30.83 | |||
| - | 0 | 6927231 | 494.06114.76 | broad | |||
| - | -2119 | 4821 | 63.3916.34 | outflow | |||