Using photo-ionisation models to derive carbon and oxygen gas-phase abundances in the rest UV
Abstract
We present a new method to derive oxygen and carbon abundances using the ultraviolet (UV) lines emitted by the gas-phase ionised by massive stars. The method is based on the comparison of the nebular emission-line ratios with those predicted by a large grid of photo-ionisation models. Given the large dispersion in the O/H - C/O plane, our method firstly fixes C/O using ratios of appropriate emission lines and, in a second step, calculates O/H and the ionisation parameter from carbon lines in the UV. We find abundances totally consistent with those provided by the direct method when we apply this method to a sample of objects with an empirical determination of the electron temperature using optical emission lines. The proposed methodology appears as a powerful tool for systematic studies of nebular abundances in star-forming galaxies at high redshift.
keywords:
methods: data analysis – ISM: abundances – galaxies: abundances1 Introduction
Establishing the gas-phase abundances of carbon, nitrogen and oxygen in galaxies through cosmic time is key to understand not only their chemical enrichment, but also how galaxies assemble and evolve (Edmunds & Pagel, 1978; Garnett et al., 1995; Henry et al., 2000; Chiappini, Romano, & Matteucci, 2003).
In the last decade or so, large deep optical spectroscopic surveys using ground-based 8-10m-class telescopes (e.g. Steidel et al., 2003; Shapley et al., 2003; Lilly et al., 2007; Kurk et al., 2013; Le Fèvre et al., 2015) led to a significant increase in the amount and depth of rest-frame UV spectra of high redshift galaxies ( 1-2). These and other follow-up spectroscopy of galaxies in deep fields (e.g. Erb et al., 2010; Karman et al., 2015; Contini et al., 2016), in particular gravitationally lensed systems (e.g. Christensen et al., 2012; James et al., 2014; Stark et al., 2014; Vanzella et al., 2016a), are pushing now UV studies towards the low-luminosity (mass) regime out to redshift 3.5 (e.g. Patrício et al., 2016; Vanzella et al., 2016b, 2017; Amorín et al., 2017) and beyond (Stark et al., 2017, and references therein).
Overall, the above studies consistently find that the UV spectrum of high redshift galaxies is systematically bluer and harder than in most local galaxies. Thus, it includes a number of high ionisation, metal emission lines with relative large equivalent widths, such as those of carbon (e.g. C iii] 1908 Å, C iv1549 Å) and oxygen (O iii] 1664 Å), which are often related to the presence of high equivalent width emission of He ii 1640 Å and Ly. While these spectral features could be quite common at very high redshifts (Stark et al., 2017), they provide tight constraints to the ionisation, age, and metallicity properties of galaxies, as recently shown by emission-line diagnostics based on detailed photo-ionisation models (e.g. Feltre, Charlot, & Gutkin, 2016; Gutkin, Charlot, & Bruzual, 2016; Jaskot & Ravindranath, 2016).
The wealth of information contained in the UV spectra of strong emission -line galaxies allow us to explore new techniques for an accurate characterisation of the nebular chemical content of star forming galaxies based on the analysis of the carbon abundance, the processes governing the C/O ratio, and its relation with the total metallicity (e.g. Henry et al., 2000; Erb et al., 2010; Berg et al., 2016). The use of photo-ionisation models assuming different combinations of C/O and O/H in an emitting ionised gas distribution is hence an alternative to estimate the gas-phase metallicity in those cases where very few UV emission lines can be measured. These methodologies, entirely or partially based on the available UV emission line ratios, are necessary to complement the widely used recipes to derive physical properties and chemical abundances from rest-frame optical spectra, which at 2-3 rely on the (usually challenging) detection of faint emission lines in the near infra-red (NIR, e.g. Steidel et al., 2014; Maseda et al., 2014; Troncoso et al., 2014; Amorín et al., 2014; Shapley et al., 2015; Onodera et al., 2016; Sanders et al., 2016; Trainor et al., 2016). They would also be of great interest for metallicity studies of galaxies at the highest redshifts, where observing the optical rest-frame is extremely challenging. In particular, the future arrival of unprecedentedly deep observations using the James Webb Space Telescope (JWST) and the new generation of 30m-class telescopes, will increase by a huge factor current galaxy samples at 3, extending detailed UV spectroscopic studies towards the cosmic dawn.
For this aim, in this paper we present an adapted version of the code Hii-Chi-mistry (Pérez-Montero 2014, hereinafter HCm), originally designed to derive O/H and N/O from optical emission lines, that deals with UV emission lines to derive O/H and C/O ratios. This new semi-empirical method is fully consistent with direct estimations based on the electron temperature of star forming regions and provide a potentially powerful tool to constrain the metallicity of galaxies out to very high redshifts. Even considering the inherent limitations affecting all methods for estimating chemical abundances in galaxies from their integrated spectra, such as, e.g. the fact that these are based on spatially unresolved data (e.g. Iglesias-Páramo et al. 2016) and rely on the simplistic assumption of a single H ii region for the analysis of the observed emission lines, it is still possible to find characteristic abundance ratios (i.e. O/H, N/O, Pérez-Montero et al. 2016) that correlate with the integrated properties of galaxies, such as stellar mass, thus providing useful constraints for their assembly histories and chemical evolution.
Our paper is organized as follows; In Section 2 we describe the sample of objects with available emission lines both in the optical and in the UV whose O and C abundances could be derived using the direct method. In Section 3 we describe the models and the method used to derive the abundances and we compare our results with the direct abundances. Finally, in Section 4 we present our results and in Section 5 we summaries our conclusions.
Throughout this paper the following convention is adopted: O/H is 12+log(O/H), C/O is log(C/O), O iii] 1664Å represents the total flux of 1661 and 1666Å, C iii] 1908Å represents the total flux of lines at 1907 and 1909Å, and C iv 1549Å represents the total flux of lines at 1548 and 1551Å.
2 Calibration sample and abundances
We compiled from the literature a sample of H ii regions and starburst galaxies at different with optical and UV lines emitted by the gas ionised by episodes of massive star formation. Owing to the scarce number of objects with simultaneous measurement of optical and UV lines, our sample consists on a combination of integrated spectra observed using a variety of instruments and techniques. Our sample was selected in such a way that the O/H and C/O abundance ratios could be derived using the direct method from the estimation of the [O iii] electron temperature, ([O iii]). This was obtained from the ratio between [O iii] 5007 and 4363Å and, in some cases, from the ratio between [O iii] 5007 and 1664Å. Our calibration sample includes objects without observed fluxes in the [O ii] 3727 Å line. For these objects the the total oxygen abundance was derived by applying an empirical calibration between O/H and ([O iii]) (see below). For C/O determinations using the direct method, we compiled objects with measurements of at least O iii] 1664 Å and C iii] 1909 Å, and also C iv1549 Å in very high-excitation objects. All the compiled fluxes were reddening corrected using a Cardelli et al. (1989) extinction law based on the extinction coefficients given in these references. The list of references and the number of objects are listed in Table 1.
| Reference | Number of objects | Type |
|---|---|---|
| de Barros et al. (2016) | 1 | LBG |
| Bayliss et al. (2014) | 1 | LBG |
| Berg et al. (2016) | 7 | LSB |
| Christensen et al. (2012) | 3 | LBG |
| Erb et al. (2010) | 1 | LBG |
| Garnett et al. (1995) | 6 | LSB |
| Garnett et al. (1997) | 2 | LSB |
| Garnett et al. (1999) | 6 | H ii |
| Izotov et al. (1999) | 3 | LSB |
| James et al. (2014) | 1 | LBG |
| Kurt et al. (1995) | 2 | H ii |
| Kobulnicky et al. (1997) | 3 | LSB |
| Kobulnicky & Skillman (1998) | 3 | LSB |
| Steidel et al. (2016) | 1 (stack) | LBG |
| Thuan et al. (1999) | 1 | LSB |
| Vanzella et al. (2016a) | 1 | LBG |
| Villar-Martín et al. (2004) | 1 | LBG |
We recalculated the physical properties and the chemical abundances of the selected objects using expressions based on the pyneb software (Luridiana, Morisset, & Shaw, 2015). The O/H abundances were calculated using the derived electron temperatures and the bright optical emission lines [O ii] 3727 Å and [O iii] 4959,5007 Å and the expressions given in Pérez-Montero (2014). In those cases where the flux of the [O ii] 3727 Å line were not available to calculate the O+ abundances, we resorted to the empirical relation between O/H and ([O iii]) given by Amorín et al. (2015), which is valid for a wide range of metallicity and ionisation values.
Using the pyneb code, we also defined expressions for the temperature and carbon abundances using UV emission lines. Computing the emission line ratio:
| (1) |
we derive the [O iii] electron temperature using the same set of atomic parameters as in Pérez-Montero (2014):
| (2) |
valid in the range ([O iii]) = 0.8 to 2.5 in units of 104 K and that is nearly independent on electron density (i.e. a change from 10 to 1000 cm-3 implies a change in of less than 0.1%). Nevertheless, due to the very long wavelength baseline between the involved emission lines and the large extinction correction in the UV, the used ratio has a large uncertainty if the extinction correction is big. For instance assuming an extinction of 1 mag at 1664 Å implies an electron temperature of about 10% larger using a Calzetti et al. (2000) than a Cardelli et al. (1989) extinction law.
The carbon ionic ratios based on UV lines were derived using the following expressions and assuming the derived [O iii]:
| (3) |
| (4) |
and using the collisional coefficients of Berrington et al. (1985) and Aggarwald & Keenan (2004) for C2+ and C3+, respectively.
The total C/O was then derived under the assumption that:
| (5) |
that can be simplified to C/O = C2+/O2+ when no C iv emission is detected.
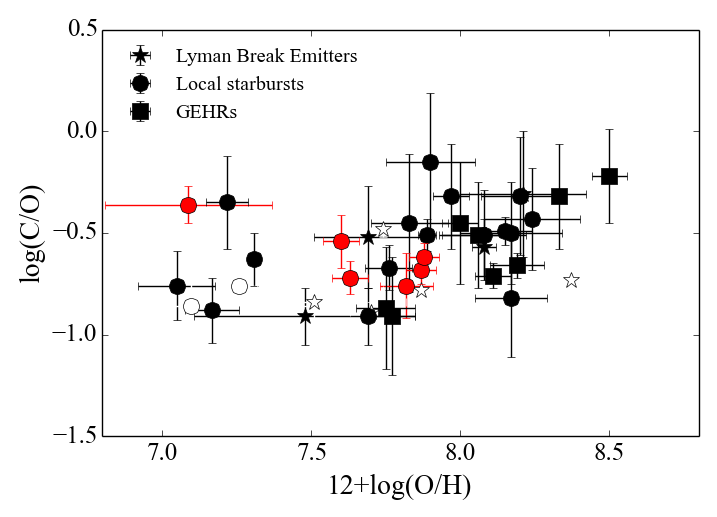
In Fig.1 we plot the relation between total O/H and C/O for our calibration sample. The objects are identified according to their nature and the method used to derive O/H and C/O. We distinguish between objects with temperatures obtained from the [O iii] ratio 5007/4363 (30), objects whose O/H was calculated using the empirical relation between O/H and ([O iii]) given in Amorín et al. (2015) (6), and objects whose O/H and C/O were calculated using the electron temperature from the [O iii] 5007/1664 ratio (8). For the latter, typical errors in O/H are 0.18 dex, while in the two first cases they are slightly lower, 0.10 dex.
On average, C/O tend to increase with metallicity, as carbon is essentially a secondary element (i.e. its relative production is higher for higher O/H) mainly ejected into the ISM by massive stars (e.g. Henry et al. 2000). This trend starts to be observed in our sample from 12+log(O/H) 7.4. However, the dispersion of this relation, of about 0.25 dex, is larger than the average C/O errors ( 0.15 dex), owing to the different physical processes affecting metallicity and the ratio between a primary element as O and a secondary one as C. This is the case of hydrodynamical processes, including metal-enriched outflows or inflows of metal-poor gas, which can change metallicity and keep relatively unaffected C/O (e.g. Edmunds 1990). Other factors that could also modify this ratio are, for instance, different star-formation efficiencies or the presence of a non-standard IMF (e.g. Gavilán et al. 2005; Mattsson 2010) Therefore, as no clear trend can be taken between O/H and C/O, C/O has to be previously calculated to allow the derivation of O/H abundances using carbon lines. This is similar to the situation in the optical, when N/O must be determined before deriving O/H using [N ii] emission lines (Pérez-Montero & Contini, 2009; Amorín et al., 2010).
3 Model and method description
Both O/H, C/O and the ionisation parameter (log) were derived using a semi-empirical approach based on the comparison between the most representative extinction corrected emission lines observed in the UV (Ly 1216Å, C iv 1549Å, O iii] 1664Å, and C iii] 1908Å) and in the optical (H 4861Å and [O iii] 5007Å) with a large grid of photo-ionisation models covering a wide range of values in O/H, C/O, and log.
The photo-ionisation models were calculated using the code Cloudy v.13.01 (Ferland et al., 2013). In all models we adopted a spherical geometry of constant density gas (100 cm-3), filling factor of 10-1, and a standard gas-to-dust mass ratio around an ionising point-source with the spectral energy distribution of a 1 Myr old cluster using popstar (Mollá et al., 2009) model atmospheres at the metallicity of the gas. The calculation was stopped in each model and the lines were thus retrieved when the electron density fraction was lower than 10%.
Although several authors have pointed out the importance of the assumed SED in the models for the determination of abundances (e.g. Kewley et al. 2005; Morisset et al. 2016), as our approach is semi-empirical it is possible to assess any systematic effect and the uncertainty associated to the assumption of an ionizing stellar cluster of a single age in our models.
The grid covers input oxygen abundances in the range [7.1,9.1] in bins of 0.1 dex, log in the range [-4.0,-1.5] in bins of 0.25 dex and assumes solar proportions for the rest of elements, with the exception of carbon, that takes values in the range of C/O = [-1.4,0.6] in bins of 0.125 dex, and nitrogen, for which we assume a secondary origin and a constant solar ratio log(C/N) 0.6 (Asplund et al., 2009). The assumption of a constant C/N ratio is justified by the expected similar behavior between primary and secondary elements under hydrodynamical effects (e.g. Edmunds 1990) and supported by recent observations of galaxies at low (Berg et al., 2016) and high redshifts (Steidel et al., 2016), which show a constant trend in C/N with metallicity. Under the above conditions, the grid consists on a total of 3,927 models that can be obtained from the 3MDB database (Morisset et al., 2015) 1113MdB project and the models can be found in https://sites.google.com/site/mexicanmillionmodels/.
A Python-based routine called Hii-Chi-mistry-UV 222The routine HCm-UV is publicly available at http://www.iaa.es/epm/HII-CHI-mistry-UV.html. (hereafter HCm-UV was developed in order to calculate O/H, C/O and log comparing the observed relative UV and optical emission lines with the predictions from the models. The methodology is the same as that described for the optical in Pérez-Montero (2014). In a first step, the code calculates C/O in order to constrain the space of models in which O/H abundances can be calculated using UV carbon emission lines.
The C/O abundance ratio is derived as the average of the -weighted distribution of the C/O values in the models. The values are calculated as the relative quadratic differences between observed and model-predicted emission-line ratios sensitive to C/O. The ratio RO3 is used when O iii] 1664 and 5007 Å are observed. In all cases, we also use the parameter, defined as:
| (6) |
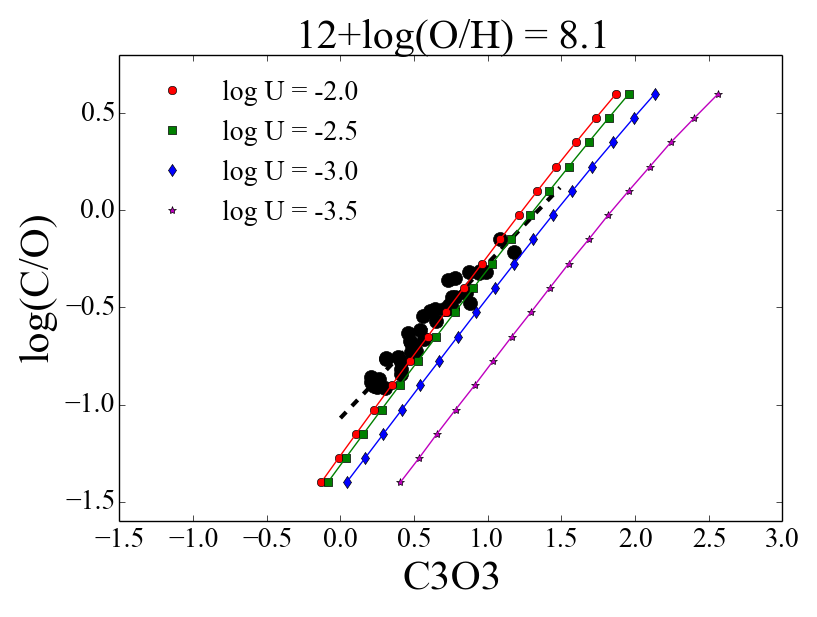
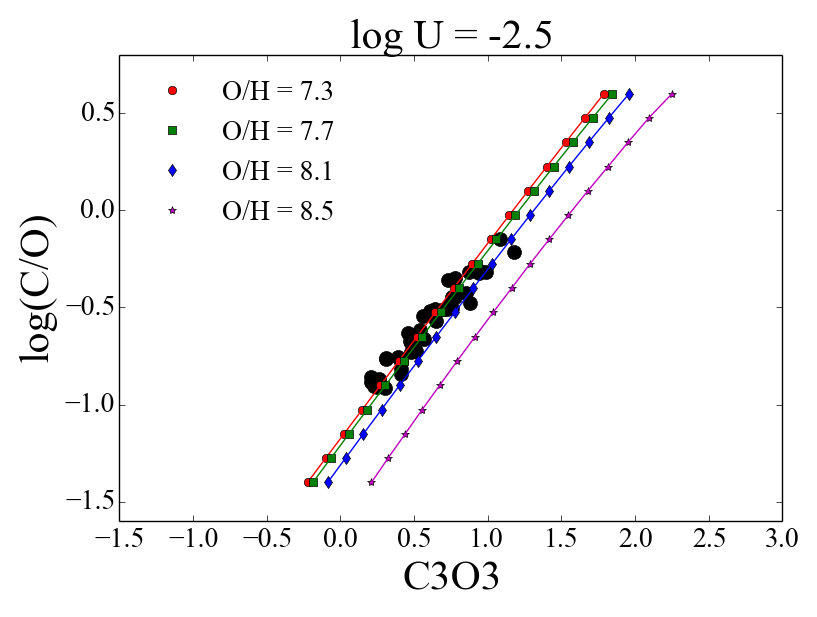
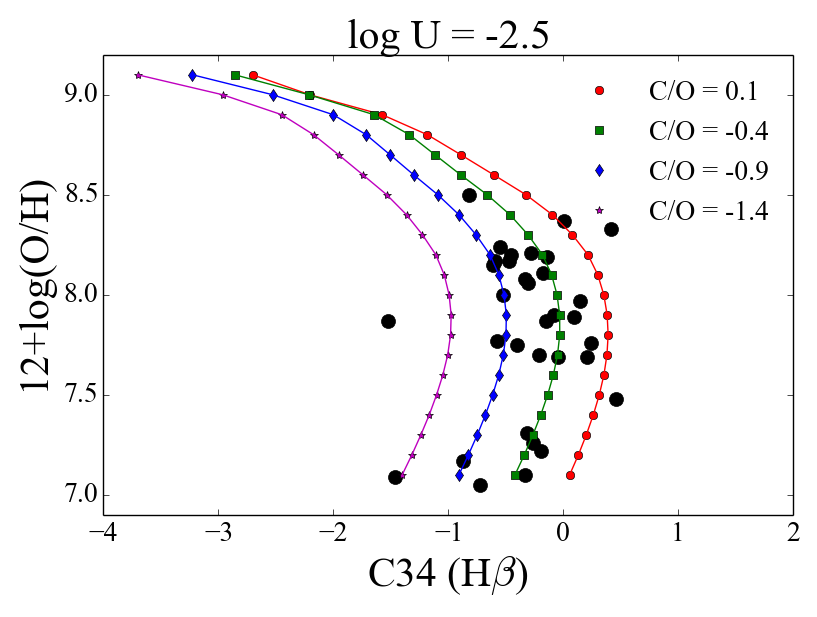
which can be also defined in absence of the C iv line as the ratio of the C iii] and [O iii] lines. As shown in Fig.2, according to models has little dependence on O/H, while the dependence on log is only significant for very low-excitation. Figure 2 also shows the calibration sample, which follow a linear trend that can be used to derive C/O empirically:
| (7) |
with a dispersion of 0.20 dex, calculated as the standard deviation of the residuals.
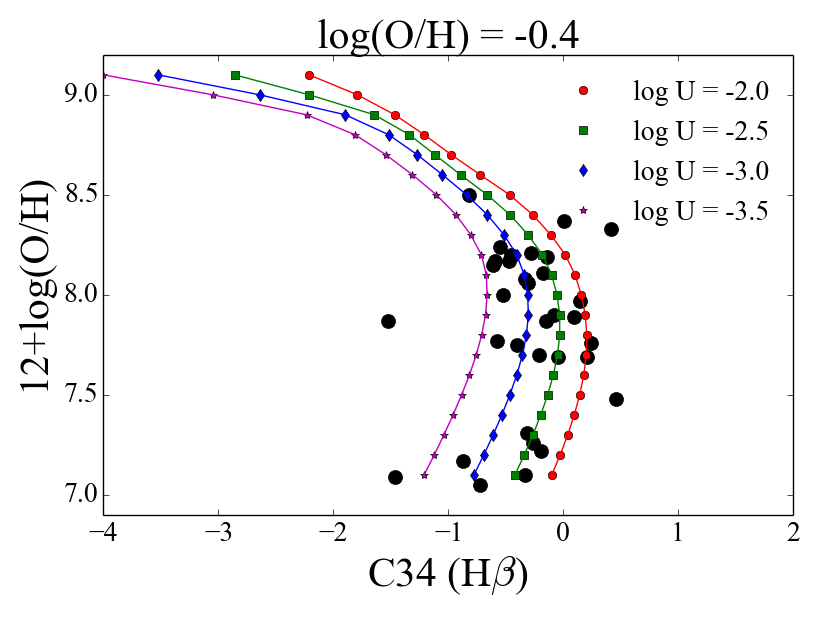
Once C/O is fixed in the grid of models, both O/H and log are calculated as the mean of the model input values in the -weighted distribution, where again the values for each model are derived from the quadratic relative differences between the observed and predicted emission-line ratios sensitive to O/H and log U. Also in this case, RO3 is used when O iii] 1664 and [O iii] 5007 are observed. Similarly to the case of C/O, the values for are added in quadrature to other emission-line ratios from the UV, such as the parameter, defined as:
| (8) |
where I(Hi) is the intensity of a Hydrogen recombination line. When optical emission lines are available, the HI line is H 4861 Å. As in the case of , can be defined in the absence of C iv lines using only C iii] lines. As shown in Fig.2, this ratio has a very similar dependence with O/H as the R23 parameter (i.e. [O ii]+[O iii] relative to H, Pagel et al. 1979) as it is double-valued (i.e. it increases with O/H for low O/H and it decreases for high O/H). Besides, it presents additional dependence on log and C/O that contribute to enlarge the dispersion. The dependence on C/O is limited in our method because C/O is constrained in the first iteration of our calculations. As shown in Fig. 2, the parameter also presents a large dependence on log U. The latter is obtained in this iteration as the average value of the resulting distribution. The dependence on log is alleviated using an additional parameter in the total that depends on the index, defined as the ratio between the C iii] and C iv lines:
| (9) |
4 Results and discussion
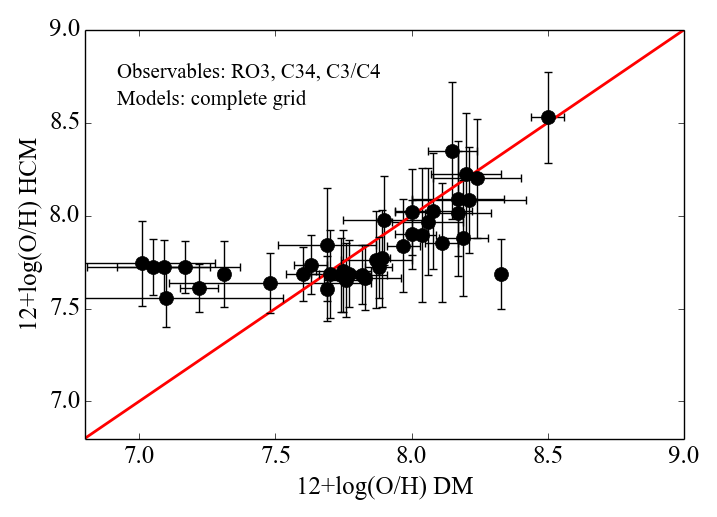
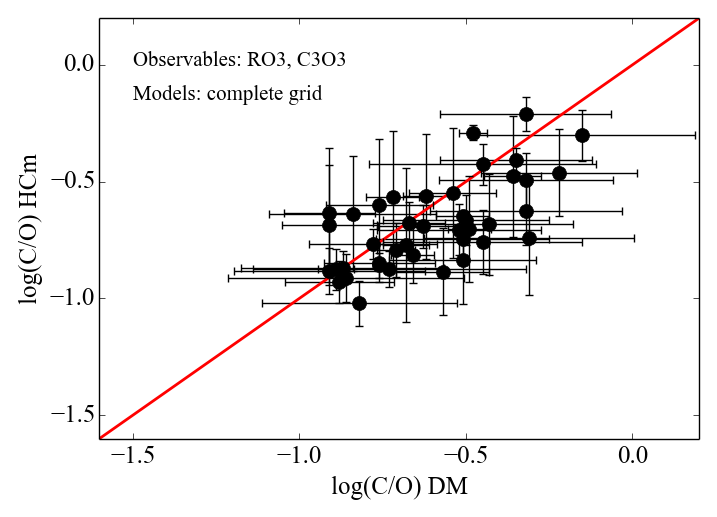
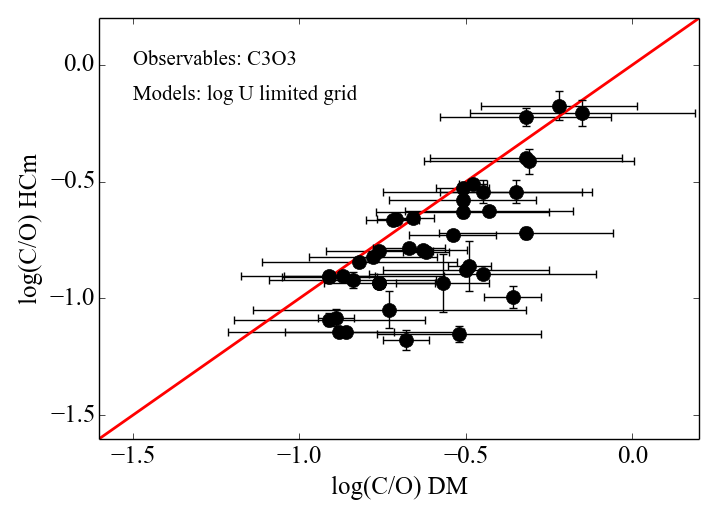
In Figure 3 we show the comparison between the chemical abundances derived from both the direct method and from HCm-UV. In the two upper panels, the latter uses all the available optical (H and [O iii] 5007) and UV (C iv, C iii], O iii]) emission lines. Overall, we find a good agreement between these two datasets, both for C/O and O/H 7.5, with an mean offset that is lower than the uncertainty of the direct method (i.e. 0.10 dex) both for O/H and C/O. The overall standard deviation of the residuals is 0.15 dex for O/H and 0.16 dex for C/O.
Interestingly, using HCm-UV it could be possible to obtain abundances from UV lines adding only follow-up observations of the blue part of the rest-frame optical spectrum corresponding to [O iii] 5007 Å and H, without any low excitation emission line such as O ii] 3727 Å. Though for very low values of O/H ( 7.5) the abundances derived by HCm-UV do not follow any correlation with those from the direct method, the code essentially identifies all of these objects as extremely metal-poor galaxies.
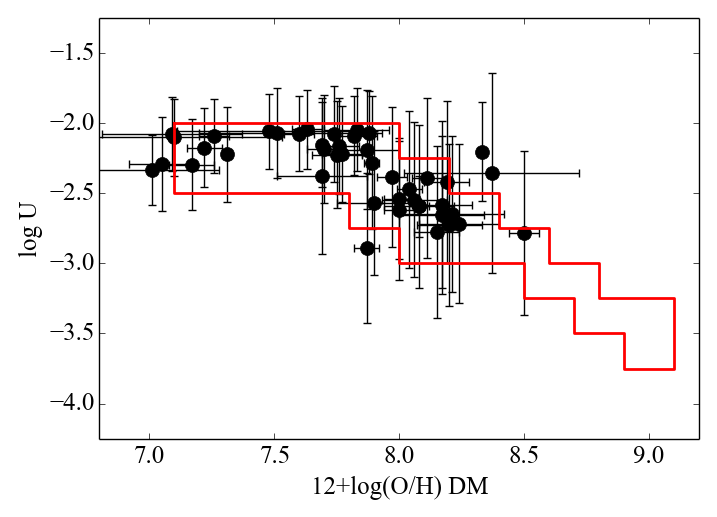
When the ratio –used to derive ([O iii]) in the direct method– cannot be derived due to the absence of optical lines, the code follows the same strategy as in Pérez-Montero (2014): it constrains the grid of models by assuming an empirical law between O/H and log in such a way that metal-poor objects have higher log and metal-rich objects have lower log. This empirical relation was already observed by Dopita & Evans (1986) and could be related with an evolutionary sequence. Since our sample small compared with the sample studied in Pérez-Montero (2014) we adopt the same constrain for our grid. In Fig. 4 we show the comparison between the empirical O/H - log U relation empirically derived for Sánchez Almeida et al. (2016) and Pérez-Montero et al. (2016) and the values derived for our sample using all lines. As can be seen the trend is well followed by the points,
By using this constrained grid, the code calculates C/O using only the ratio and the same procedure as described above and then derives O/H and log using the and parameters, but taking Ly as the hydrogen recombination line. This approach, however, should be used with caution. The Ly line is resonant and photons scatter in the neutral Hydrogen, thus having a complex radiation transfer. Especially for faint Ly emission (i.e. low equivalent width) this may produce an additional source of systematic uncertainty.
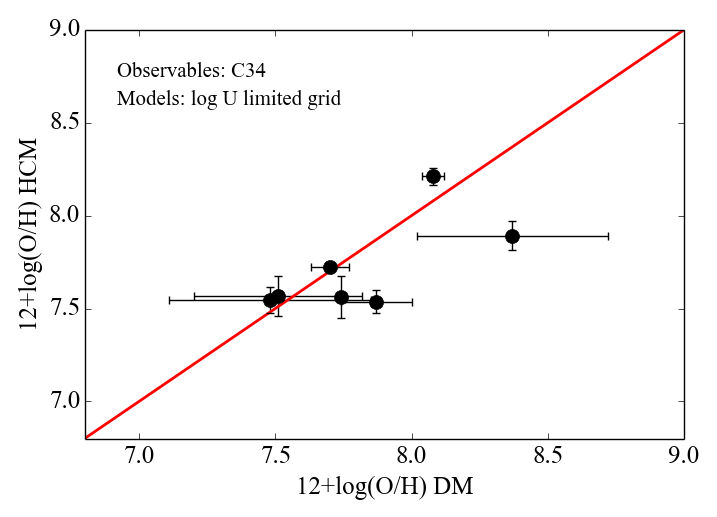
In the two lower panels of Fig. 3 we show the comparison between the abundances derived from the direct method and from HCm-UV in absence of the optical emission lines. The number of points with a reliable measurement of Ly in our sample is very low, but all the objects are identified as metal-poor in this sample. Regarding C/O, as this ratio has a very little dependence on the electron temperature, the agreement is still very good, i.e. the mean offset is lower than the uncertainty of the direct method and the standard deviation of the residuals is 0.20 dex, fairly similar to that obtained using optical lines.
This result underlines the importance of the C/O abundance ratio as an indicator of the chemical content of galaxies at different epochs. Apart from the reliability of the results only using O iii] and C iii] UV emission lines, C/O is not affected by hydrodynamical processes, such as inflows or outflows, and can be more tightly related with other integrated properties of galaxies such as stellar mass, as in the case of N/O (Amorín et al., 2010; Pérez-Montero et al., 2013, 2016).
When no previous determination of C/O can be made (i.e. the C3O3 ratio cannot be measured), we follow again the procedure described in Pérez-Montero (2014) for the case of N/O: the code adopts a new constrain for the space of models assuming a given empirical relation between O/H and C/O to calculate O/H using the C34 parameter. The code then uses the relation between O/H and N/O shown in Fig. 3 of Pérez-Montero (2014) and assumes the C/N solar ratio for all the sample.
5 Conclusion
In this work we present a semi-empirical method to derive oxygen (O/H) and carbon abundances (C/O) from rest-frame UV emission lines, which are consistent with those obtained using the direct method.
We highlight the potential use of this method for (-consistent) metallicity inferences at high redshifts (), e.g. through deep optical spectroscopy with large ground-based telescopes (Amorín et al., 2017) or using future space telescopes, such as the James Webb Space Telescope. For example, the NIRSpec spectrograph onboard the JWST, will be able to detect the full set of rest UV and optical lines required to use this method for galaxies spanning from 3.5 to 9 in relatively short exposure times. Particularly interesting could be the use of this technique to provide metallicity constraints for primeval galaxies in the epoch of cosmic reionisation (at 6). In these presumably metal-poor objects, rest UV emission lines with relatively high EWs (such as C iii], C iv, and O iii]) are apparently ubiquitous (e.g. Stark et al., 2015; Stark et al., 2017), but the access to faint key optical lines (such as [O iii] 4363 Å and [O ii] 3727 Å in the case of high ionisation objects) will be very limited, thus making -consistent metallicity inferences extremely challenging.
Acknowledgements
We thank the anonymous referee for constructing and helpful comments. EPM acknowledges support from the Spanish MICINN through grants AYA2010-21887-C04-01 and AYA2013-47742-C4-1-P and the Junta de Andalucía for grant EXC/2011 FQM-7058. RA acknowledges the support from the ERC Advanced Grant 695671 “QUENCH” and the FP7 SPACE project “ASTRODEEP” (Ref.No: 312725), supported by the European Commission.
References
- Aggarwald & Keenan (2004) Aggarwald K. M., Keenan F. P., 2004, Phys. Scr., 69, 385
- Amorín et al. (2017) Amorín R., et al., 2017, NatAs, 1, 0052
- Amorín et al. (2015) Amorín R. et al., 2015, A&A, 578, A105
- Amorín et al. (2014) Amorín R., et al., 2014, ApJ, 788, L4
- Amorín et al. (2010) Amorín R. O., Pérez-Montero E., Vílchez J. M., 2010, ApJ, 715, L128
- Asplund et al. (2009) Asplund M., Grevesse N., Sauval A. J., Scott P., 2009, ARA&A, 47, 481
- Bayliss et al. (2014) Bayliss M. B., Rigby J. R., Sharon K., Wuyts E., Florian M., Gladders M. D., Johnson T., Oguri M., 2014, ApJ, 790, 144
- Berg et al. (2016) Berg D. A., Skillman E. D., Henry R. B. C., Erb D. K., Carigi L., 2016, ApJ, 827, 126
- Berrington et al. (1985) Berrington K. A., Burke P. G., Dufton P. L., Kingston A. E., 1985, Atomic Data and Nuclear Data Tables, 33, 195
- Calzetti et al. (2000) Calzetti D., Armus L., Bohlin R. C., Kinney A. L., Koornneef J., Storchi-Bergmann T., 2000, ApJ, 533, 682
- Cardelli et al. (1989) Cardelli J. A., Clayton G. C., Mathis J. S., 1989, ApJ, 345, 245
- Chiappini, Romano, & Matteucci (2003) Chiappini C., Romano D., Matteucci F., 2003, MNRAS, 339, 63
- Christensen et al. (2012) Christensen L. et al., 2012, MNRAS, 427, 1973
- Contini et al. (2016) Contini T., et al., 2016, A&A, 591, A49
- de Barros et al. (2016) de Barros S. et al., 2016, A&A, 585, A51
- Dopita & Evans (1986) Dopita M. A., Evans I. N., 1986, ApJ, 307, 431
- Edmunds (1990) Edmunds M. G., 1990, MNRAS, 246, 678
- Edmunds & Pagel (1978) Edmunds M. G., Pagel B. E. J., 1978, MNRAS, 185, 77P
- Erb et al. (2010) Erb D. K., Pettini M., Shapley A. E., Steidel C. C., Law D. R., Reddy N. A., 2010, ApJ, 719, 1168
- Feltre, Charlot, & Gutkin (2016) Feltre A., Charlot S., Gutkin J., 2016, MNRAS, 456, 3354
- Ferland et al. (2013) Ferland G. J. et al., 2013, RMxAA, 49, 137
- Garnett et al. (1999) Garnett D. R., Shields G. A., Peimbert M., Torres-Peimbert S., Skillman E. D., Dufour R. J., Terlevich E., Terlevich R. J., 1999, ApJ, 513, 168
- Garnett et al. (1995) Garnett D. R., Skillman E. D., Dufour R. J., Peimbert M., Torres-Peimbert S., Terlevich R., Terlevich E., Shields G. A., 1995, ApJ, 443, 64
- Garnett et al. (1997) Garnett D. R., Skillman E. D., Dufour R. J., Shields G. A., 1997, ApJ, 481, 174
- Gavilán et al. (2005) Gavilán M., Buell J. F., Mollá M., 2005, A&A, 432, 861
- Gutkin, Charlot, & Bruzual (2016) Gutkin J., Charlot S., Bruzual G., 2016, MNRAS, 462, 1757
- Henry et al. (2000) Henry R. B. C., Edmunds M. G., Köppen J., 2000, ApJ, 541, 660
- Iglesias-Páramo et al. (2016) Iglesias-Páramo J. et al., 2016, ApJ, 826, 71
- Izotov et al. (1999) Izotov Y. I., Chaffee F. H., Foltz C. B., Green R. F., Guseva N. G., Thuan T. X., 1999, ApJ, 527, 757
- James et al. (2014) James B. L. et al., 2014, MNRAS, 440, 1794
- Jaskot & Ravindranath (2016) Jaskot, A. E., & Ravindranath, S. 2016, ApJ, 833, 136
- Karman et al. (2015) Karman W., et al., 2015, A&A, 574, A11
- Kewley et al. (2005) Kewley L. J., Jansen R. A., Geller M. J., 2005, PASP, 117, 227
- Kobulnicky & Skillman (1998) Kobulnicky H. A., Skillman E. D., 1998, ApJ, 497, 601
- Kobulnicky et al. (1997) Kobulnicky H. A., Skillman E. D., Roy J.-R., Walsh J. R., Rosa M. R., 1997, ApJ, 477, 679
- Kurt et al. (1995) Kurt C. M., Dufour R. J., Garnett D. R., Skillman E. D., Mathis J. S., Peimbert M., Torres-Peimbert S., Walter D. K., 1995, in Revista Mexicana de Astronomia y Astrofisica Conference Series, Vol. 3, Revista Mexicana de Astronomia y Astrofisica Conference Series, Pena M., Kurtz S., eds., p. 223
- Kurk et al. (2013) Kurk J., et al., 2013, A&A, 549, A63
- Le Fèvre et al. (2015) Le Fèvre O. et al., 2015, A&A, 576, A79
- Lilly et al. (2007) Lilly S. J. et al., 2007, ApJS, 172, 70
- Luridiana, Morisset, & Shaw (2015) Luridiana V., Morisset C., Shaw R. A., 2015, A&A, 573, A42
- Maseda et al. (2014) Maseda M. V., et al., 2014, ApJ, 791, 17
- Mattsson (2010) Mattsson L., 2010, A&A, 515, A68
- Mollá et al. (2009) Mollá M., García-Vargas M. L., Bressan A., 2009, MNRAS, 398, 451
- Morisset et al. (2015) Morisset C., Delgado-Inglada G., Flores-Fajardo N., 2015, RMxAA, 51, 103
- Morisset et al. (2016) Morisset C. et al., 2016, A&A, 594, A37
- Onodera et al. (2016) Onodera M., et al., 2016, ApJ, 822, 42
- Pagel et al. (1979) Pagel B. E. J., Edmunds M. G., Blackwell D. E., Chun M. S., Smith G., 1979, MNRAS, 189, 95
- Patrício et al. (2016) Patrício V., et al., 2016, MNRAS, 456, 4191
- Pérez-Montero (2014) Pérez-Montero E., 2014, MNRAS, 441, 2663
- Pérez-Montero & Contini (2009) Pérez-Montero E., Contini T., 2009, MNRAS, 398, 949
- Pérez-Montero et al. (2013) Pérez-Montero E. et al., 2013, A&A, 549, A25
- Pérez-Montero et al. (2016) Pérez-Montero E. et al., 2016, A&A, 595, A62
- Sánchez Almeida et al. (2016) Sánchez Almeida, J., Pérez-Montero, E., Morales-Luis, A. B., et al. 2016, ApJ, 819, 110
- Sanders et al. (2016) Sanders R. L., et al., 2016, ApJ, 825, L23
- Shapley et al. (2015) Shapley A. E., et al., 2015, ApJ, 801, 88
- Shapley et al. (2003) Shapley A. E., Steidel C. C., Pettini M., Adelberger K. L., 2003, ApJ, 588, 65
- Stark et al. (2017) Stark D. P., et al., 2017, MNRAS, 464, 469
- Stark et al. (2015) Stark D. P. et al., 2015, MNRAS, 450, 1846
- Stark et al. (2014) Stark D. P. et al., 2014, MNRAS, 445, 3200
- Steidel et al. (2014) Steidel C. C., et al., 2014, ApJ, 795, 165
- Steidel et al. (2003) Steidel C. C., Adelberger K. L., Shapley A. E., Pettini M., Dickinson M., Giavalisco M., 2003, ApJ, 592, 728
- Steidel et al. (2016) Steidel C. C., Strom A. L., Pettini M., Rudie G. C., Reddy N. A., Trainor R. F., 2016, ApJ, 826, 159
- Thuan et al. (1999) Thuan T. X., Izotov Y. I., Foltz C. B., 1999, ApJ, 525, 105
- Trainor et al. (2016) Trainor R. F., Strom A. L., Steidel C. C., Rudie G. C., 2016, arXiv, arXiv:1608.07280
- Troncoso et al. (2014) Troncoso P., et al., 2014, A&A, 563, A58
- Vanzella et al. (2016a) Vanzella E. et al., 2016, ApJ, 821, L27
- Vanzella et al. (2016b) Vanzella E., et al., 2016b, ApJ, 825, 41
- Vanzella et al. (2017) Vanzella E., et al., 2017, MNRAS, 465, 3803
- Villar-Martín et al. (2004) Villar-Martín M., Cerviño M., González Delgado R. M., 2004, MNRAS, 355, 1132