Detection of methyl isocyanate (CH3NCO) in a solar-type protostar
Abstract
We report the detection of the prebiotic molecule CH3NCO in a solar-type protostar, IRAS16293-2422 B. A significant abundance of this species on the surface of the comet 67P/Churyumov-Gerasimenko has been proposed, and it has recently been detected in hot cores around high-mass protostars. We observed IRAS16293-2422 B with ALMA in the 90 GHz to 265 GHz range, and detected 8 unblended transitions of CH3NCO. From our Local Thermodynamic Equilibrium analysis we derived an excitation temperature of 11019 K and a column density of (4.00.3)1015 cm-2, which results in an abundance of (1.40.1)10-10 with respect to molecular hydrogen. This implies a CH3NCO/HNCO and CH3NCO/NH2CHO column density ratios of 0.08. Our modelling of the chemistry of CH3NCO suggests that both ice surface and gas phase formation reactions of this molecule are needed to explain the observations.
keywords:
instrumentation:interferometers - ISM:abundances - ISM:individual(IRAS16293-2422 B) - line:identification1 Introduction
Understanding the origin of life is one of the main challenges of modern science. It is believed that some basic prebiotic chemistry could have developed in space, likely transferring prebiotic molecules to the solar nebula and later on to Earth. For example, comets exhibit a wide variety of complex organic molecules (or COMs) that are commonly detected in the ISM (see, e.g., Biver et al., 2014). Recently, the spacecraft Rosetta found evidence for the presence of several COMs of prebiotic interest on the surface of the comet 67P/Churyumov-Gerasimenko, using the COSAC mass spectrometer (as e.g. glycoladehyde, CH2OHCHO, or formamide, NH2CHO; Goesmann et al., 2015), and in the coma of the comet using the ROSINA instrument (with the detection of the amino acid glycine, and phosphorous; Altwegg et al., 2015). Among these species, the COSAC mass spectrometer suggested the presence of methyl isocyanate (CH3NCO) with an abundance relatively high compared to other COMs (Goesmann et al., 2015). CH3NCO is the simplest isocyanate, which along NH2CHO contains C, N, and O atoms, and could play a key role in the synthesis of amino acid chains known as peptides (Pascal et al., 2005). CH3NCO was subsequently detected in massive hot molecular cores such as SgrB2 N (Halfen et al., 2015; Belloche et al., 2017) and Orion KL (Cernicharo et al., 2016). However, CH3NCO remained to be reported in solar-type protostars.
IRAS 162932422 (hereafter IRAS16293) is located in the Ophiuchi cloud complex at a distance of 120 pc (Loinard et al., 2008), and it is considered an excellent template for astrochemical studies in low-mass protostars (e.g., Jorgensen et al., 2011, 2016; Lykke et al., 2017). IRAS16293 is composed by sources A and B, separated in the plane of the sky by 5 (600 AU), and whose masses are 0.5 M⊙ (Looney et al., 2000). Their emission exhibits line profiles with linewidths of up to 8 km s-1 for IRAS16293 A and 2 km s-1 for IRAS16293 B. The narrow emission of IRAS16293 B, along with its rich COM chemistry, makes this object the perfect target to search for new COMs.
In this letter we report the detection of CH3NCO towards IRAS 16293-2422 B at frequencies 250 GHz using the Atacama Large Millimeter Array (ALMA). Our results are consistent with those presented by Ligterink et al. (2017) using CH3NCO transitions with frequencies 300 GHz.
2 Observations
The analysis was carried out using the ALMA data from our own project (#2013.1.00352.S), and all other public datasets in Bands 3, 4, and 6 available in the ALMA archive as of January 2017 (#2011.0.00007.SV, #2012.1.00712.S, and #2013.1.00061.S). We note that we have excluded from our analysis other ALMA public datasets in Bands 7 and 8, i) to prevent any dust optical depth problems (the dust continuum emission of IRAS16293 B is known to be very optically thick at frequencies 300 GHz, affecting the line intensities of the molecular emission; see Zapata et al., 2013; Jorgensen et al., 2016); and ii) to limit the level of line confusion, which allows the correct subtraction of the continuum emission by selecting a suitable number of line-free channels in the observed spectra (see e.g. Pineda et al., 2012). All data matching our criteria were downloaded and re-calibrated using standard ALMA calibration scripts and the Common Astronomy Software Applications package111https://casa.nrao.edu. The angular resolution of all datasets was sufficient to resolve source B from source A (with angular resolutions below 1.5), and therefore the emission lines arising from source B are narrow with linewidths <2 km s-1. Continuum subtraction was performed in the uv-plane before imaging using line-free channels.
Our dataset covers a total bandwidth of 6 GHz split in 26 spectral windows spread between 89.5 and 266.5 GHz, with synthesised beam sizes ranging from 0.570.28′′ to 1.421.23′′. The velocity resolution falls between 0.14 and 0.30 km s-1. For the analysis, a spectrum was extracted from each datacube using a circular support with size 1.6′′ centered at the position of IRAS16293 B ( = 16 32 22.61, = -24∘ 28′ 32.44′′). We note that the molecular emission from IRAS16293 B for the species considered in this study (e.g. CH3NCO, NH2CHO and HN13CO), is compact and lies below 1.5 (see Figure 2 below and Coutens et al., 2016). Thus, although the ALMA datasets were obtained with different array configurations and UV coverage, we are confident that our extracted spectra contain all the emission from the hot corino and the analysed lines do not suffer from missing flux.
3 Results
3.1 Detection of CH3NCO
The rotational spectrum of CH3NCO, with the A and E torsional states, has been studied by Koput, J. (1986) (from 8 to 40 GHz), and more recently by Halfen et al. (2015) (from 68 to 105 GHz) and Cernicharo et al. (2016, from 40 to 363 GHz). The identification of the lines was performed using the software MADCUBAIJ222Madrid Data Cube Analysis on ImageJ is a software developed in the Center of Astrobiology (Madrid, INTA-CSIC) to visualise and analyse single spectra and datacubes (Rivilla et al., 2016a, 2017), using the information from the Jet Propulsion Laboratory (JPL; Pickett et al., 1998) and the Cologne Database for Molecular Spectroscopy spectral catalogs (CDMS; Müller et al., 2005). We identified a total of 22 transitions of CH3NCO, 8 out of which were unblended with upper level energies ranging from 175 to 233 K (see Table 1) using MADCUBAIJ. The remaining 14 lines appear contaminated by emission from other species. The CH3NCO lines peak at a radial velocity of = 2.7 km s-1 and have linewidths of 1.1 km s-1 (Fig. 1), similar to those from other molecules in IRAS16293 B (Jorgensen et al., 2011).
| Frequency | Transition | logAul | Eup | Area |
|---|---|---|---|---|
| (GHz) | (J,Ka,Kc,m) | (s-1) | (K) | Jy km s-1 |
| 157.258419 | (18,2,0,3)(17,2,0,3) | -3.75 | 210 | 0.028 0.009 |
| 157.259087 | (18,2,0,-3)(17,2,0,-3) | -3.75 | 210 | 0.028 0.009 |
| 232.342227 | (27,2,0,2)(26,2,0,2) | -3.22 | 234 | 0.12 0.04 |
| 232.411044 | (27,1,0,1)(26,1,0,1) | -3.22 | 175 | 0.16 0.06 |
| 240.302835 | (28,0,0,1)(27,0,0,1) | -3.17 | 181 | 0.18 0.06 |
| 250.313498 | (29,3,27,0)(28,3,26,0) | -3.13 | 235 | 0.16 0.05 |
| 250.323521 | (29,3,26,0)(28,3,25,0) | -3.13 | 235 | 0.16 0.05 |
| 250.676140 | (29,0,29,0)(28,0,28,0) | -3.13 | 181 | 0.21 0.07 |
MADCUBAIJ produces synthetic spectra assuming Local Thermodinamical Equilibrium (LTE) conditions. The comparison between the observed and the synthetic spectrum for the unblended ransitions can be used to derive the excitation temperature and total column density that best match the observations. We assumed a linewidth of 1.1 km s-1, and the source size was constrained by the continuum emission to 0.5′′ (see Figure 2), which agrees with the source size assumed in previous works (Jorgensen et al., 2016; Coutens et al., 2016; Lykke et al., 2017). The observed spectra and the corresponding LTE fitted synthetic spectrum for the 8 unblended lines detected are shown in Fig 1. All CH3NCO transitions were found to be optically thin ( 0.08), and thus our analysis is not affected by optical depth effects. In addition, a careful check of the synthetic spectrum was performed to confirm that no dectectable transitions were missing from our observational data.
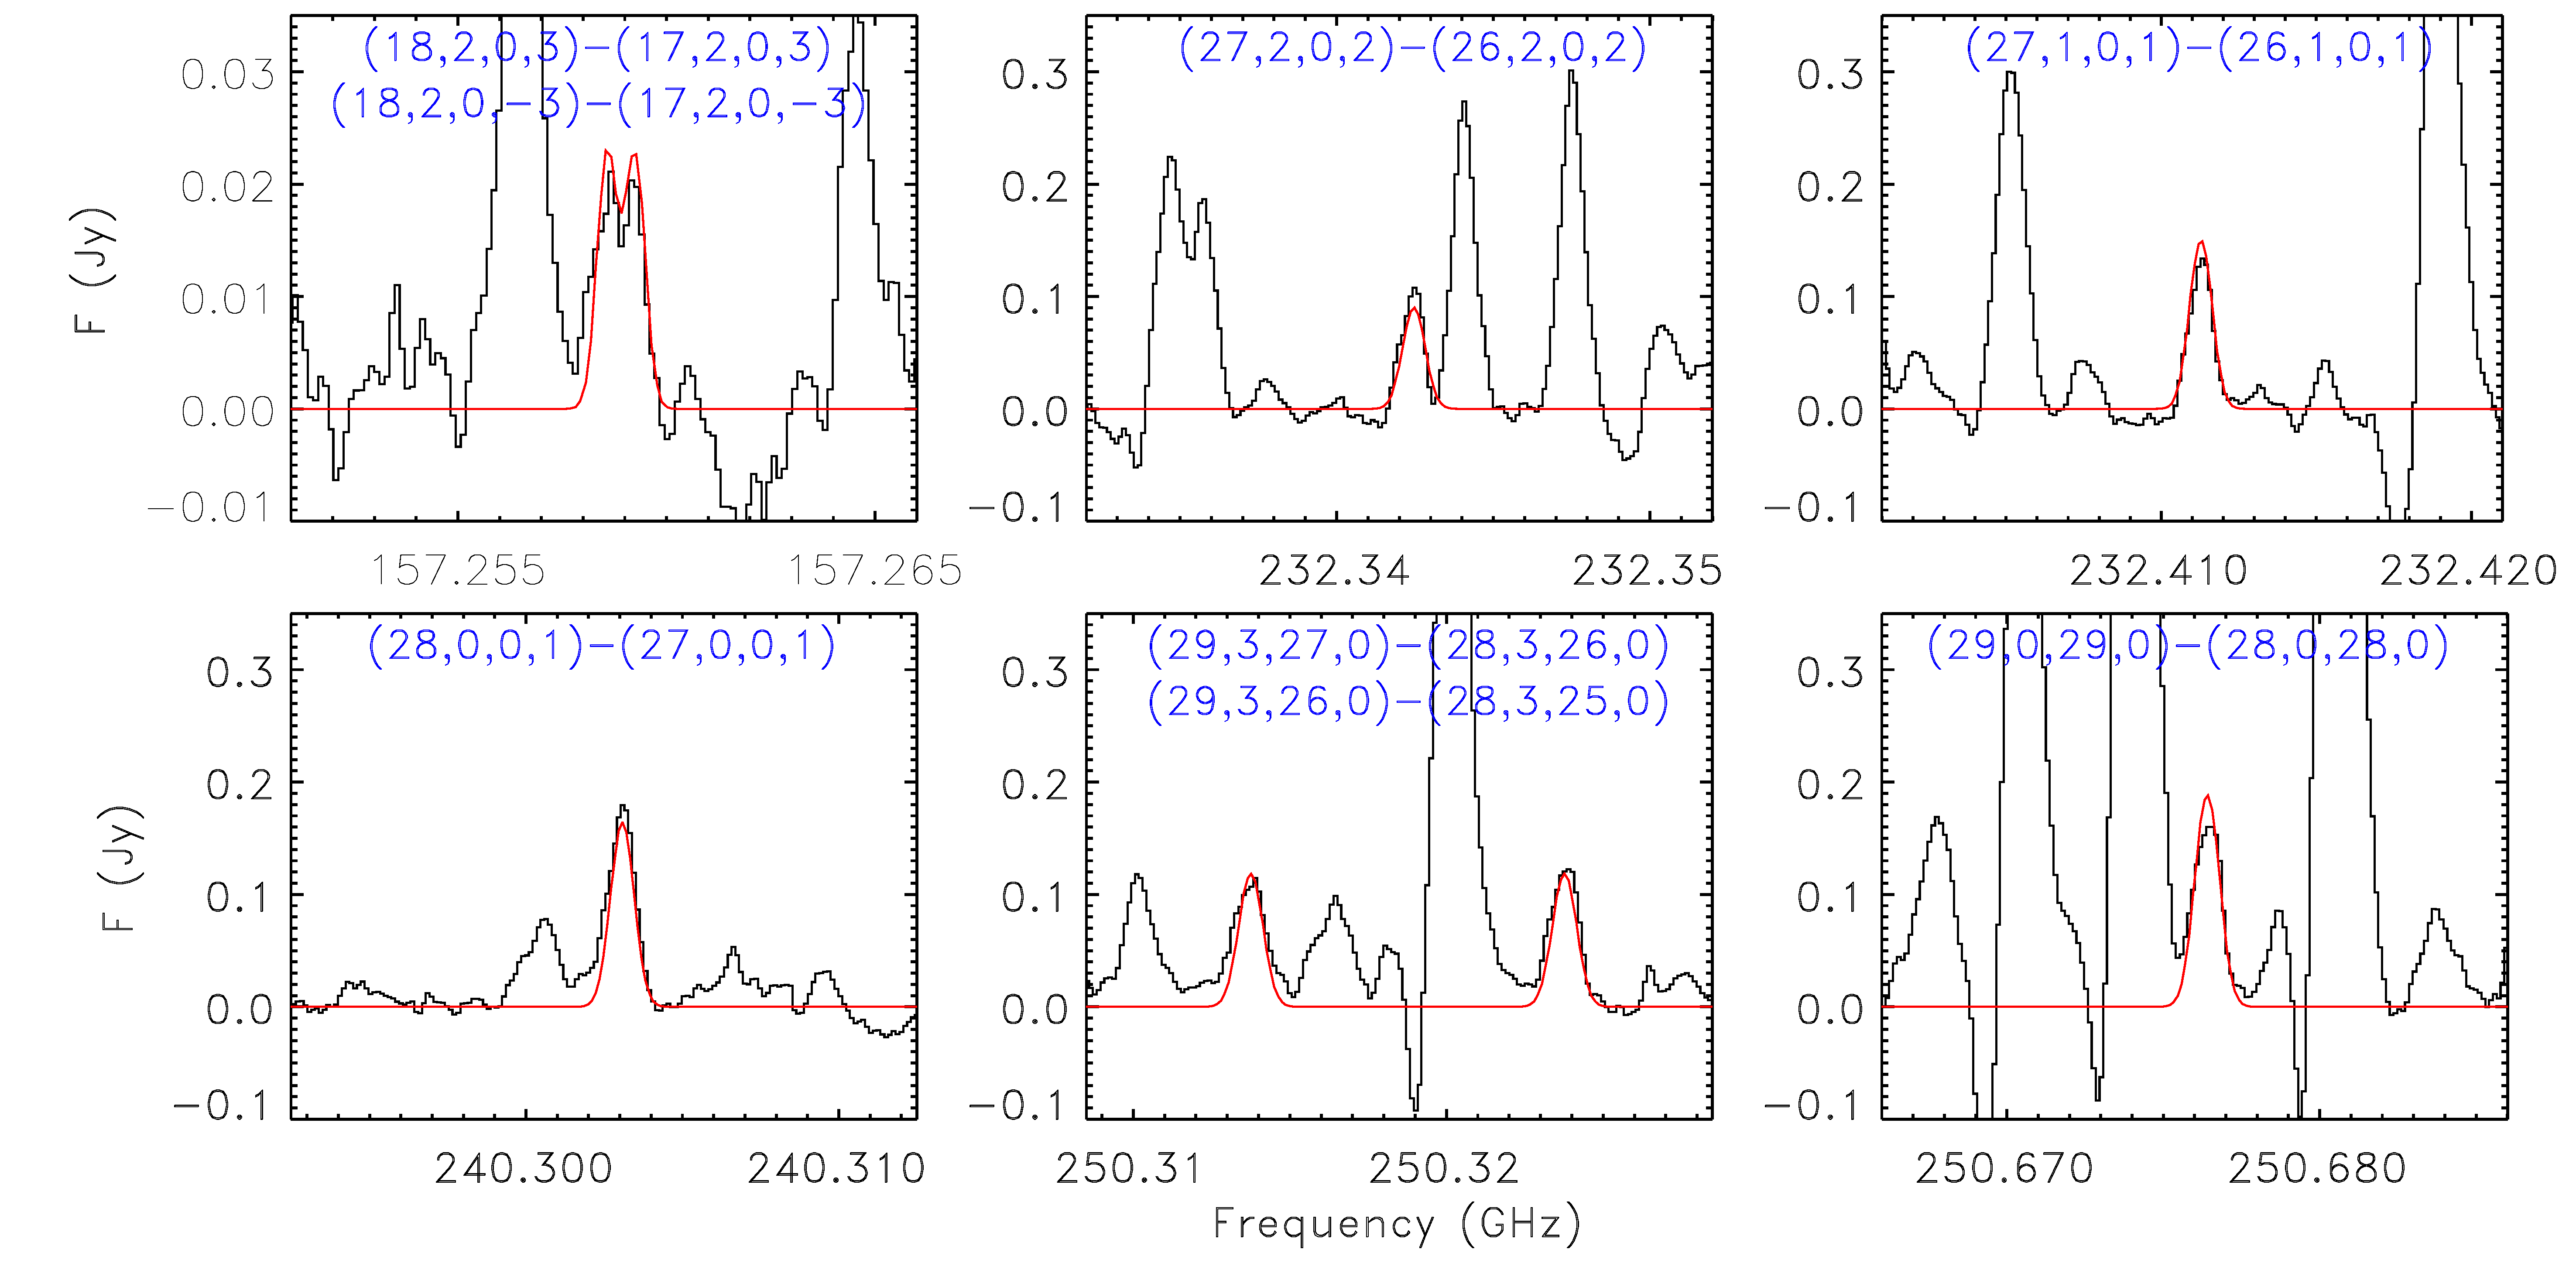
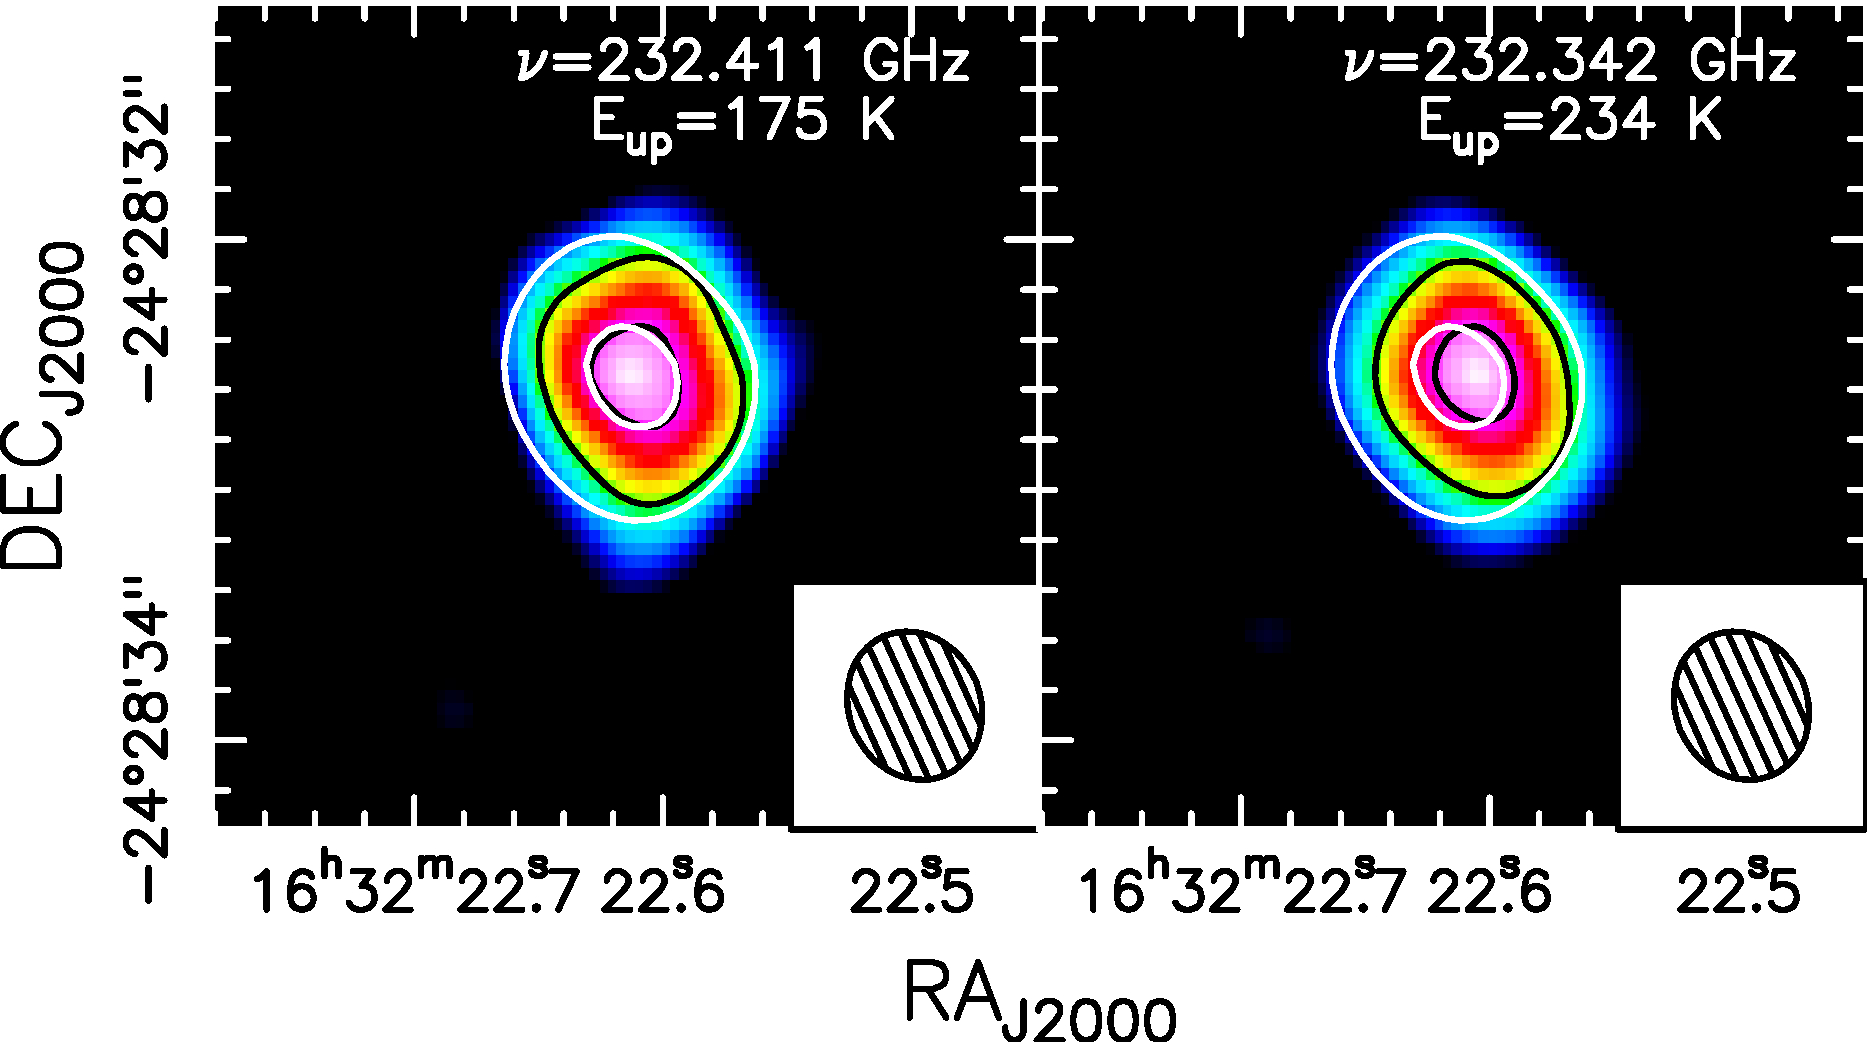
The detected CH3NCO transitions are well reproduced by an excitation temperature of =11019 K. This is similar to that found for other COMs such as acetaldehyde or propanal in IRAS16293 B (Lykke et al., 2017). The derived column density is (CH3NCO)=(4.00.3)1015 cm-2, which agrees with the column density reported in Ligterink et al. (2017) assuming the same source size and excitation temperature for the transitions with E300 K detected at frequencies 320 GHz. The spatial distribution of CH3NCO is shown in Fig. 2 and it is coincident with the continuum emission. The measured deconvolved size is 0.5, consistent with the assumed source size.
In order to estimate the CH3NCO abundance, we have derived the H2 column density by using the continuum flux measured at 232 GHz (1.40.05 Jy within a deconvolved size of 0.550.47), and by assuming optically thin dust, a dust opacity of 0.009 cm2 g-1 (thin ices in a H2 density of 106 cm-3; see Ossenkopf & Henning, 1994) and a gas-to-dust mass ratio of 100. The estimated H2 column density for Tdust=Tex=110 K (at these high densities, dust and gas are thermally coupled) is (H2)=2.8 1025 cm-2, consistent with that estimated by Jorgensen et al. (2016) at higher frequencies. We however caution that this value should be considered as a lower limit since dust may be optically thick even at these low frequencies. The derived abundance of CH3NCO is (CH3NCO)=(1.40.1)10-10 and it should be considered as an upper limit.
Transitions corresponding to two isomers of methyl isocyanate, CH3CNO and CH3OCN, were not detected in our dataset, and 3 upper limits of 2.71013 cm-2, and 5.11014 cm-2 (respectively) were extracted assuming the same linewidth and excitation temperature. This upper limits lead to column density ratios of CH3NCO/CH3CNO150 and CH3NCO/CH3OCN8.
3.2 Chemically-related species: HNCO and NH2CHO
In Orion KL, CH3NCO shows the same spatial distribution as HNCO and NH2CHO (Cernicharo et al., 2016) and therefore they are thought to be chemically related. Several transitions of HNCO and NH2CHO, and of some of their isotopologues, are also covered and detected in our dataset. The HNCO and NH2CHO lines are optically thick (Coutens et al., 2016) and their column densities have been inferred using the HNC18O and NHCHO isotopologues. Five unresolved transitions of HNC18O are found at 250 GHz with Eup=122 K. For a fixed excitation temperature of =110 K, (the derived for CH3NCO; see Section 3.1) we obtain a column density of (HNC18O)=(9.73.8)1013 cm-2. By assuming an isotopic ratio 16O/18O = 500 (Wilson & Rood 1994), the derived total column density of HNCO is (HNCO)=(4.91.9)1016 cm-2, which yields an abundance of (1.80.7)10-9.
For NHCHO, three lines are detected at 156.957 GHz, 157.097 GHz, and 239.628 GHz, with Eup = 5898 K. Their emission is fitted with an excitation temperature of =75 K and a column density of (NHCHO)=(7.63.7)1014 cm-2. The derived is slightly lower than that obtained for CH3NCO, possibly due to the lower values of Eup covered by the NHCHO lines compared to those of CH3NCO. We note however, that both species show the same spatial extent (see Figure 2 and Coutens et al., 2016) and therefore, they likely trace the same gas. By assuming an isotopic ratio 12C/13C=68 (Milam et al., 2005), the derived total column density is (NH2CHO)=(5.22.5)1016 cm-2, which gives an abundance of (1.90.9)10-9. As for CH3NCO, these abundances should be considered as upper limits.
3.3 Comparison with other sources
The abundance of (1.40.1)10-10 measured for CH3NCO toward IRAS16293 B is similar to that found in SgrB2(N) (1.710-9 and 1.010-9 for the two components; see Cernicharo et al., 2016). In Table 2, we present the comparison between the abundance ratios CH3NCO/HNCO and CH3NCO/NH2CHO measured in IRAS16293 B with those from the three sources where CH3NCO has also been detected (e.g. SgrB2(N), Orion KL, and 67P/Churyumov-Gerasimenko; Goesmann et al., 2015; Halfen et al., 2015; Belloche et al., 2017; Cernicharo et al., 2016). Since we have estimated the column densities considering the same emitting region, the derived ratios are likely independent on the assumed source size and the derived H2 column density.
From Table 2, we find that the CH3NCO/HNCO column density ratio in IRAS16293 B is of the same order as those measured in SgrB2(N) and Orion KL. However, it is a factor of 50 lower than in comet 67P/Churyumov-Gerasimenko. We note however that the COSAC detections are tentative and therefore the abundance ratios in column 7 of Table 2 should be taken with caution. The CH3NCO/NH2CHO column density ratio in IRAS16293 B is similar to that observed in SgrB2(N), while it is factors 20-70 lower than those measured in Orion KL, and a factor of 10 lower than that in comet 67P/Churyumov-Gerasimenko. In Section 4, we explore the formation routes for CH3NCO and compare the measured ratios with those predicted by chemical modelling.
4 Chemical modelling
For the chemical modelling of CH3NCO, HNCO, and NH2CHO in IRAS16293 B, we have used the gas-grain chemical code UCL_CHEM recently re-written by Holdship et al., (submitted)333UCL_CHEM can be downloaded at https://uclchem.github.io/.. UCL_CHEM’s chemical network contains 310 species (100 of them are also on the grain surface) and 3097 reactions. Gas phase reactions are taken from the UMIST database (McElroy et al., 2013), while dust grain surface processes include thermal desorption (as in Viti et al., 2004) and non-thermal desorption processes such as direct UV desorption, cosmic ray-induced UV photons desorption, direct cosmic ray desorption, and H2 formation mechanism desorption (see Roberts et al., 2007). Recently, diffusion following the formalism from Hasegawa et al. (1992), and chemical reactive desorption (following the experimentally-derived formula of Minissale et al., 2016) have also been included in UCL_CHEM (Quénard et al. in prep.).
To model the chemistry of CH3NCO, HNCO and NH2CHO, we expanded UCL_CHEM’s chemical network by including recently proposed gas phase and grain surface formation routes. For the gas phase formation of CH3NCO, Halfen et al. (2015) proposed the following reactions:
| (1) | |||||
| (2) | |||||
| (3) |
Note that no gas-phase destruction route was proposed in their study. We have also included the reaction
| (4) |
to account for the fact that CH3NCOH+ may fragment into smaller products. For the grain surface formation, Belloche et al. (2017) and Cernicharo et al. (2016) proposed that CH3NCO could be formed through the grain surface reactions:
| (5) | |||||
| (6) |
These reactions have been found to be efficient experimentally (Ligterink et al., 2017). Furthermore, one of the possible formation routes of N-methylformamide (N-CH3NHCHO) may involve successive addition of hydrogen atoms to CH3NCO:
| (7) | |||||
| (8) |
where reaction (7) has an activation energy of 2500 K (Belloche et al., 2017). The HNCO network (both in the gas and on the grain surface), together with that of its isomers HCNO and HOCN (see Quan et al., 2010), have also been included in UCL_CHEM.
The physical conditions and the chemical composition of the IRAS16293 B hot corino were modelled using a three phase model. In Phase 0, we followed the evolution of the chemistry in a diffuse cloud (size of 0.6 pc and mag) by assuming a constant density of cm-3 and a temperature of K for 106 yrs. We assume an interstellar radiation field of Habing and the standard cosmic ray ionisation rate of s-1. The elemental abundances considered in this model are taken from Wakelam & Herbst (2008, model EA1).
In Phase 1 of our model, we follow the chemistry during the pre-stellar core phase assuming a constant temperature of K while we increase the core’s gas density from 102 cm-3 to cm-3 (this value is consistent with that measured in IRAS16293 B). In Phase 2, the chemical evolution of the hot corino is modelled by assuming a constant H2 gas density ( cm-3) while gradually increasing the gas temperature from 10 K to 110 K during the first 105 yrs. After then, the temperature is kept constant and the chemistry is followed during yrs.
The best fit to our observations is found for a dynamical age of 104 yrs, with a predicted abundance for CH3NCO of [CH3NCO]= (with respect to H2), i.e. a factor of 4 higher than that measured in IRAS16293 B (1.410-10; Section 3.1). We note that these time-scales are consistent with those estimated for this source (see, e.g., Bottinelli et al., 2014; Majumdar et al., 2016). In this model, HNCO (the parent molecule of CH3NCO) is formed on the surface of dust grains; and once the temperature reaches 100 K, HNCO is thermally desorbed and incorporated into the gas phase, allowing the gas-phase formation of CH3NCO to proceed (see reactions above and Halfen et al., 2015). We note that CH3NCO is also formed on grain surfaces in our model. However, this mechanism by its own is not sufficient to explain the observed abundances of this molecule in IRAS16293 B. Therefore, our modelling shows that formation both in the ices and in the gas phase is required to explain the observed abundance of CH3NCO in IRAS16293 B. We note that, while the HNCO abundance predicted by our model (3.810-9) also agrees well with that observed in IRAS16293 B (1.810-9), the abundance of NH2CHO is underproduced by a factor of 10. As a result, while the CH3NCO/HNCO abundance ratio is well reproduced by our model, the CH3NCO/NH2CHO ratio differs from that observed by a factor of 40 (see Table 2). We also note that our model perfectly reproduces the upper limits of CH3NCO measured in cold cores such as L1544 (2-610-12; Jiménez-Serra et al., 2016, Quénard et al., in prep).
, are also shown.
| Protostars | Comet | |||||
| Molecular | Low-mass | High-mass | ||||
| ratio | IRAS16293 B | SgrB2(N) | Orion KL | 67P | ||
| obs. | model | A | B | |||
| CH3NCO/HNCO | 0.08 | 0.16 | 0.11 | 0.02 | 0.06 | 4.33 |
| CH3NCO/NH2CHO | 0.08 | 3.53 | 0.06 | 1.75 | 5.71 | 0.72 |
We carried out an additional test including the isomers of CH3NCO, for which their upper limits have been measured (see Section 3). We have assumed that CH3OCN and CH3CNO experience the same reactions as CH3NCO at the same rates, although this assumption is highly uncertain given the lack of experimental data. The abundance of CH3NCO changes only by a factor of 1.1, but CH3OCN and CH3CNO are overproduced by factors 10-100. This means that their associated reaction rates need to be lowered by several orders of magnitude to match the observed upper limits. The full chemical network of CH3NCO and its isomers will be discussed in detail in Quénard et al. (in prep.).
Acknowledgments
This Letter makes use of the following ALMA data: ADS/JAO.ALMA#2011.0.00007.SV, #2012.1.00712.S, #2013.1.00061.S, and #2013.1.00352.S. ALMA is a partnership of ESO (representing its member states), NSF (USA) and NINS (Japan), together with NRC (Canada), NSC and ASIAA (Taiwan), and KASI (Republic of Korea), in co-operation with the Republic of Chile. The Joint ALMA Observatory is operated by ESO, AUI/NRAO and NAOJ This research was partially financed by the Spanish MINECO under project AYA2014-60585-P, by the Italian Ministero dell’ Istruzione, Università e Ricerca, through the grant Progetti Premiali 2012 – iALMA (CUP C52I13000140001), and by the Gothenburg Centre for Advanced Studies in Science and Technology, where the re-calibration and re-imaging of all the ALMA Archive data on IRAS 16293-2422 was carried out as part of the GoCAS program “Origins of Habitable Planets”. R.M.-D. benefited from a FPI grant from Spanish MINECO. I.J.-S. acknowledges the financial support from an STFC Ernest Rutherford Fellowship and Grant (projects ST/L004801/2 and ST/M004139/2). J.M.-P. acknowledges partial support by the MINECO under grants FIS2012-39162-C06-01, ESP2013-47809-C03-01, and ESP2015-65597-C4-1. We thank an anonymous referee, and Dr. Wing Fai-Thi for providing useful comments on the manuscript.
References
- Altwegg et al. (2015) Altwegg, K., Balsiger, H., Bar-Nun, A., et al. 2015, Science, 347, 6220, id.1261952
- Belloche et al. (2017) Belloche, A., Meshcheryakov, A.A., Garrod, R.T., et al. 2017, A&A, accepted
- Biver et al. (2014) Biver, N., Bockelée-Morvan, D., Debout, V., et al. 2014, A&A, 516, A109
- Bottinelli et al. (2014) Bottinelli, S., Wakelam, V., Caux, E., Vastel, C., Aikawa, Y., & Ceccarelli, C. 2014, MNRAS, 441, 3, 1964
- Cernicharo et al. (2016) Cernicharo, J., Kisiel, Z., Tercero, B., et al. 2016, A&A, 587, L4
- Coutens et al. (2016) Coutens, A., Jorgensen, J., van der Wiel, M.H.D., et al. 2016, A&A, 590, L6
- Coutens et al. (2012) Coutens, A., Vastel, C., Caux, E., et al. 2012, A&A, 539, A132
- Goesmann et al. (2015) Goesmann, F., Rosenbauer, H., Bredehöft, J.H., et al. 2015, Science, 346, 6247, id.0689
- Halfen et al. (2015) Halfen, D.T., Ilyushin, V.V., & Ziurys, L.M. 2015, ApJL, 8212, L5
- Hasegawa et al. (1992) Hasegawa, T. I., Herbst, E., & Leung, C. M. 1992, ApJS, 82, 167
- Jiménez-Serra et al. (2016) Jiménez-Serra, I., Vasyunin, A.I., Caselli, P., et al. 2016, ApJ, 830, 1, L6
- Jorgensen et al. (2011) Jorgensen, J.K., Bourke, T.L., Nguyen Luong, Q., & Takakuwa, S. 2011, A&A, 534, A100
- Jorgensen et al. (2012) Jorgensen, J.K., Favre, C., Bisschop, S.E., Bourke, T.L., et al. 2012, ApJL, 757, 1, L4
- Jorgensen et al. (2016) Jorgensen, J.K., van der Wiel, M.H.D., Coutens, A., et al. 2016, A&A, 595, A117
- Kasten & Dreizlet (1986) Kasten, W., & Dreizler, H. 1986, Z. Natur. 41a, 637
- Koput, J. (1986) Koput, J. 1986, JMoSp, 115, 131
- Ligterink et al. (2017) Ligterink, N.F.W., Coutens, A., Kofman, V., et al. 2017, MNRAS, submitted
- Loinard et al. (2008) Loinard, L., Torres, R.M., Mioduszewski, A.J., &Rodríguez, L.F. 2008, ApJL, 675, 1, L29
- Looney et al. (2000) Looney, L.W., Mundy, L.G., & Welch, W.J. 2000, ApJ, 529, 1, 477
- Lykke et al. (2017) Lykke, J.M., Coutens, A., Jorgensen, J., et al. 2017, A&A, 597, A53
- Majumdar et al. (2016) Majumdar, L., Gratier, P., Vidal, T., et al. 2016, MNRAS, 458, 2, 1859
- McElroy et al. (2013) McElroy, D., Walsh, C., Markwick, A. J., et al. 2013, A&A, 550, A36
- Milam et al. (2005) Milam, S.N., Savage, C., Brewster, M.A., Ziurys, L.M., & Wyckoff, S. 2005, ApJ, 634, 1126
- Minissale et al. (2016) Minissale, M., Dulieu, F., Cazaux, S., & Hocuk, S. 2016, A&A, 585, A24
- Müller et al. (2005) Müller, H. S. P., Schlöder, F., Stutzki, J., & Winnewisser, G. 2005, J. Mol. Struct. 742, 215
- Ossenkopf & Henning (1994) Ossenkopf, V. & Henning, Th. 1994, A&A, 291, 3, 943
- Pascal et al. (2005) R. Pascal, L. Boiteau, A. Commeyras, 2005, Top. Curr. Chem., 259, 69
- Pickett et al. (1998) Pickett, H. M., Poynter, R. L., Cohen, E. A., Delitsky, M. L., Pearson, J. C., & Müller, H. S. P. 1998, J. Quant. Spectrosc. & Rad. Transfer, 60, 883
- Pineda et al. (2012) Pineda, J. E., et al. 2012, A&A, 544, L7P
- Quan et al. (2010) Quan, D., Herbst, E., Osamura, Y., & Roueff, E. 2010, ApJ, 725, 2101
- Rivilla et al. (2016a) Rivilla, V.M., Fontani, F., Beltrán, M.T., et al. 2016, ApJ, 826, 2
- Rivilla et al. (2017) Rivilla, V. M. and Beltrán, M. T., Cesaroni, R., et al., 2017, A&A, 598, A59
- Roberts et al. (2007) Roberts, J. F., Rawlings, J. M. C., Viti, S., & Williams, D. A. 2007, MNRAS, 382, 733
- Viti et al. (2004) Viti, S., Collings, M. P., Dever, J. W., McCoustra, M. R. S., & Williams, D. A. 2004, MNRAS, 354, 1141
- Wakelam & Herbst (2008) Wakelam, V., & Herbst, E. 2008, ApJ, 680, 371-383
- Zapata et al. (2013) Zapata L., et al., 2013, ApJ, 764, L14Z