LaTex Template for ECRS 2016
Development of a Machine Learning Based Analysis Chain for the Measurement of Atmospheric Muon Spectra with IceCube
Abstract
High-energy muons from air shower events detected in IceCube are selected using state of the art machine learning algorithms. Attributes to distinguish a HE-muon event from the background of low-energy muon bundles are selected using the mRMR algorithm and the events are classified by a random forest model. In a subsequent analysis step the obtained sample is used to reconstruct the atmospheric muon energy spectrum, using the unfolding software TRUEE. The reconstructed spectrum covers an energy range from GeV to GeV. The general analysis scheme is presented, including results using the first year of data taken with IceCube in its complete configuration with instrumented strings.
I Introduction
IceCube is a cubic kilometer detector array located at the geographic South Pole. Its Digital Optical Modules (DOMs) are used to detect secondary muons produced either in neutrino interactions with ice or bedrock, or in cosmic ray air showers. The combination of the conventional (i.e. produced in pion and kaon decays) atmospheric and astropysical neutrino flux dominates over the expected prompt component which is produced mainly by charmed hadron decays in the atmosphere. Therefore an accurate measurement of the prompt flux magnitude is a difficult task for a large-volume neutrino detector. Since the energy spectrum of atmospheric muons has no astrophysical component, this flux can be studied to determine the magnitude of the prompt flux which is produced in leptonic decays of charmed hadrons and unflavored mesons.
In general high-energy muons from air showers are accompanied by a bundle of low-energy muons. Therefore, the detection of HE-muons within a muon bundle is a challenging task as the IceCube detector lacks the spatial resolution to resolve individual muons within a muon bundle. To analyze the atmospheric muons we developed a data mining based analysis scheme that selects algorithmically from a large pool of reconstructed event properties the most powerful ones for distinguishing signal and background. A similar approach was used to analyze atmospheric neutrinostim in IceCube.
The developed analysis chain was used to reconstruct the spectrum of high-energy muons reaching the IceCube in-ice detector. For this analysis a HE-muon is defined as a muon which fulfills the following condition
| (1) |
describes the energy of the HE-muon and the total bundle energy including the HE-muon. Since the muons within the bundle cannot be resolved spatially, high-energy muons can only be identified indirectly from the relation between catastrophic and continuous energy losses, and separation from background is challenging.
Our analysis chain has the following three parts: a) the selection of event properties (hereafter referred to as attributes) to be used in the analysis, b) the classification of events into signal and background using these attributes, and c) the reconstruction of the spectrum of the HE-muons at the surface.
II Attribute Selection
Choosing the right attributes is a crucial step for every analysis. For this proceeding every value which is measured or reconstructed for every single detected or simulated event is referred to as an attribute. From the pool of all available attributes we select algorithmically those that agree between data and simulation using a comparison of the integrated distributions. This is also a criterion in the attribute selection since only well simulated attributes can be used to draw conclusions for measured events. For following steps it is common to manually select attributes based on experience and expert knowledge. In this analysis the large dimensionality of the set of attributes renders this procedure impossible.
An algorithmic approach like the mRMR algorithmding05 is necessary. In the mRMR algorithm the relevance and the redundancy of a specific set of attributes is analyzed. In a specific attribute set the relevance describes the correlation of each attribute to the signal and background events whereas the redundancy quantifies the correlation between the attributes in this set. In the mRMR algorithm a maximization of the equation
| (2) |
is performed. The attribute set is built up iteratively by adding a single attribute which maximizes in equation 2 in each step. The advantage of this procedure is the possibility to determine the best attributes which are able to classify the data for any size of the attribute set. In this analysis the final attribute set uses attributes which proved to be a good tradeoff between execution time and separation quality.
III Event Classification
With the selected set of attributes a classification of events into signal and background has to be done. This can be achieved by splitting the event sample at a certain value of a certain attribute (a so called ”straight cut”), but algorithms from computer science like deep neural networksdl , boosted decision treesbdt or random forestsrfbrei are increasingly used and show comparable or superior performance. Here the random forest algorithm is used to perform the selection of HE-muons. A random forest is an ensemble of single decision trees which select random attributes at every knot and is proven to be more robust against overtraining. In the case of a two-class classification problem the random forest determines a score which indicates the most likely class affiliation. Here the score is used to distinguish between signal (HE-muons) and background events (low-energy muon bundles). Because the random forest builds multiple random decision trees, its score can simply be calculated by the fraction of single trees which classified an event to be signal over the total number of built trees .
| (3) |
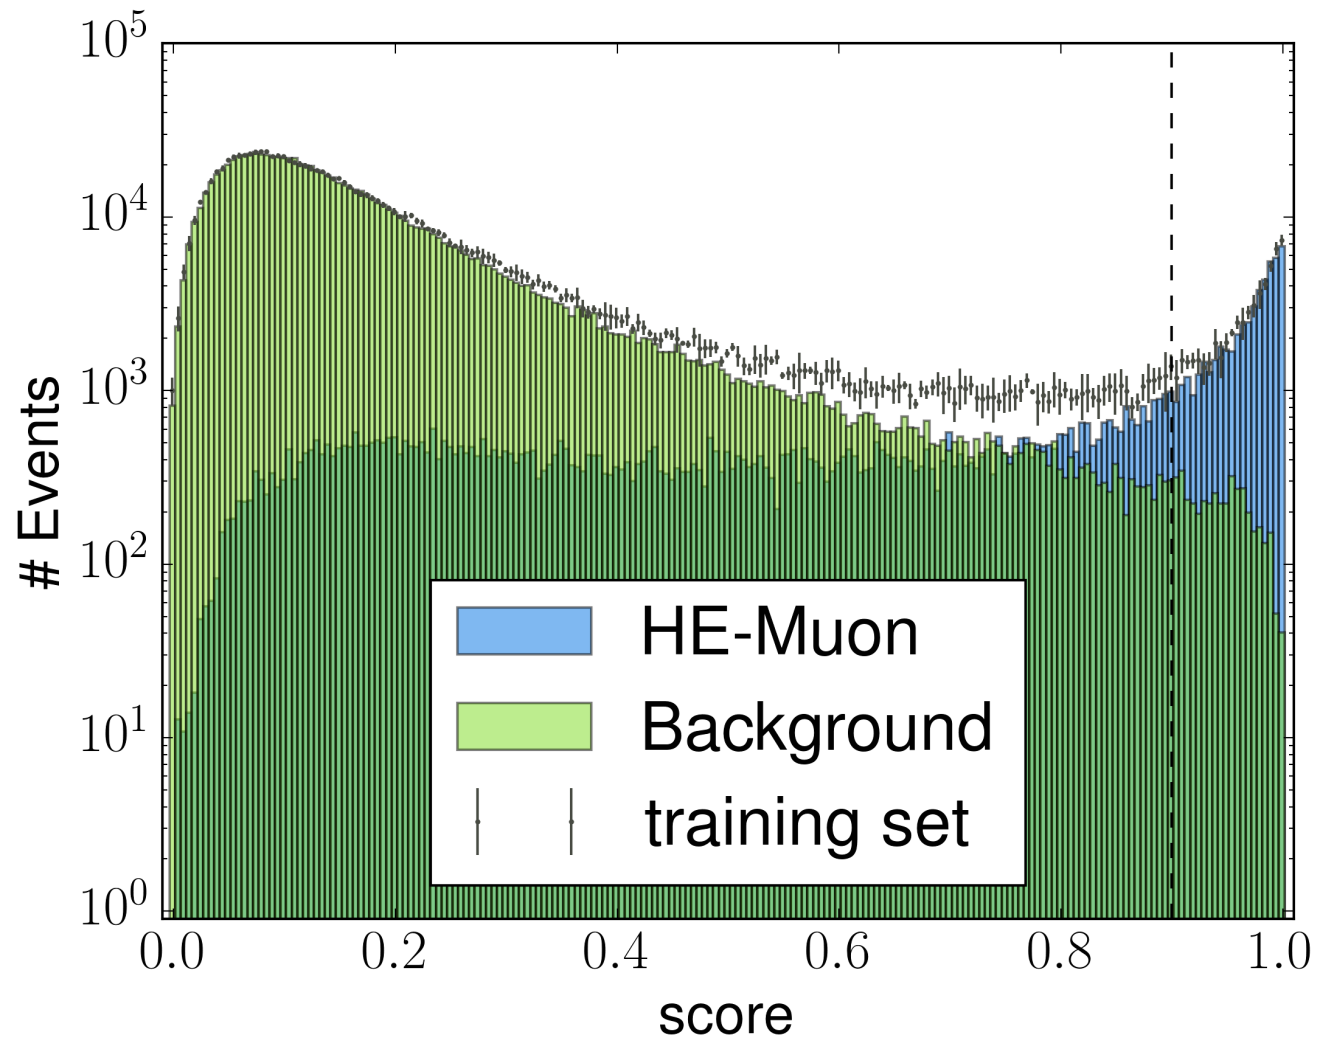
To avoid a misleading classification result by an overtrained model the data to build the model is split into a training and a test set with randomly chosen events. The results of the model trained on the training set applied to the test set can be seen in Figure 2. Both classes can be distinguished in the score distribution, so it can be used to separate the HE-muons from background events using a straight cut in the score value.
To evaluate the optimal cut values, different performance indicators are used. The most common indicators are the efficiency and the purity of a potential set of events. The efficiency describes the fraction of signal events above a specific score value. The purity is the ratio of signal events to the total number of events above a specific score value. The requirements on the purity and efficiency are problem dependent so that a general approach is not available. In this analysis a score cut of is used which results in an efficiency of and a purity of . The score cut was chosen because for higher cut values the efficiency of the resulting sample drops significantly.
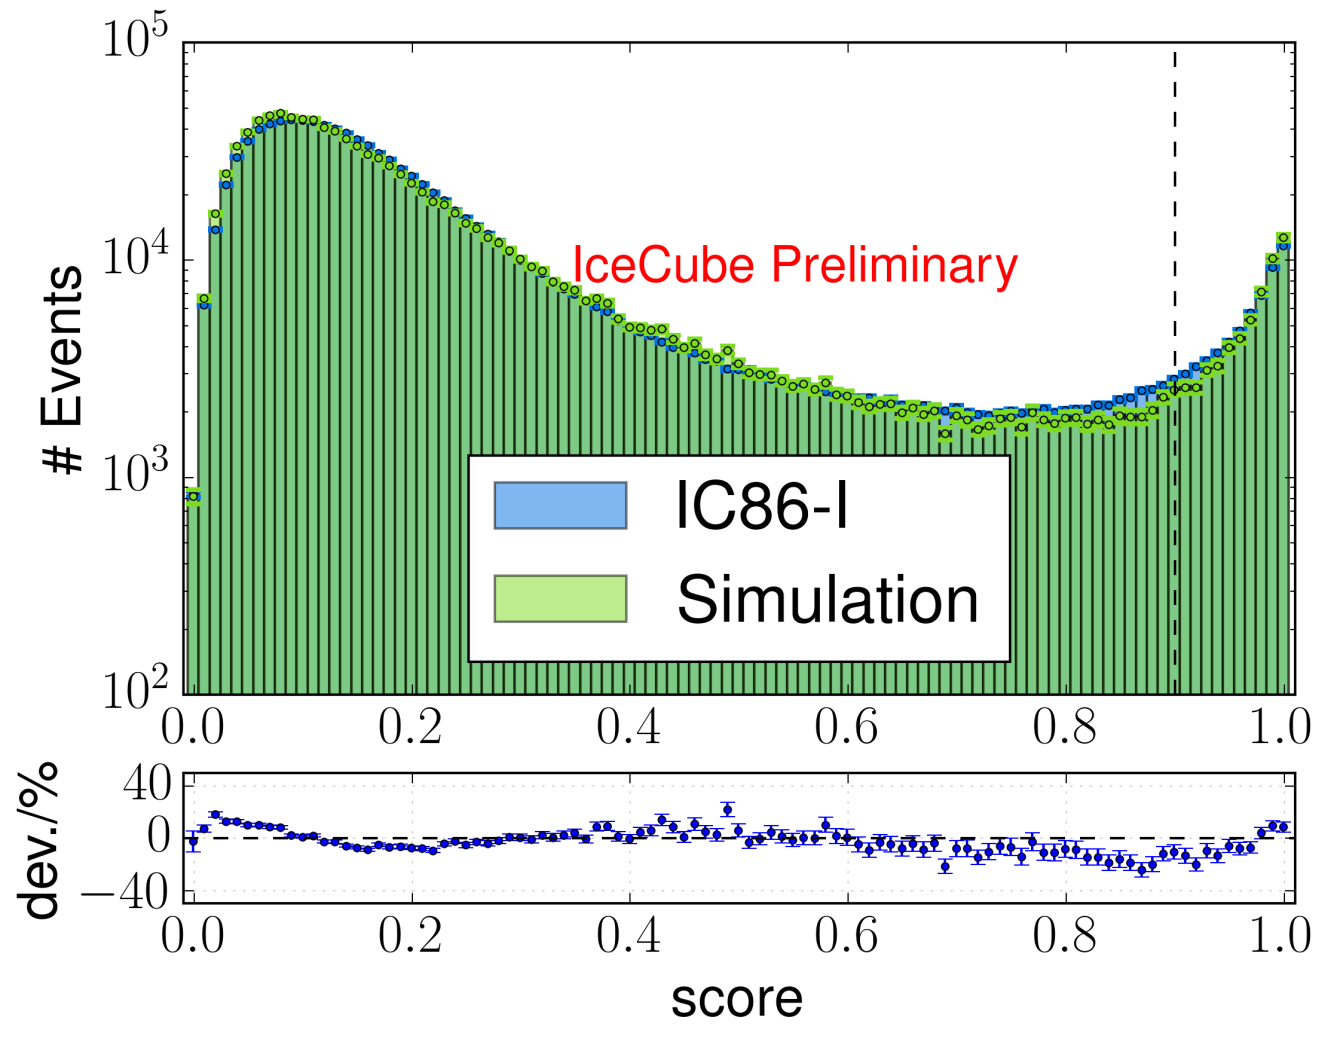
To rule out a possible mismatch between data and simulation the score distribution on simulated events is compared to data events. In Figure 2 an agreement within % between simulated and analyzed data events is seen. Since the data used to train the model is limited there is an uncertainty for the score distributions as well as the efficiency and purity. The uncertainty for the score, efficiency and purity are estimated using a -fold cross validation. In a cross validation the training set is split into parts. The model is trained on parts and applied on the left-out part. This procedure is repeated until every part has been used as a test set. The variance of performance values of the multiple classifications is used to estimate the uncertainty.
IV Unfolding
The muon energy at the surface cannot be measured directly. Its distribution has to be reconstructed from observables that can be measured at the detector. A common method is the forward folding which fits the expected event properties to the data varying parameters of a model of the muon energy spectrum at the surface. This method has the disadvantage that the resulting spectral shape is limited to the chosen parametrization. An alternative approach to this is the unfolding method which estimates the surface muon spectrum directly by inverting the response functions which describe the expected event properties for each value of the surface energy of the muon. This method is based on a Fredholm integral of the second kind which can be discretized to
| (4) |
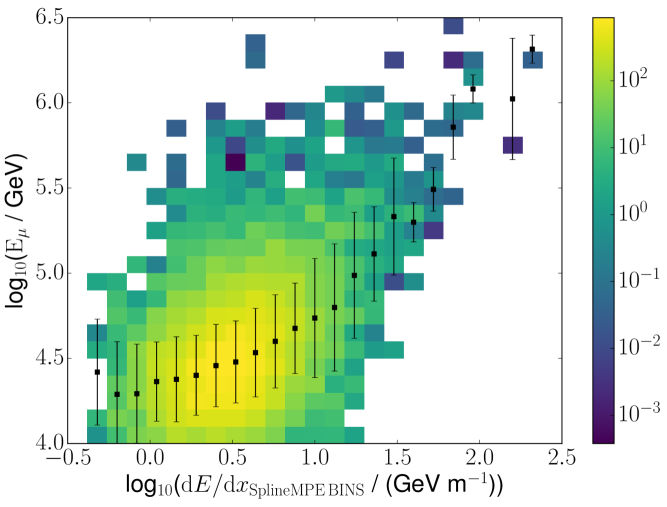
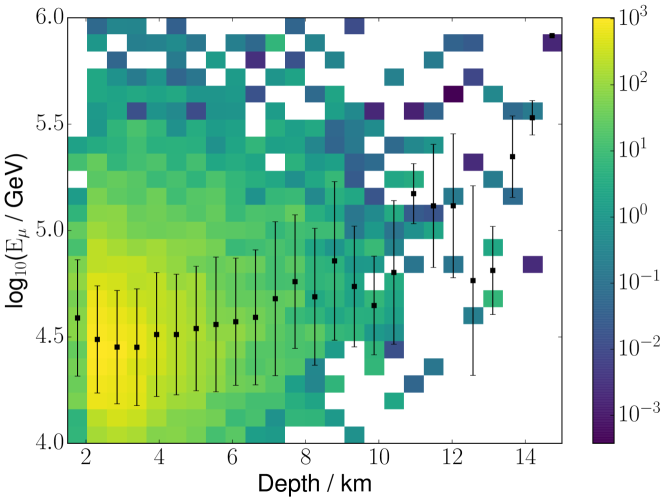
The sought after distribution is folded with a response matrix . The response matrix describes the expected distribution of a specific attribute for each bin in surface muon energy. A background contribution has to be considered in addition to obtain the expected distribution of . The matrix is determined from simulated events and the reconstruction of is done using a regularizedtik likelihood fit with the software TRUEEtruee . In the case of HE-muons two attributes are used for the reconstruction of the surface energy. This surface energy of the muon is determined by the reconstructed energy losses of the muon in the detector and the estimated energy losses occuring during the propagation from the surface to the detector. To account for their energy loss prior to reaching IceCube, the distance from the surface to the detector boundary is used since no measurement can be performed outside the detector. The correlation between the surface energy and the reconstructed energy loss and the distance from the surface Depth of the events are shown in the Figures 4 and 4.
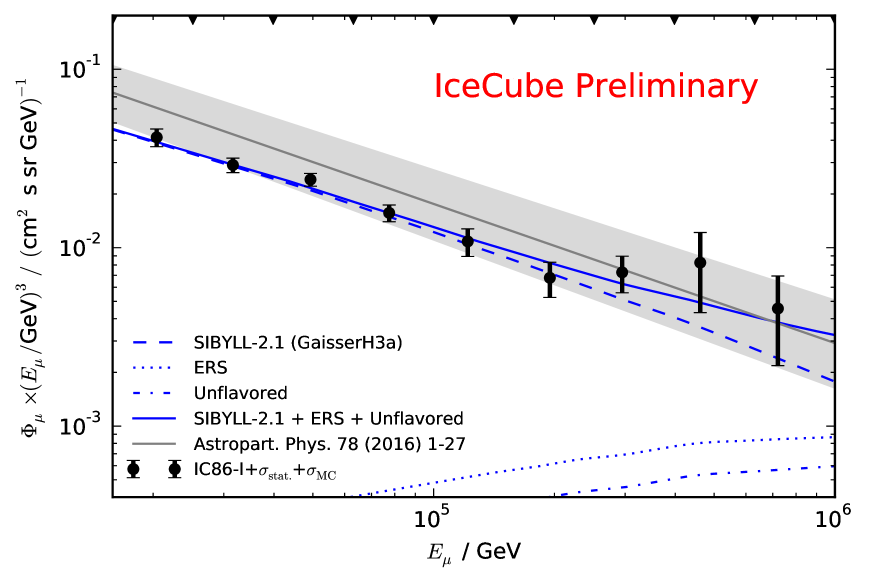
Using these attributes a surface energy spectrum of the HE-muons can be determined and is shown in Figure 5. To enhance the visibility of spectral features of the reconstructed flux the result is multiplied by . The blue lines in Figure 5 are theoretic predictions for the flux and are split into a conventional part (using SIBYLL-2.1sybillflux as the hadronic interaction model and GaisserH3ah3a as the cosmic-ray spectrum) and a prompt contribution from charm (ERScharm ) and unflavored (Unflavoredunfl ) particles. A previous analysis without a machine learning approach published in patrick is shown with its uncertainties as a gray band. The results of this analysis are plotted as black circles.
The uncertainty of this analysis has two contributions. A smaller one from the limited statistics of observed events and a larger one from the limited statistics of simulated signal events. To estimate the uncertainty from the limited simulation events the spectrum was reconstructed using multiple resampled subsets of the total set. The variance of the spectra was then considered in the estimation of the uncertainty. This yields a large uncertainty, especially for the higher energies ( GeV). This is due to the fact that events with more energy are far less often simulated due to the assumed cosmic ray spectrum in the simulation.
V Conclusion and Future Perspectives
The described machine learning based analysis chain proved that it can be used to seperate HE-muons from background events and unfold their energy spectrum. The reconstructed spectrum of HE-muons is compatible with theoretical predictions and with previous results from the IceCube collaboration. This spectrum does not include systematic effects compared to the published results shown in the gray band. Therefore it is expected that the uncertainty of the reconstructed spectrum will increase with the inclusion of systematic effects. The statistical significance is not sufficient to determine whether a prompt contribution is present on the predicted level in the resulting spectrum.
Since the uncertainty is due to the lack of simulated events, improvements of the final result are expected with growing numbers of simulations. The available simulation statistics for the years and above is times larger than in this analysis. This will decrease the statistical uncertainty of the simulation and extend the results of this analysis to higher energies.
References
- (1) M. G. Aartsen et al., The European Physical Journal C 75 (2015)
- (2) C. Ding et al., IEEE Transactions on Pattern Analysis and Machine Intelligence 27 (2016)
- (3) L. Breiman, Machine Learning 45 (2001)
- (4) Y. Bengio and Samy Bengio, Advances in Neural Information Processing Systems 12 (200)
- (5) Y. Freud and R. E. Schapire, Machine Learning: Proceedings of the Thirteenth International Conference (1996)
- (6) L. Breiman, Machine Learning 45 (2001)
- (7) A. N. Tikhonov, Dokl. Akad. Nauk SSSR 151 (1963)
- (8) N. Milke et al., NIM A 697 (2013)
- (9) M.G. Aartsen et al., Astropart. Phys. 78 (2016)
- (10) A. Fedynitch et al., Phys. Rev. D 86 (2012)
- (11) T.K. Gaisser, Astropart. Phys. 35 (2012)
- (12) R. Enberg et al., Phys. Rev. D 78 (2008)
- (13) A. Fedynitch et al., PoS(ICRC2015) 558 (2015).