Descriptors for thermal expansion in solids
Abstract
Thermal expansion in materials can be accurately modeled with careful anharmonic phonon calculations within density functional theory. However, because of interest in controlling thermal expansion and the time consumed evaluating thermal expansion properties of candidate materials, either theoretically or experimentally, an approach to rapidly identifying materials with desirable thermal expansion properties would be of great utility. When the ionic bonding is important in a material, we show that the fraction of crystal volume occupied by ions, (based upon ionic radii), the mean bond coordination, and the deviation of bond coordination are descriptors that correlate with the room-temperature coefficient of thermal expansion for these materials found in widely accessible databases. Correlation is greatly improved by combining these descriptors in a multi-dimensional fit. This fit reinforces the physical interpretation that open space combined with low mean coordination and a variety of local bond coordinations leads to materials with lower coefficients of thermal expansion, materials with single-valued local coordination and less open space have the highest coefficients of thermal expansion.
I Introduction
Because of the potential for temperature gradients or other thermal stresses to cause electronic devices to fail, knowledge of the coefficients of thermal expansion (CTE) of materials is important. Either active materials with desired thermal properties or composites of active and compensating materials can mitigate the ill effects of thermal expansion in real devices Lind (2012); Chen et al. (2015). A compensating material must be chemically and electrically compatible with the functional material and will typically contract with increasing temperature; i.e. it will exhibit negative thermal expansion (NTE). While the CTEs for many materials have been cataloged, the set of known NTE materials is small, and materials appropriate for specific applications may not yet be available. A means of rapidly predicting the thermal expansion properties of yet-to-be investigated materials will be extremely useful.
The displacement of the equilibrium positions of atoms in a material with temperature is the source of thermal expansion. While anharmonicity in the vibrations of bonded pairs of atoms will drive the atoms farther apart with increasing temperature, crystal structure also plays an essential role in the specific thermal expansion characteristics of a material, providing behaviors over the range from positive thermal expansion (PTE) to NTE. Accurate theoretical modeling of thermal expansion in materials necessitates quantum mechanical calculations and dynamical calculations or, minimally, quasi-harmonic modeling. As a result, typical calculations of thermal expansion address the microscopic causes of experimentally-observed CTE on a case-by-case basis. Especially prevalent recently are experimental and theoretical investigations of materials that exhibit NTE, such as Mary et al. (1996); Pryde et al. (1996); Ramirez and Kowach (1998); Ernst et al. (1998); Mittal and Chaplot (1999); Mittal et al. (2001); Cao et al. (2002, 2003); Hancock et al. (2004); Tucker et al. (2005); Gava et al. (2012); Bridges et al. (2014); Sanson (2014), (with ) Gupta et al. (2014), Božin et al. (2012); Chatterji et al. (2009), and .Li et al. (2011); Lazar et al. (2015) Except for materials with very similar electronic and structural properties, a global picture capable of guiding searches for new materials with desired thermal expansion characteristics is slow to emerge. While a useful high-throughput approach to estimating material thermal properties, employing fits of DFT-calculated energy-volume curves to equations of state and employing a quasi-harmonic Debye approximation, has been developedToher et al. (2014) and recently improvedToher et al. (2017), the approach we present provides an complementary picture through its focus on local structural properties. Comprehensive reviews of thermal expansion in materials, emphasizing NTE in both theory and experiment, can be found in Refs. Barrera et al., 2005 and Dove and Fang, 2016.
For microscopic atomic displacements to create NTE, the motions of the atoms must carry them into spaces already existing within the lattice, while simultaneously drawing neighboring ions closer together. It is well-knownBarrera et al. (2005); Dove and Fang (2016) that the definition of the volumetric thermal expansion ,
| (1) |
can, with the help of a Maxwell relation, be rewritten as
| (2) |
which shows that for a material to exhibit NTE, entropy must increase with pressure, contrary to typical expectations. Typically, decreasing the volume available to a free particle is associated with decreasing entropy. The definition in Eq. 2 is isothermal, which effectively means that the momentum space contribution to entropy changes negligibly relative to the real space contribution. From this we deduce that applying pressure in an NTE material effectively increases the volume available to its constituent atoms. On the other hand, applying pressure to PTE materials (at constant temperature) results in decreasing entropy, implying a corresponding decrease in the effective volume available to the atoms that follows from the same line of argument used above. In order for there to be more volume available to the atoms within a crystalline material despite decreasing total volume, atomic motions must be directed more significantly into the open spaces within the lattice. In other words, the atomic motions possess significant components in directions perpendicular to the bonds with nearest-neighbor atoms. The difference between NTE and PTE is therefore directly related to the degree to which ionic thermal displacements are longitudinal or transverse with respect to the bonds. Experimental evidence supporting this view is found, for example, in a study of NTE in , in which inelastic neutron scattering shows that the Sc-F bonds lengthen with increasing temperature and that the material contracts over a wide temperature range as a result of large transverse motions of the F ions Li et al. (2011). In our recent molecular dynamics investigation, we demonstrated that thermal expansion in a single structure, with expanding bonds modeled with first- and second-neighbor interactions via Morse potentials, can be varied from NTE to PTE by increasing the second-neighbor interaction strength relative to the first-neighbor interactions. Schick and Rappe (2016) By adjusting second-neighbor interactions, we reduced the transverse motions of the light ions, resulting in the emergence of PTE in the model. The key element permitting transverse motion in these examples is low bond coordination, which is necessarily linked to open lattices.
We propose that an approach to predicting thermal expansion can be found by scanning the literature for the structures of crystals, focusing on quantities that may have a relationship to the entropy of the material and its potential to increase or decrease with respect to pressure, such as the space occupied by ions and their bonding coordinations. We employ the wealth of structural information in databases such as the Inorganic Crystal Structure Database (ICSD) Bergerhoff (1987); Belsky et al. (2002) and the Crystallographic Open Database (COD) Merkys et al. (2016); Gražulis et al. (2015, 2012, 2009); Downs and Hall-Wallace (2003) in this work. By correlating materials with known CTE to their structures, we can begin to determine useful descriptors for thermal expansion. As a result of the lack of complete temperature dependences of the CTE for many of the materials investigated here, we focus on structures stable at room temperature and their CTEs. In Section II, we discuss the physical underpinnings for the quantities that we propose for descriptors of CTE. In Section III, we present the choice of descriptors from the original list of quantities of interest along with the result of performing a fit using the descriptors developed. We conclude with a discussion of the implications this correlation will have in the search for materials with desired thermal expansion properties.
II Proposed descriptors
For each atom in a unit cell of each material, the number of nearest neighbors and formal oxidation state are determined. From this information we obtain ionic radii Shannon (1976) for each ion and an estimate of the volume each ion occupies (assuming it occupies a sphere of volume ). The fractional volume occupied is the total volume estimated for all the atoms in the unit cell divided by the volume of the unit cell :
| (3) |
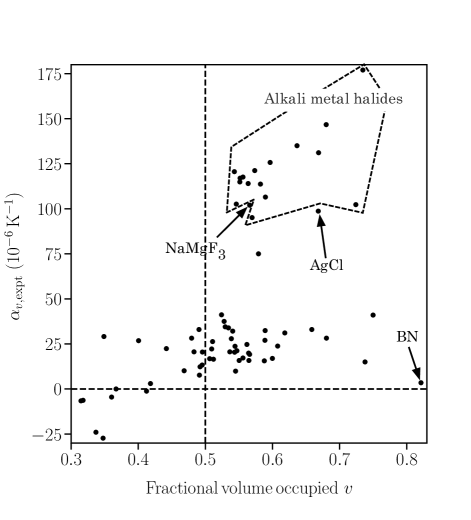
A complete list of the data used for this investigation is provided in the AppendixA. As seen in Fig. 1, thermal expansion data for the materials we sampled show that there is a relationship between thermal expansion and the volume occupied by atoms in the lattice; more open space corresponds to a greater likelihood for NTE.
The cluster of points with /K in Fig. 1 consists of binary materials that have the rock salt structure, with the corresponding high coordination providing an explanation for the large positive thermal expansion in these materials. We note that Coulomb interactions between second neighbors will be repulsive and strong. The data point with the highest volume occupied and very low PTE belongs to cubic BN. Because of its zincblende structure, the B and N atoms in BN have tetrahedral coordination. We also note that BN has a high bulk modulus, which implies that the tetrahedral bonds are strong and maintain their directionality. Although the volume occupancy of BN is high, the strong bonds produce a smaller thermal expansion. (The situation in BN is reminiscent of the diamond phases of C, Si, and Ge, which all have small values of at room temperature. It is notable that Si exhibits NTE at lower temperatures, indicating a lower barrier to transverse motions of its atoms.) Although low bond coordination in a material is a possible descriptor to predict thermal expansion coefficients, it is not sufficient on its own. Low coordination, such as seen in BN, is a result of directional bonding. But low coordination also occurs at the linking atoms in a crystal structure that is composed of groups of atoms forming stable units, as is the case for ScF3, ReO3 and other perovskite materials. Collective rotational-vibrational motion of these units is known as a rigid unit mode (RUM) Hammonds et al. (1996). RUMs are cited as the underlying cause of NTE in ScF3, ReO3 Chatterji et al. (2009), and, arguably, in ZrW2O8 Tucker et al. (2005). The atoms at the linking points of the rigid units typically are two-fold coordinated, while the atoms at the centers are more highly coordinated. The thermal vibrations of the RUM tend to be low frequency, carrying low-coordination atoms significant distances in directions transverse to the bonds. We note that the RUM is also presented as a foundational model for displacive phase transitions Dove (1997) connecting these vibrational modes to symmetry changes at phase boundaries. The importance of phase boundaries for which the higher-temperature phase has a smaller volume (and higher entropy) has been introduced as a thermodynamic cause of NTE Liu et al. (2011, 2014). As the temperature is increased toward the phase boundary from below, thermal fluctuations introducing an increasing fraction of the lower-volume, higher-entropy structure into the lattice is shown to be the necessary condition for NTE Liu et al. (2011, 2014). This is consistent with the observation above that greater entropy must be associated with smaller volume in NTE materials. As a result of these observations, we suggest that the variability of bonding coordinations in a material, indicative of rigid units, is a key structural quantity to be used as a descriptor for thermal expansion.
III Results and discussion
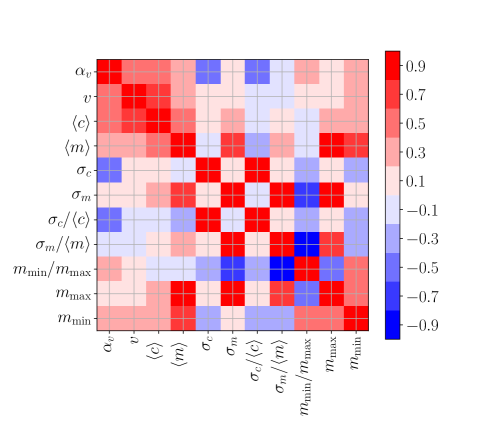
Quantities extracted in the search for descriptors, in addition to , are the mean bond coordination , its standard deviation , the mean atomic mass , the minimum mass , the maximum mass , and the standard deviation of mass . In Fig. 2, we display the linear correlations between descriptor candidates and the experimental . In addition, we include unitless ratios , , and the ratio of minimum to maximum mass . The quantities that have the strongest correlations with the are and , with correlations 0.48 and 0.55, respectively. The next-most-highly correlated quantity is , with a (negative) correlation of to . Furthermore, this quantity does not correlate with either the volume ratio or the mean coordination . The candidates involving mass have low correlations with and are neglected. Finally, we determine that , , and are a good set of descriptors.
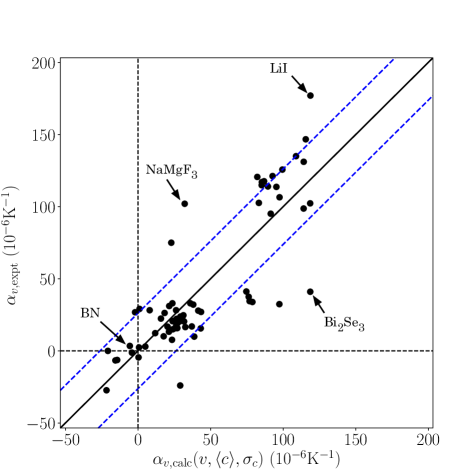
To discover the relationships between these descriptors and the experimentally-measured values of , we performed a second-order polynomial fit of these three descriptors to the 71 materials in our data sample, using the relation
| (4) |
The correlation plot for this fit is displayed in Fig. 3, and the coefficients are listed in Table 1. The correlation coefficient is 0.83, and the RMS-deviation between the fit and the data is , a noticeable improvement in correlation over the data displayed in Fig. 1, with outlying (alkali-halide) points more closely fit. Including only linear terms in the fit did not produce an acceptable interpolation. Adding cubic terms produced a substantially better fit but the trends we describe below are unchanged by the additional terms. Points to the right of the diagonal are ones for which the model predicts thermal expansion greater than the experimentally measured value. The previously noted deviation in BN has been nearly eliminated. The predicted values for the ionic solids have also been increased toward their experimental values. The material with largest positive deviation () is . The largest negative deviation arises for .
| 0 | 0 | 0 | |
| 1 | 0 | 0 | |
| 0 | 1 | 0 | |
| 0 | 0 | 1 | |
| 1 | 1 | 0 | |
| 1 | 0 | 1 | |
| 0 | 1 | 1 | |
| 2 | 0 | 0 | |
| 0 | 2 | 0 | |
| 0 | 0 | 2 |
In order to visualize the model and to isolate ranges of the descriptors that characterize the CTE, we present contours of constant across the ranges of and at fixed volume ratios in Fig. 4. Superimposed on the contours are points indicating the descriptor values of data used in the fit, including volume ratios within of the value of displayed in the corresponding panel. NTE materials are indicated in Fig. 4 with red dots. As noted previously, materials with the lowest filled volume ratios are most likely to have NTE. In panels (a) and (b) in Fig. 4 we see that the NTE materials generally have and coordination deviations , the exception being LiAlSiO4, which has . In addition to open space, important contributors to NTE are low mean coordination and a distribution of local coordinations.
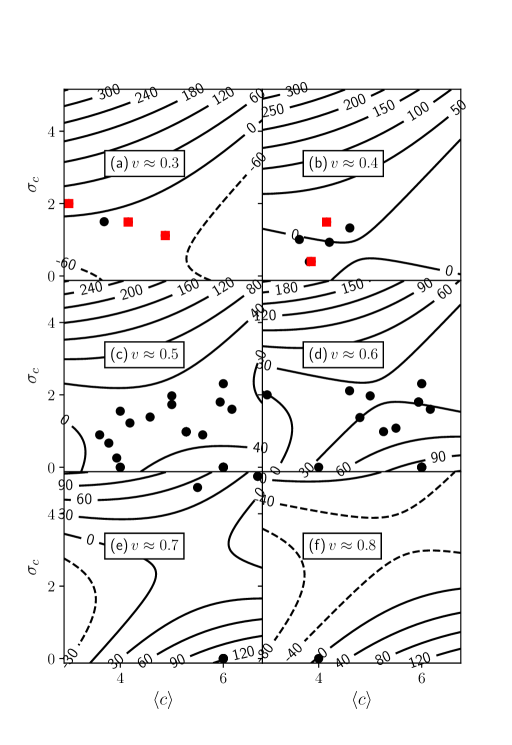
The majority of materials in this work have volume ratios around 0.5 to 0.6 and are displayed in panels (c) and (d) in Fig. 4. These materials also generally possess that would be considered typical. Mean coordinations are generally greater than that found in the NTE materials in panels (a) and (b). Many of the materials in this volume ratio neighborhood have zero coordination variance as a result of their simple structures. In particular, the ions in the rock-salt-structured alkali halides have identical coordination environments and are highly coordinated, resulting in the highest values of PTE. Most of the perovskite oxides in this study also appear in panels (c) and (d) of Fig. 4 and have greater mean coordinations but they have greater deviations in coordination, due to a structure that consists of octahedra linked by two-fold coordinated oxygen atoms. This structure leads to a greater ability for atomic motions that are transverse to the bond and, therefore, to lower values of PTE. In panels (e) and (f) of Fig. 4 the data points occupy the highest and lowest values of . A number of the samples have identical values of both and , similar to panels (c) and (d), again leading to larger PTE.
Summarizing, the trends indicate that NTE requires , , and , which is a large value in comparison to the mean coordination. With larger volume ratios, again it is observed that materials with around half the value of have the lowest thermal expansion values. These materials can typically also be modeled within the RUM Hammonds et al. (1996). Highly coordinated materials, , with zero deviation generally have strong PTE.
The CTE of is overestimated, by the present picture. While the descriptor values, , , and , would predict large PTE, the material has a layered structure, leading to more open space and to anisotropic expansion, unlike most of the materials in this work. We note that BN, which was a significant outlier in Fig. 1, is now slightly underestimated, with . A number of materials with zincblende or diamond lattice structures, such as Si, show NTE for a range of low temperatures Sparks and Swenson (1967). A relatively low resistance for B-N-B (or Si-Si-Si) bond angles to change may account for the discrepancy between the model and experiment. While the present model does not have a parameter that directly represents this particular characteristic, the mean coordination does provide some insight into it. The values of LiI and NaMgF3 are underestimated in the the present picture. These outliers include atoms from the top row of the periodic table, suggesting this as a reason for the deviations.
IV Conclusion
The thermal expansion properties of solids emerge from the dynamics of ions and the bonds that join them. While the full quantum-mechanical nature of bonding and atomic arrangement together are responsible for this, we demonstrate that significant insight into the value of the coefficient of thermal expansion at room temperature is gained by focusing on the structural aspects of a material. Descriptors based on the open space, as quantified by ionic volume and unit cell volume, mean bond coordination, and variability of local bond coordination permit estimation of the thermal expansion coefficient of a variety of materials, including ionic binary compounds, perovskites, silicates, and other oxides, using only the crystal structure of the material and the ionic radii. A higher value of the coefficient of thermal expansion is expected when a material has a high ionic volume filling ratio and single-valued local coordination, especially when the value is large. On the other hand, negative values of the thermal expansion coefficient arise in materials for which the volume filling is low and the mean local bonding coordination is small, coupled with a deviation of coordination that is large in comparison to its mean value. These descriptors not only reinforce the physical description thermal expansion but also provide guidance for the search for new materials capable of mitigating thermal expansion in devices.
*
Appendix A
Table LABEL:table:alldata lists the sources of structures and CTE used in this work. The measurements are taken from available room-temperature data.
| Material | COD | ICSD | |||||
|---|---|---|---|---|---|---|---|
| Kumar (1959) | |||||||
| Kumar (1959) | |||||||
| Fei (1995) | |||||||
| Slack and Bartram (1975) | |||||||
| Fei (1995) | |||||||
| Fei (1995) | |||||||
| Fei (1995) | |||||||
| Fei (1995) | |||||||
| Woodcock et al. (1999) | |||||||
| Slack and Bartram (1975) | |||||||
| Achary and Tyagi (2004) | |||||||
| Fei (1995) | |||||||
| Slack and Bartram (1975) | |||||||
| Fei (1995) | |||||||
| Megaw (1971) | |||||||
| Chen et al. (2011) | |||||||
| Fei (1995) | |||||||
| Megaw (1971) | |||||||
| Kumar (1959) | |||||||
| Isaak et al. (1992) | |||||||
| Fei (1995) | |||||||
| Fei (1995) | |||||||
| Fei (1995) | |||||||
| Fei (1995) | |||||||
| Fei (1995) | |||||||
| Fei (1995) | |||||||
| Iwanaga et al. (2000) | |||||||
| Stevens et al. (2004) | |||||||
| Fei (1995) | |||||||
| Pathak et al. (1973) | |||||||
| Kumar (1959) | |||||||
| Rapp and Merchant (1973) | |||||||
| Pathak and Pandya (1975) | |||||||
| Megaw (1971) | |||||||
| Fei (1995) | |||||||
| Fei (1995) | |||||||
| Rapp and Merchant (1973) | |||||||
| Rapp and Merchant (1973) | |||||||
| Pathak and Vasavada (1972) | |||||||
| Kumar (1959) | |||||||
| Megaw (1971) | |||||||
| Fei (1995) | |||||||
| Fei (1995) | |||||||
| Suzuki (1975) | |||||||
| Fei (1995) | |||||||
| Fei (1995) | |||||||
| Tyagi et al. (2002) | |||||||
| Fei (1995) | |||||||
| Fei (1995) | |||||||
| Rapp and Merchant (1973) | |||||||
| Pathak and Vasavada (1970) | |||||||
| Fei (1995) | |||||||
| Pathak et al. (1973) | |||||||
| Rapp and Merchant (1973) | |||||||
| Megaw (1971) | |||||||
| Megaw (1971) | |||||||
| Chatterji et al. (2009) | |||||||
| Pathak et al. (1973) | |||||||
| Srivastava and Merchant (1973) | |||||||
| Pathak and Pandya (1975) | |||||||
| Fei (1995) | |||||||
| Greve et al. (2010) | |||||||
| Evans et al. (1997) | |||||||
| Evans et al. (1997) | |||||||
| Kumar (1959) | |||||||
| de Ligny and Richet (1996) | |||||||
| de Ligny and Richet (1996) | |||||||
| Megaw (1971) | |||||||
| Fei (1995) | |||||||
| Fei (1995) | |||||||
| Evans et al. (1996) |
Acknowledgements.
This work has been supported by the Department of Energy Office of Basic Energy Sciences, under grant number DE-FG02-07ER46431. A.M.R. acknowledges support from the Office of Naval Research under grant number N00014-17-1-2574. Computational support was provided by the National Energy Research Scientific Computing Center (NERSC).References
- Lind (2012) C. Lind, Materials 5, 1125 (2012).
- Chen et al. (2015) J. Chen, L. Hu, J. Deng, and X. Xing, Chem. Soc. Rev. 44, 3522 (2015).
- Mary et al. (1996) T. A. Mary, J. S. O. Evans, T. Vogt, and A. W. Sleight, Science 272, 90 (1996), http://www.sciencemag.org/content/272/5258/90.full.pdf .
- Pryde et al. (1996) A. K. A. Pryde, K. D. Hammonds, M. T. Dove, V. Heine, J. D. Gale, and M. C. Warren, J. Phys.: Condens. Matter 8, 10973 (1996).
- Ramirez and Kowach (1998) A. P. Ramirez and G. R. Kowach, Phys. Rev. Lett. 80, 4903 (1998).
- Ernst et al. (1998) G. Ernst, C. Broholm, G. R. Kowach, and A. P. Ramirez, Nature 396, 147 (1998).
- Mittal and Chaplot (1999) R. Mittal and S. L. Chaplot, Phys. Rev. B 60, 7234 (1999).
- Mittal et al. (2001) R. Mittal, S. L. Chaplot, H. Schober, and T. A. Mary, Phys. Rev. Lett. 86, 4692 (2001).
- Cao et al. (2002) D. Cao, F. Bridges, G. R. Kowach, and A. P. Ramirez, Phys. Rev. Lett. 89, 215902 (2002).
- Cao et al. (2003) D. Cao, F. Bridges, G. R. Kowach, and A. P. Ramirez, Phys. Rev. B 68, 014303 (2003).
- Hancock et al. (2004) J. N. Hancock, C. Turpen, Z. Schlesinger, G. R. Kowach, and A. P. Ramirez, Phys. Rev. Lett. 93, 225501 (2004).
- Tucker et al. (2005) M. G. Tucker, A. L. Goodwin, M. T. Dove, D. A. Keen, S. A. Wells, and J. S. O. Evans, Phys. Rev. Lett. 95, 255501 (2005).
- Gava et al. (2012) V. Gava, A. L. Martinotto, and C. A. Perottoni, Phys. Rev. Lett. 109, 195503 (2012).
- Bridges et al. (2014) F. Bridges, T. Keiber, P. Juhas, S. J. L. Billinge, L. Sutton, J. Wilde, and G. R. Kowach, Phys. Rev. Lett. 112, 045505 (2014).
- Sanson (2014) A. Sanson, Chemistry of Materials 26, 3716 (2014), http://dx.doi.org/10.1021/cm501107w .
- Gupta et al. (2014) M. K. Gupta, R. Mittal, S. L. Chaplot, and S. Rols, Journal of Applied Physics 115, 093507 (2014).
- Božin et al. (2012) E. S. Božin, T. Chatterji, and S. J. L. Billinge, Phys. Rev. B 86, 094110 (2012).
- Chatterji et al. (2009) T. Chatterji, T. C. Hansen, M. Brunelli, and P. F. Henry, Appl. Phys. Lett. 94, 241902 (2009).
- Li et al. (2011) C. W. Li, X. Tang, J. A. Muñoz, J. B. Keith, S. J. Tracy, D. L. Abernathy, and B. Fultz, Phys. Rev. Lett. 107, 195504 (2011).
- Lazar et al. (2015) P. Lazar, T. Bučko, and J. Hafner, Phys. Rev. B 92, 224302 (2015).
- Toher et al. (2014) C. Toher, J. J. Plata, O. Levy, M. de Jong, M. Asta, M. B. Nardelli, and S. Curtarolo, Phys. Rev. B 90, 174107 (2014).
- Toher et al. (2017) C. Toher, C. Oses, J. J. Plata, D. Hicks, F. Rose, O. Levy, M. de Jong, M. Asta, M. Fornari, M. Buongiorno Nardelli, and S. Curtarolo, Phys. Rev. Materials 1, 015401 (2017).
- Barrera et al. (2005) G. D. Barrera, J. A. O. Bruno, T. H. K. Barron, and N. L. Allan, Journal of Physics: Condensed Matter 17, R217 (2005).
- Dove and Fang (2016) M. T. Dove and H. Fang, Reports on Progress in Physics 79, 066503 (2016).
- Schick and Rappe (2016) J. T. Schick and A. M. Rappe, Phys. Rev. B 93, 214304 (2016).
- Bergerhoff (1987) G. Bergerhoff, Crystallographic Databases, edited by F. H. Allan, G. Bergerhoff, and R. Sievers (International Union of Crystallography, 1987).
- Belsky et al. (2002) A. Belsky, M. Hellenbrandt, V. L. Karen, and P. Luksch, Acta Crystallographica Section B 58, 364 (2002).
- Merkys et al. (2016) A. Merkys, A. Vaitkus, J. Butkus, M. Okulič-Kazarinas, V. Kairys, and S. Gražulis, Journal of Applied Crystallography 49, 292 (2016).
- Gražulis et al. (2015) S. Gražulis, A. Merkys, A. Vaitkus, and M. Okulič-Kazarinas, Journal of Applied Crystallography 48, 85 (2015).
- Gražulis et al. (2012) S. Gražulis, A. Daškevič, A. Merkys, D. Chateigner, L. Lutterotti, M. Quiros, N. R. Serebryanaya, P. Moeck, R. T. Downs, and A. Le Bail, Nucleic Acids Research 40, D420 (2012).
- Gražulis et al. (2009) S. Gražulis, D. Chateigner, R. T. Downs, A. F. T. Yokochi, M. Quirós, L. Lutterotti, E. Manakova, J. Butkus, P. Moeck, and A. Le Bail, Journal of Applied Crystallography 42, 726 (2009).
- Downs and Hall-Wallace (2003) R. T. Downs and M. Hall-Wallace, American Mineralogist 88, 247 (2003).
- Shannon (1976) R. D. Shannon, Acta Crystallographica Section A 32, 751 (1976).
- Hammonds et al. (1996) K. D. Hammonds, M. T. Dove, A. P. Giddy, V. Heine, and B. Winkler, American Mineralogist 81, 1057 (1996).
- Dove (1997) M. T. Dove, American Mineralogist 82, 213 (1997).
- Liu et al. (2011) Z.-K. Liu, Y. Wang, and S.-L. Shang, Scripta Materialia 65, 664 (2011).
- Liu et al. (2014) Z.-K. Liu, Y. Wang, and S. Shang, Scientific Reports 4, 7043 (2014).
- Sparks and Swenson (1967) P. W. Sparks and C. A. Swenson, Phys. Rev. 163, 779 (1967).
- Kumar (1959) S. Kumar, Proceedings of the National Institute of Sciences of India: Physical Sciences 25, 364 (1959).
- Fei (1995) Y. Fei, “Mineral physics & crystallography: A handbook of physical constants,” (American Geophysical Union, 1995) Chap. 2-4.
- Slack and Bartram (1975) G. A. Slack and S. F. Bartram, Journal of Applied Physics 46, 89 (1975).
- Woodcock et al. (1999) D. A. Woodcock, P. Lightfoot, L. A. Villaescusa, M.-J. Díaz-Cabañas, M. A. Camblor, and D. Engberg, Chemistry of Materials 11, 2508 (1999).
- Achary and Tyagi (2004) S. Achary and A. Tyagi, Journal of Solid State Chemistry 177, 3918 (2004).
- Megaw (1971) H. D. Megaw, Materials Research Bulletin 6, 1007 (1971).
- Chen et al. (2011) X. Chen, H. D. Zhou, A. Kiswandhi, I. Miotkowski, Y. P. Chen, P. A. Sharma, A. L. Lima Sharma, M. A. Hekmaty, D. Smirnov, and Z. Jiang, Applied Physics Letters 99, 261912 (2011).
- Isaak et al. (1992) D. G. Isaak, O. L. Anderson, and H. Oda, Physics and Chemistry of Minerals 19, 106 (1992).
- Iwanaga et al. (2000) H. Iwanaga, A. Kunishige, and S. Takeuchi, Journal of Materials Science 35, 2451 (2000).
- Stevens et al. (2004) R. Stevens, B. F. Woodfield, J. Boerio-Goates, and M. K. Crawford, The Journal of Chemical Thermodynamics 36, 349 (2004).
- Pathak et al. (1973) P. Pathak, J. Trivedi, and N. Vasavada, Acta Crystallographica Section A 29, 477 (1973), cited By.
- Rapp and Merchant (1973) J. E. Rapp and H. D. Merchant, Journal of Applied Physics 44, 3919 (1973).
- Pathak and Pandya (1975) P. Pathak and N. Pandya, Acta Crystallographica Section A 31, 155 (1975), cited By.
- Pathak and Vasavada (1972) P. Pathak and N. Vasavada, Acta Crystallographica Section A 28, 30 (1972), cited By.
- Suzuki (1975) I. Suzuki, Journal of Physics of the Earth 23, 145 (1975).
- Tyagi et al. (2002) A. Tyagi, S. Achary, and M. Mathews, Journal of Alloys and Compounds 339, 207 (2002).
- Pathak and Vasavada (1970) P. Pathak and N. Vasavada, Acta Crystallographica Section A 26, 655 (1970), cited By.
- Srivastava and Merchant (1973) K. Srivastava and H. Merchant, Journal of Physics and Chemistry of Solids 34, 2069 (1973).
- Greve et al. (2010) B. K. Greve, K. L. Martin, P. L. Lee, P. J. Chupas, K. W. Chapman, and A. P. Wilkinson, Journal of the American Chemical Society 132, 15496 (2010).
- Evans et al. (1997) J. Evans, T. Mary, and A. Sleight, Journal of Solid State Chemistry 133, 580 (1997).
- de Ligny and Richet (1996) D. de Ligny and P. Richet, Phys. Rev. B 53, 3013 (1996).
- Evans et al. (1996) J. S. O. Evans, T. A. Mary, T. Vogt, M. A. Subramanian, and A. W. Sleight, Chemistry of Materials 8, 2809 (1996), http://dx.doi.org/10.1021/cm9602959 .