Reactive immunization on complex networks
Abstract
Epidemic spreading on complex networks depends on the topological structure as well as on the dynamical properties of the infection itself. Generally speaking, highly connected individuals play the role of hubs and are crucial to channel information across the network. On the other hand, static topological quantities measuring the connectivity structure are independent on the dynamical mechanisms of the infection. A natural question is therefore how to improve the topological analysis by some kind of dynamical information that may be extracted from the ongoing infection itself. In this spirit, we propose a novel vaccination scheme that exploits information from the details of the infection pattern at the moment when the vaccination strategy is applied. Numerical simulations of the infection process show that the proposed immunization strategy is effective and robust on a wide class of complex networks.
PACS number(s): 89.75.-k, 87.23.Ge, 87.10.Rt
1 Introduction
Epidemic diffusion on complex networks newman2003structure ; pastor2014epidemic ; boccaletti2006complex is a general paradigm to describe a large variety of real world outbreaks of infections, ranging from the strictly biological case to malware diffusion as well as opinion propagation bornholdt2006handbook . A central issue is the design of efficient immunization strategies able to prevent or control the epidemic spreading pastor2014epidemic . In this context, numerical simulations are a flexible and well-controlled framework to study epidemic dynamics. In particular, they allow to understand the effectiveness of vaccination strategies that we shall broadly classify as preventive vs. reactive schemes. Preventive immunization strategies aim to strengthen the network against epidemics using information about the healthy configuration, i.e. identifying the nodes to be immunized according to some score before the epidemic event. The score may require local or global knowledge about the network topological structure. An important example of the preventive approach is the Targeted Immunization scheme (TI) pastor2002immunization (see also chen2008finding ; hebert2013global ; yan2015global ), originally designed for scale-free networks. The idea is to target nodes with high connectivity degree because they act as hubs in the infection spreading. A similar degree-based approach, but exploiting only local information, is the Acquaintance Immunization (AI) cohen2003efficient . Some variations and improvements are discussed in stauffer2006dissemination ; hu2012immunization .
Instead, reactive immunization strategies start with the network undergoing a propagating infection and take into account dynamical aspects of the network and of the epidemic itself to identify which are the best sites to be vaccinated. Several scores have been designed considering, for instance, personal awareness about the epidemics ruan2012epidemic , message-passing interactions altarelli2014containing , dynamical reaction of the networks liu2014controlling ; perra2012activity , information from previous infections yan2014dynamical , finite time for the vaccination to become effective pereira2015control , etc. A remarkably simple example of reactive protocols is the so-called High-Risk Immunization (HRI) nian2010efficient , where the healthy neighbors of infected nodes are vaccinated.
In this paper, we propose a modification of TI scheme which exploits a refined score based on a local-global mixed strategy. Specifically, it introduces a modified score that is designed to consider both hubs and individuals at risk of contagion as relevant in the epidemic spreading. In other words, we attempt to use the infection itself as a source of information and as a probe of how the network reacts to the disease. On a regular network the infection may display a well defined propagating front, then, a good strategy is to vaccinate in a neighborhood of it. It is not clear whether this strategy makes sense on a complex network and we precisely try to answer this question. The effectiveness of our strategy is tested by a Monte Carlo implementation of the SIR model kermack1927contribution ; may1979population on a variety of complex theoretical and real networks and systematically comparing our proposal with some standard immunization strategies pastor2002immunization ; cohen2003efficient ; nian2010efficient .
2 Epidemics modeling and reactive immunizations: a new score
The SIR model is a simple compartmental model of disease spreading kermack1927contribution . Individuals are divided in three classes: susceptible (), infected () and recovered (). The epidemic evolution is then modeled by the transitions and . In more details, it starts with a single (patient zero) infected node. Then, at each step of the Monte Carlo process, a randomly chosen infected individual can recover with probability . Otherwise, one of its first neighbors is randomly selected and, if susceptible, gets infected. The reactive immunization takes place when a fraction (the epidemic threshold) of the population is infected.111Due to the stochastic nature of the process, epidemic may die out before reaching the threshold and immunization does not take place in these cases. The relation between the quantities and is , where is the probability that the infection reaches the threshold (which of course depends on the network and the threshold itself). We choose to take into account these events because they give an information about the exposure of a given network to a pandemic outbreak without vaccination. Given the value of , the non-spreading events are relatively rare, for example for a BA[2] the probability to reach the lower threshold is roughly 90%. The vaccination is a single-step process in which a fraction of susceptibles individuals is immunized according to some score. The finite size of the network ensures that the system always reaches a steady final state without infected individuals. The density of recovered individuals in this state is clearly related to the spreading strength of the epidemic on the network. A good immunization strategy would therefore reduce the final density at the cost of a relatively low vaccinated density . The average values and are computed by repeating the SIR evolution with vaccination a large number of times.
We propose a novel strategy of vaccination which interpolates between preventive and reactive immunizations. In doing so, we take into account both static information (like the network geometry) and dynamical information (like the pattern of a specific infection). To this aim, we consider the score
| (1) |
where denotes the set of neighbors of the -th node, its degree (i.e. the number of links pointing to it), and are the Kronecker deltas which select only infected or suspectible neighbors and are free parameters. We call our proposal Locally-Modified Targeted Immunization (LMTIβ,γ). For , the score reduces to that of Targeted Immunization pastor2002immunization . The -term in the r.h.s. of (1) favors the immunization of individuals near the epidemic front. The damping factor selects neighbors with lower connectivity, which constitute bottlenecks for the epidemic diffusion. It is therefore possible to reduce the contagion by cutting them off. The -term is a further improvement involving the so-called leverage centrality joyce2010new restricted to the susceptible neighbors. It measures the reciprocal influence of the -th node and its neighbors in the epidemic diffusion. In fact, leverage centrality is a natural metric quantifying the local influence of a node on its neighbors and therefore it gives complementary local information with respect to the common (local) clustering coefficient.
We test the effectiveness of the score (1) against the following benchmark immunization strategies
-
•
Targeted Immunization (TI). Our implementation of TI follows the original idea: nodes are vaccinated according to their degree. The only modification is that the immunization is performed as a reactive process when the epidemic reaches the threshold . Only nodes yet susceptible at the vaccination time are protected.
-
•
Acquaintance Immunization (AI). As in the previous case, AC immunization cohen2003efficient is implemented as a reactive process. The choice of the nodes to be vaccinated follows the original proposal. Random first neighbors of randomly selected nodes are vaccinated (if susceptible) according to the desired immunized fraction .
-
•
High Risk Immunization (HRI). Our implementation retains the idea of nian2010efficient to vaccinate neighbors of infected nodes, but the process is instantaneous and permanent. We test this strategy by immunizing up to the of the first neighbors of the infected nodes at the vaccination time.
3 Benchmark complex networks
We test the effectiveness of our protocol on a variety of networks ranging from theoretical models to a selection of real networks. In the first class, we consider the classical examples of Barabàsi-Albert (BA) and Watts-Strogatz (WS) models. The first one is the prototype of scale-free networks albert2002statistical ; bornholdt2006handbook and it is based on a growth algorithm with preferential attachment. We denote with BA[] the network built adding new links at each step of the algorithm. The second one is the prototype of small-world networks albert2002statistical ; bornholdt2006handbook ; j1998collective . WS graphs are built starting from regular ones with nodes (each one connected to consecutive sites) and then rewiring the links with probability . Here, we consider WS[] networks with and , .
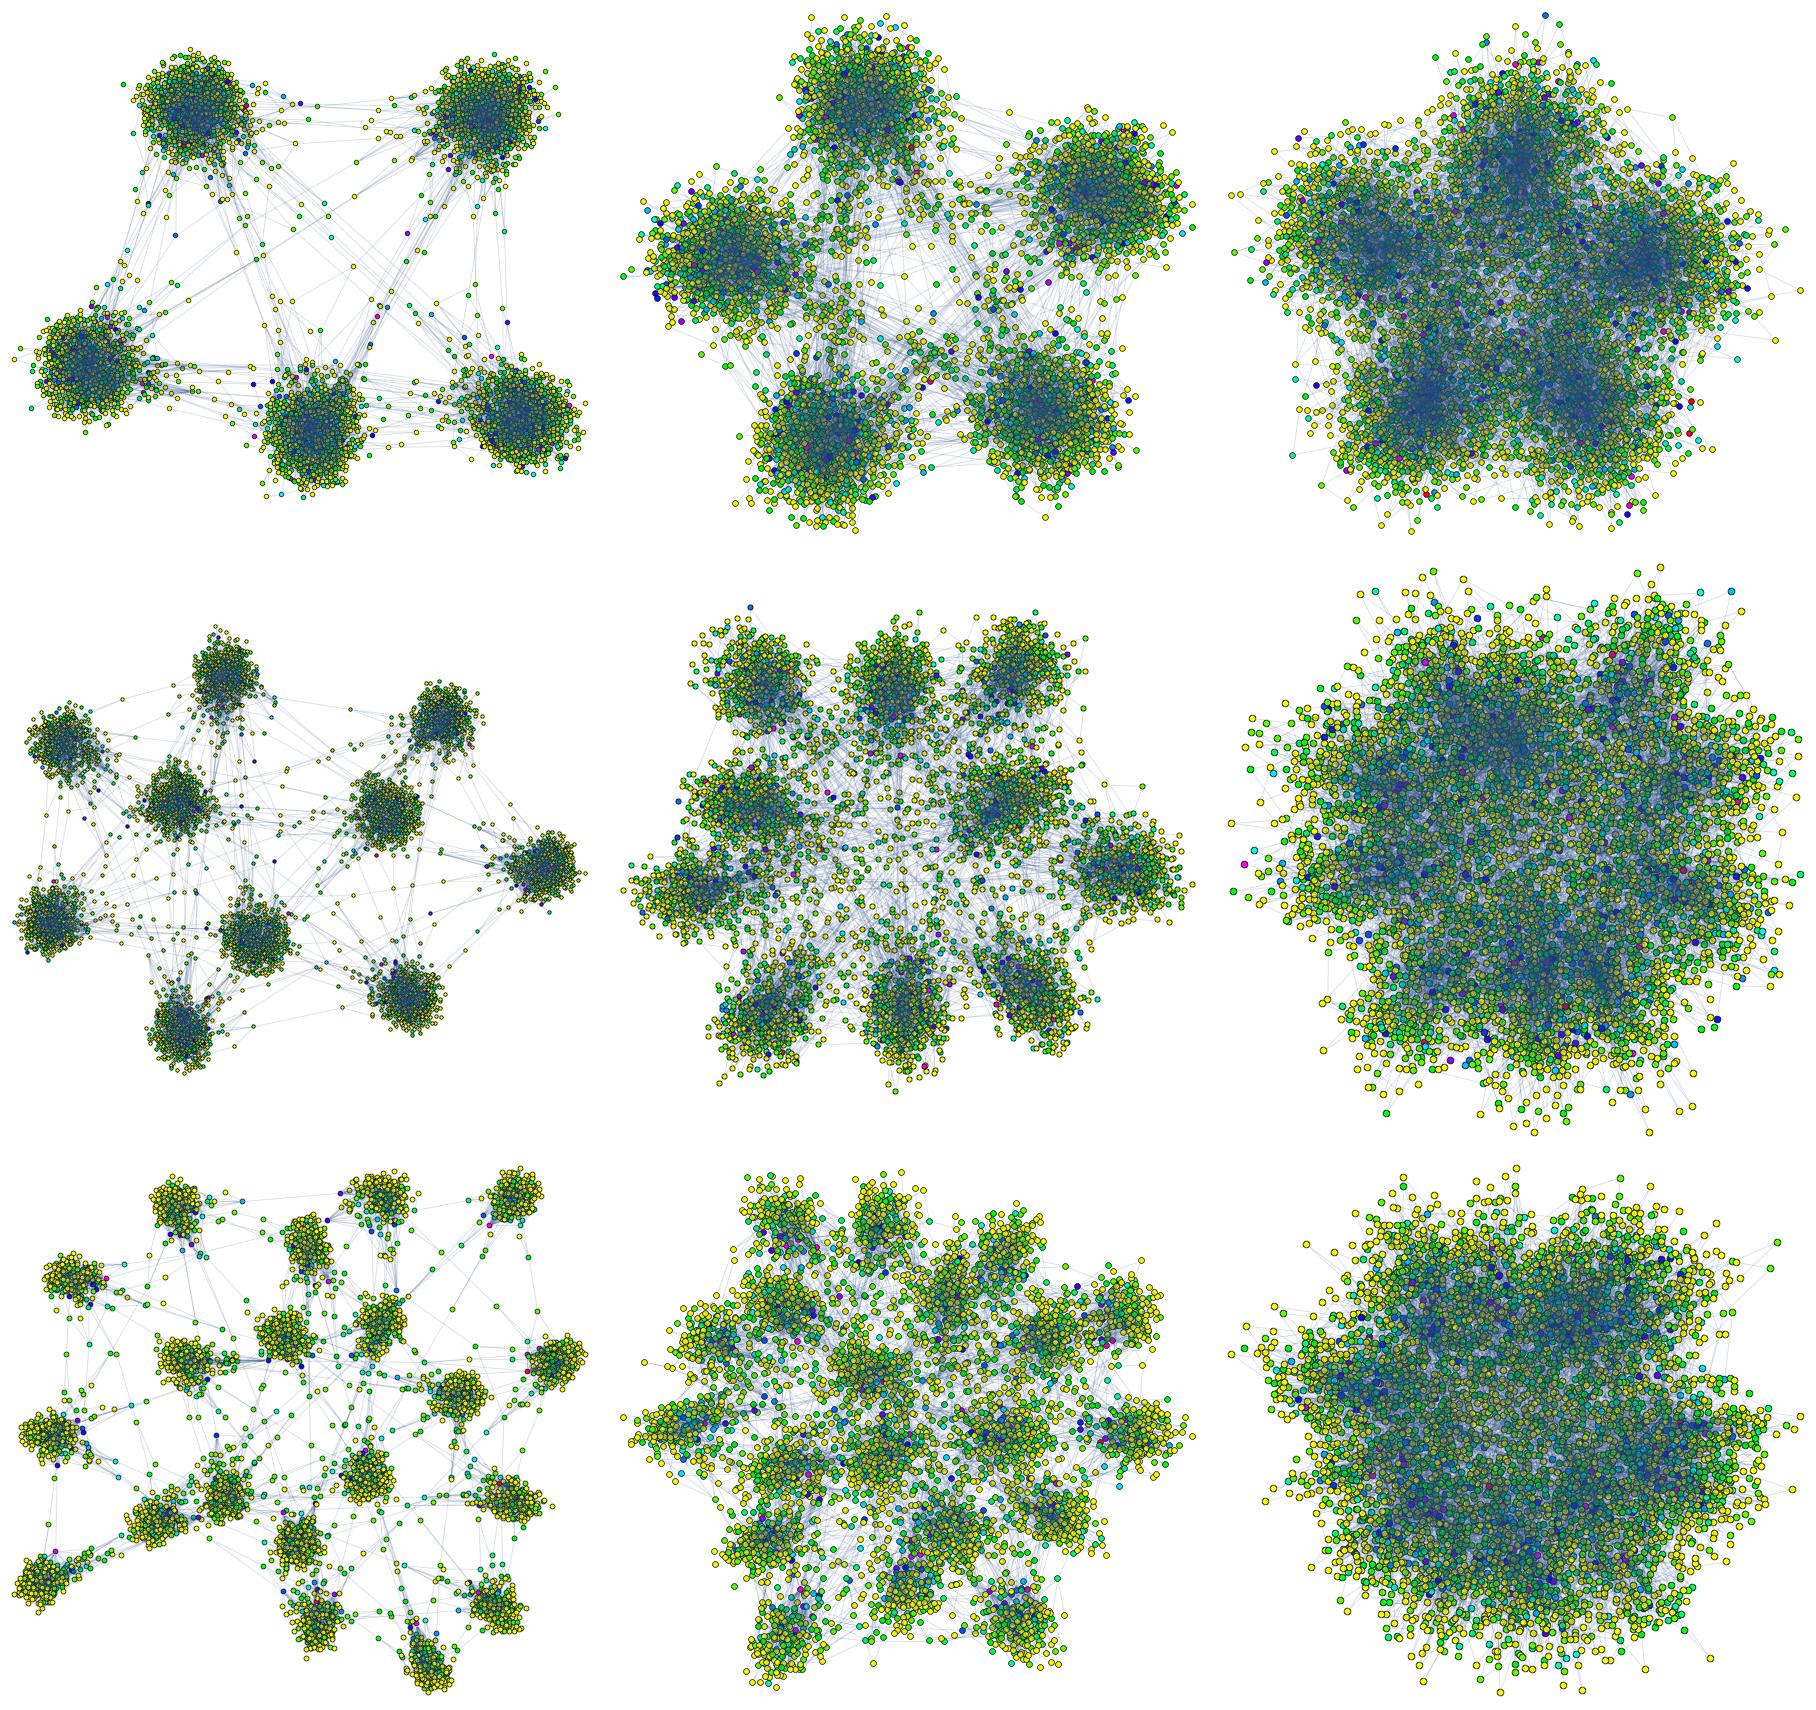
We also propose two modifications of BA model. The first one is based on a partial randomization procedure. We start with a standard BA[] network with nodes, then we randomly rewire links. In our tests, we consider , and . The second variant is realized starting with disconnected BA[2] centers, further connected adding random links between nodes belonging to different BAs. Here, we consider a starting network with nodes, equally distributed in initial clusters, and . This variant can be thought as a toy model for the epidemic spreading in clustered communities with relatively loose links. Some examples of the resulting networks are shown in Fig. 1.
Besides these theoretical models, we also consider the epidemic spreading in the following real networks:
-
1.
Internet_AS, 11174 nodes, 23408 links. It describes the undirected unweighted Internet Network222https://sites.google.com/site/cxnets/research222 colizza2006detecting at the Autonomous System level. The data were collected by the Oregon Route Views Project http://www.routeviews.org/ in May 2001. Nodes represent Internet service providers and edges connections among them.
-
2.
AA, 1057 nodes, 2502 links. It describes the interactions between the metabolites of E. coli in the course of the metabolic cycle333http://www3.nd.edu/~networks/resources/metabolic/ jeong2000large . We consider the AA case.
-
3.
CA-HepTh-pruned, 8638 nodes, 24836 links. The Arxiv HEP-TH (High Energy Physics - Theory) collaboration network444http://snap.stanford.edu/data/ca-HepTh.html from the e-print arXiv. A paper generates a completely connected subgraph in which nodes represent its authors.
-
4.
p2p-Gnutella08, 6300 nodes, 20776 links. It is a sequence of snapshots of the Gnutella peer-to-peer file sharing network from August 2002.555http://snap.stanford.edu/data/p2p-Gnutella08.html Nodes represent hosts in the Gnutella network and edges are connections among them.
-
5.
ProteinYeast, 1870 nodes, 2350 links. It is the Protein Interaction Network666http://www3.nd.edu/~networks/resources/protein/bo.dat.gz jeong2001lethality .
To provide some additional informations, in Tab. 1 we report the global clustering coefficients and mean distances among the nodes for the above real networks, and a comparison with the same quantities computed for random networks.
For BA and WS models, we consider different realizations for each network and perform Monte Carlo runs with different initial conditions for each of them. For the BA variants, we consider different realizations of each graph and average runs for each one. Finally, for real networks the statistics varies from and runs, depending on their size. With such a choice, we keep the statistical error on the final recovered density under control (for instance, it is of the order of 0.1% in theoretical models).777Statistical fluctuations are mainly determined by the simulation length, i.e. by the number of MC steps, while the dependence on the particular network realization is rather weak due to self-averaging. In all cases, we fix the recovering probability to and consider two epidemic thresholds or .888By comparison, in a regular square lattice the epidemic threshold is sirtome , so would be in the spreading phase. In this work, our main goal is a comparison of the relative effectiveness of the various vaccination strategies. A change in will surely affect the final balance of the epidemic, but, from the point of view of the comparison of the strategies, the dependence on is not crucial. Provided that is low enough to give a spreading epidemic, a change of the value of the recovering probability results in an overall shift of all the curves, but does not change the relative performances.
4 Results
In this section, we report the main results of our Monte Carlo simulations. In particular, we compare the various immunization strategies according to their ability in reducing the epidemic prevalence by and (the horizontal dotted lines in the plots) and in reaching the epidemic threshold (red solid line in the plots).
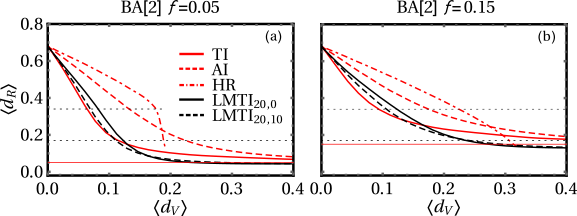
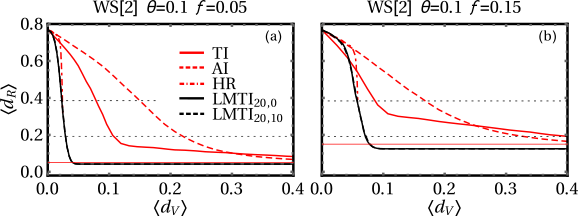
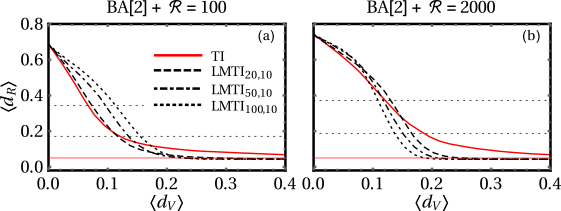
Fig. 2 collects the results for BA[2] for the two different epidemic thresholds. As it can be expected, degree-based schemes are the most efficient in the pure BA setting. In particular, TI is the best choice in reducing the epidemic prevalence by . Our strategy (with the optimal choice and ) performs very similarly at low for both values of the epidemic threshold. However, if we want to reduce the prevalence to the , a fast response to the outbreak is crucial, i.e. . In this case, TI and LMTI are the most indicated strategies as they requires a vaccinated fraction around . Moreover, LMTI can further reduce the epidemic prevalence for lower than TI. On the other side, a late reaction to the epidemic () causes the difficulty in controlling the spreading, so a massive vaccination process is needed. In fact, LMTI (which is the best choice in this eventuality) requires the vaccination of at least the of the entire population. Instead, TI fails for . A similar behaviour holds also in the BA[3] case, so we cease to give more details on this.
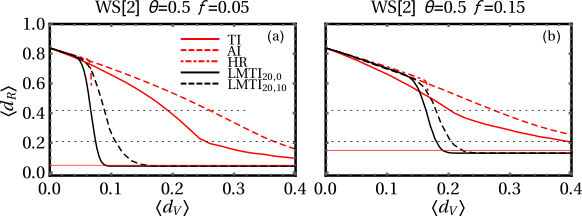
In the WS setting, results are radically different, see Fig. 3 for the WS[2] and case. Here, TI immunization is a poor strategy when compared to LMTI and HRI. This is a consequence of the absence of nodes acting as hubs for the epidemic spreading. However, both LMTI and HRI allow to reduce the prevalence by for a very small number of vaccinations ( for both values of the epidemic threshold). Most remarkably, our strategy can reduce it to for both values of the epidemic threshold with a vaccinated fraction lower than of the entire population (for comparison, AI has the same effect for ). Therefore, a prompt reaction has the only effect of lowering the vaccination coverage needed to reach the aim. WS networks with different and present analogous features, with the only difference that HRI dramatically worsens as the rewiring probability increases, see Fig. 4. In both BA and WS cases, our strategy allows to reach the epidemic threshold and to effectively stop the epidemic.
The importance of local terms in (1) can be better appreciated in the BA variants. Figs. 5 and 6 collects the results for these models with the epidemic threshold . In this case, we compare only TI and LMTI, the best performers in the original BA setting.
For partially randomized BA[2] with , the network keeps an approximate BA structure, so the results are very similar to the pure case. As the randomization increases, TI gradually becomes inefficient (except for small values), so it is convenient to vaccinate nodes near the epidemic front. This is clear in the case.
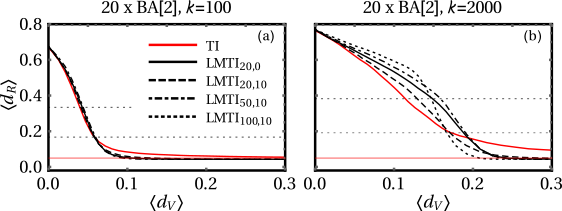
Now, we consider randomly connected BAs with an highly clustered structure (). If these clusters are poorly connected (), TI and LMTI gives approximately the same performances, with the only difference that our scheme allows to stop the epidemic with a much smaller vaccinated fraction () than TI. For a much larger number of connections between the clusters (), the situation radically changes. In fact, the reduction of the prevalence by is better accomplished with TI scheme. For LMTI, the increase of local terms importance worsens the efficiency at low , but drastically improves the performance for a larger number of vaccinations.
This behaviour has a simple explanation. When the networks or their clusters have an approximately BA structure, nodes acting as hubs are still present. Therefore, in this case it is convenient to vaccinated nodes with higher degree. As the original structure is lost (increasing the randomization or the number of new links between the original clusters), the importance of hubs in the epidemic spreading is drastically downsized. Once that highest degree nodes are immunized, it is better to give much more importance to individuals near the epidemic front. This also explains the faster decaying of LMTI curves for increasing values.
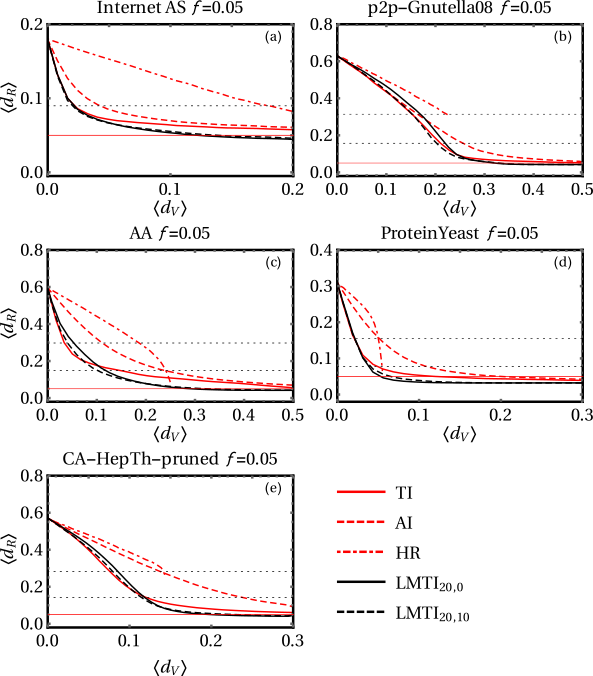
Finally, in Fig. 7 we report the results for real networks. In order to halve the epidemic prevalence, we note again that TI and LMTI are the most indicated strategies and their performances are almost equivalent. In particular, TI performs slightly better only in CA-HepTh-pruned and AA. However, if we want to further reduce the epidemic prevalence up to , LMTI is always the best choice. Moreover, it allows to effectively stop the epidemics for a smaller vaccinated fraction than TI. Remarkably, HRI is a rather inefficient choice also in ProteinYeast and Internet_AS networks, which show a great structural resistance to the epidemics (even without any vaccination, the average size of an infection is relatively small). When compared to HRI, AI seems to be stronger, but it is comparable in efficiency to TI and LMTI only in p2p-Gnutella08, in which it is more difficult to control the epidemic spreading (without immunization, the average size of an infection is about the of the entire population). This feature can be explained noting that this network is highly and uniformly connected as it presents the highest mean degree and lowest mean vertex eccentricity.
| CA-HepTh-pruned | 0.28 | 5.9 | 0.0007 | 5.4 |
|---|---|---|---|---|
| p2p-Gnutella08 | 0.020 | 4.6 | 0.0010 | 4.8 |
| AA | 0. | 4.4 | 0.0044 | 4.6 |
| Internet_AS | 0.0096 | 3.6 | 0.00039 | 6.6 |
| ProteinYeast | 0.079 | 6.8 | 0.0017 | 6.4 |
5 Conclusions
In this work, we have proposed a new reactive immunization strategy based on a local modification of the Targeted Immunization protocol. The aim of the local term is to actively take into account the presence of the epidemic outbreak and design the reactive vaccination by exploiting the infection itself as a probe of the complex network. Our proposal fits in the framework of commonly very appreciated techniques using local knowledge about complex systems, see for instance the Hebbian learning rule citeulike:500649 for an exemplary model for neural networks and 0295-5075-94-1-10002 for a detailed analysis. By means of explicit simulations we have compared our immunization scheme with other immunization strategies. We have shown that our protocol is a very efficient choice in all the considered cases, allowing to stop the epidemic with a relatively small vaccinated fraction. The addition of a local term sensing the infection was motivated by a naive picture of the infection diffusion valid for a regular network. Nevertheless, it is relevant also on a broad set of complex network totally far from being regular. We did not find a way to predict a priori the best choice for the parameters of our score. In a purely phenomenological approach, the best free parameters are chosen empirically by looking at the performance of our scheme as and are changed. Hopefully, a deeper investigation or the application of our score in simpler models could help to settle this issue.999Since the output of the score is an ordering of the nodes which gives the priority for the immunization, the result turns out to be robust with respect small changes of the two free parameters.
Several extensions of our work can be foreseen. On the theoretical side, one can explore other classes of ideal networks with good theoretical control, like weighted or directed graphs. From the point of view of applications, it could be important to apply our scheme to actual specific diseases, e.g. Xylella fastidiosa, TBC and Ebola outbreaks. This will require a more realistic propagation model like the delayed SIR considered in agliari2013application , and a detailed cost benefit analysis taking into account the finite resources available for a real vaccination programme, see for instance doi:10.1142/S0217984915501808 . Finally, we remark that our immunization scheme is clearly information-demanding, as it requires the full knowledge of the neighborhood of each node and the pattern of the epidemic at the vaccination time. This is rather unlikely in real situations and another natural evolution of the present work would be the study of an immunization strategy accounting the possibility of partial or corrupted information about the system.
References
- (1) M. E. Newman, The structure and function of complex networks, SIAM review 45 (2003), no. 2 167–256.
- (2) R. Pastor-Satorras, C. Castellano, P. Van Mieghem, and A. Vespignani, Epidemic processes in complex networks, Rev. Mod. Phys. 87 (2015) 925.
- (3) S. Boccaletti, V. Latora, Y. Moreno, M. Chavez, and D.-U. Hwang, Complex networks: Structure and dynamics, Physics reports 424 (2006), no. 4 175–308.
- (4) S. Bornholdt and H. G. Schuster, Handbook of graphs and networks: from the genome to the internet. John Wiley & Sons, 2006.
- (5) R. Pastor-Satorras and A. Vespignani, Immunization of complex networks, Physical Review E 65 (2002), no. 3 036104.
- (6) Y. Chen, G. Paul, S. Havlin, F. Liljeros, and H. E. Stanley, Finding a better immunization strategy, Physical review letters 101 (2008), no. 5 058701.
- (7) L. Hébert-Dufresne, A. Allard, J.-G. Young, and L. J. Dubé, Global efficiency of local immunization on complex networks, Scientific reports 3 (2013).
- (8) S. Yan, S. Tang, W. Fang, S. Pei, and Z. Zheng, Global and local targeted immunization in networks with community structure, Journal of Statistical Mechanics: Theory and Experiment 2015 (2015), no. 8 P08010.
- (9) R. Cohen, S. Havlin, and D. Ben-Avraham, Efficient immunization strategies for computer networks and populations, Physical review letters 91 (2003), no. 24 247901.
- (10) A. O. Stauffer and V. C. Barbosa, Dissemination strategy for immunizing scale-free networks, Physical Review E 74 (2006), no. 5 056105.
- (11) K. Hu and Y. Tang, Immunization for complex network based on the effective degree of vertex, International Journal of Modern Physics B 26 (2012), no. 06 1250052.
- (12) Z. Ruan, M. Tang, and Z. Liu, Epidemic spreading with information-driven vaccination, Physical Review E 86 (2012), no. 3 036117.
- (13) F. Altarelli, A. Braunstein, L. Dall’Asta, J. R. Wakeling, and R. Zecchina, Containing epidemic outbreaks by message-passing techniques, Physical Review X 4 (2014), no. 2 021024.
- (14) S. Liu, N. Perra, M. Karsai, and A. Vespignani, Controlling contagion processes in activity driven networks, Physical review letters 112 (2014), no. 11 118702.
- (15) N. Perra, B. Gonçalves, R. Pastor-Satorras, and A. Vespignani, Activity driven modeling of time varying networks, Scientific reports 2 (2012).
- (16) S. Yan, S. Tang, S. Pei, S. Jiang, and Z. Zheng, Dynamical immunization strategy for seasonal epidemics, Physical Review E 90 (2014), no. 2 022808.
- (17) T. Pereira and L.-S. Young, Control of epidemics on complex networks: Effectiveness of delayed isolation, Physical Review E 92 (2015), no. 2 022822.
- (18) F. Nian and X. Wang, Efficient immunization strategies on complex networks, Journal of theoretical biology 264 (2010), no. 1 77–83.
- (19) W. O. Kermack and A. G. McKendrick, A contribution to the mathematical theory of epidemics, in Proceedings of the Royal Society of London A: Mathematical, Physical and Engineering Sciences, vol. 115-772, pp. 700–721, The Royal Society, 1927.
- (20) R. M. May and R. M. Anderson, Population biology of infectious diseases: Part ii, Nature 280 (1979), no. 5722 455–461.
- (21) K. E. Joyce, P. J. Laurienti, J. H. Burdette, and S. Hayasaka, A new measure of centrality for brain networks, PLoS One 5 (2010), no. 8 e12200.
- (22) R. Albert and A.-L. Barabási, Statistical mechanics of complex networks, Reviews of modern physics 74 (2002), no. 1 47.
- (23) D. J. Watts and S. H. Strogatz, Collective dynamics of ‘small-world’ networks, Nature 393 (jun, 1998) 440–442.
- (24) V. Colizza, A. Flammini, M. A. Serrano, and A. Vespignani, Detecting rich-club ordering in complex networks, Nature physics 2 (2006), no. 2 110–115.
- (25) H. Jeong, B. Tombor, R. Albert, Z. N. Oltvai, and A.-L. Barabási, The large-scale organization of metabolic networks, Nature 407 (2000), no. 6804 651–654.
- (26) H. Jeong, S. P. Mason, A.-L. Barabási, and Z. N. Oltvai, Lethality and centrality in protein networks, Nature 411 (2001), no. 6833 41–42.
- (27) T. Tomé and R. M. Ziff, Critical behavior of the susceptible-infected-recovered model on a square lattice, Phys. Rev. E 82 (2010), no. 5 051921.
- (28) D. O. Hebb, The Organization of Behavior: A Neuropsychological Theory. Wiley, New York, June, 1949.
- (29) E. Agliari and A. Barra, A hebbian approach to complex-network generation, EPL (Europhysics Letters) 94 (2011), no. 1 10002.
- (30) E. Agliari, L. Asti, A. Barra, R. Scrivo, G. Valesini, and R. S. Wallis, Application of a stochastic modeling to assess the evolution of tuberculous and non-tuberculous mycobacterial infection in patients treated with tumor necrosis factor inhibitors, PloS one 8 (2013), no. 1 e55017.
- (31) M. Bellingeri, E. Agliari, and D. Cassi, Optimization strategies with resource scarcity: From immunization of networks to the traveling salesman problem, Modern Physics Letters B 29 (2015), no. 29 1550180.