First-principles molecular dynamics study of deuterium diffusion in liquid tin
Abstract
Understanding the retention of hydrogen isotopes in liquid metals, such as lithium and tin, is of great importance in designing a liquid plasma-facing component in fusion reactors. However, experimental diffusivity data of hydrogen isotopes in liquid metals are still limited or controversial. We employ first-principles molecular dynamics simulations to predict diffusion coefficients of deuterium in liquid tin at temperatures ranging from 573 to 1673 K. Our simulations indicate faster diffusion of deuterium in liquid tin than the self-diffusivity of tin. In addition, we find that the structural and dynamic properties of tin are insensitive to the inserted deuterium at temperatures and concentrations considered. We also observe that tin and deuterium do not form stable solid compounds. These predicted results from simulations enable us to have a better understanding of the retention of hydrogen isotopes in liquid tin.
Keywords: Liquid tin, diffusion coefficients, plasma-facing components, molecular dynamics.
I INTRODUCTION
Designing reactors that can generate fusion energy as a viable energy source has been a great challenge for decades. One of the challenging issues is to build plasma-facing components that survive intense particle bombardments present in the harsh environment of a fusion reactor. In this regard, solid plasma-facing materials unavoidably suffer from erosion when they are exposed to high fluxes of particles,Lipschultz et al. (2012); Pitts et al. (2013); Van Eden et al. (2014) which may also lead to performance degradation of the plasma-facing components. Recently, several experiments were conducted to study liquid metals, which own a series of attractive properties, as alternative plasma-facing materials. Coenen et al. (2014); Kaita et al. (2007); Mazzitelli et al. (2010); Majeski et al. (2013); Fiflis et al. (2014); Tritz et al. (2014); Schmitt et al. (2015); Abrams et al. (2015, 2016); Morgan et al. (2015); van Eden et al. (2016) In particular, lithium (Li) is a low-Z metal that can be tolerated in plasma and has been widely used in these recent experiments. For instance, the performance of plasma in fusion reactors has been improved by using liquid lithium. Kaita et al. (2007); Mazzitelli et al. (2010); Majeski et al. (2013); Fiflis et al. (2014); Tritz et al. (2014); Schmitt et al. (2015); Abrams et al. (2015) Moreover, recent studies found liquid lithium with inserted deuterium atoms can transform to solid lithium deuteride at high temperatures, resulting in largely suppressed sputtering yieldsAbrams et al. (2016); Chen et al. (2016a). These studies also suggested that the operating temperature of lithium as plasma-facing material can be higher than previously thought. However, a significant change of thermal properties during the liquid-to-solid phase transition is expected, which is in general difficult to predict.
In order to be easily melted and then operated as plasma-facing materials, liquid metals should have a low melting point relative to the solid counterparts. Tin has a slightly higher melting point of 505 KWeir et al. (2012) than lithium (453 K),Boehler (1983) and is emerging as an alternative liquid metal of plasma-facing material. For example, a recent experiment by van Eden et al.van Eden et al. (2016) showed that liquid tin possesses vapor-shielding effect under ion bombardments at very high temperatures, resulting in a reduced heat flux on the liquid tin surface. Liquid tin owns some substantial advantages over liquid lithium. For instance, liquid tin can sustain higher surface temperatures because of its lower vapor pressures and material losses compared to liquid lithium.Brooks (2002); Coventry et al. (2003, 2004) Moreover, the retention of hydrogen in liquid tin was found to be much smaller than that of liquid lithium.Loureiro et al. (2016) Tin also does not combust in the presence of sufficient water vapor, which is a significant advantage in terms of safety.
Hydrogen isotopes are fuels and their retention and recycling issues in an operated fusion reactor need to be thoroughly understood.Causey (2002) One of the unsolved issues is that the diffusion coefficients of hydrogen isotopes in liquid metals have not yet been well documented. Particularly, the diffusivities of hydrogen isotopes in liquid lithium are still controversial.Moriyama et al. (1992); Fukada et al. (2005) In addition, to the best of our knowledge, the diffusivity of hydrogen isotopes in liquid tin still lacks. It is difficult to obtain accurate diffusivity data in experiments, in part due to the existence of impurities in liquid samples. For instance, experiments found oxygen atoms form oxides with both lithiumFiflis et al. (2014) and tinCoventry et al. (2003) and suggested the impacts of these impurities on the properties of liquid metals cannot be ignored. Notably, the diffusivities of hydrogen isotopes in liquid metals are able to be predicted from computational simulations, and the structural and dynamic properties of liquid metals can also be obtained.
With the fast development of computational methods and resources in the last few decades, simulations have become an indispensable tool in materials science. Computational methods are well suitable to study properties of systems with or without impurities at different external conditions and provide further insights or even predict new properties in support of experiments. Recent computational works of liquid lithiumChen et al. (2013); Vella et al. (2014); Chen et al. (2015, 2016a, 2016b); Vella et al. (2017) have been proven to be reliable in explaining experiments and predicting structural and dynamic properties of liquid metals. For example, a first-principles molecular dynamics (FPMD) study Chen et al. (2016a) confirmed the suspected formation of lithium deuteride in experiments.Abrams et al. (2015, 2016) By using atomistic simulation methods based on force fields, several thousands of particles were simulated up to a few nanoseconds in order to obtain temperature-dependent vapor-liquid surface tensions and viscosities of liquid lithiumVella et al. (2014); Chen et al. (2015) and liquid tin.Vella et al. (2017)
However, force fields are in need of empirical inputs, which are generally obtained from experiments or first-principles calculations, and the prediction power of these force fields requires to be thoroughly addressed via systematic tests. To the best of our knowledge, we are not aware of any valid force fields that have been well tested for studying deuterium diffusion in liquid tin. Thus, we use first-principles quantum mechanics as a first attempt to tackle this problem. Density functional theory,Hohenberg and Kohn (1964); Kohn and Sham (1965) a widely used first-principles method based on quantum mechanics, has become a powerful tool in predicting properties of various materials. In particular, density functional theory has been validated to be accurate enough to study bulk properties of solid tin.Aguado (2003) Furthermore, molecular dynamics simulations based on the density functional theory have been proven to be suitable for studying liquid tin.Itami et al. (2003); Calderín et al. (2008) A previous FPMD study of liquid tin on a 64-atom cell showed that the computed self-diffusion coefficients of tin atoms were only about half of the experimental values,Itami et al. (2003) implying that the deviation may come from the use of a small cell.Itami et al. (2003) The result was later improved in a FPMD simulation of a larger cell consisting of 205 tin atoms, Calderín et al. (2008) where the computed diffusivity of liquid tin agrees well with experiments.
In this work, we perform FPMD simulations to study deuterium diffusion in liquid tin in a wide range of temperatures (573 to 1673 K). We begin by validating the ground-state properties solid tin phases. We then compute the radial distribution functions, static structure factors, and diffusion coefficients of liquid tin, all of which are in reasonably good agreement with experiments. Next, we study how the structures and dynamics of liquid tin change upon inserted deuterium atoms. Our simulations predict that the deuterium atoms in liquid tin diffuse faster than the self-diffusivity of tin. Additionally, we find that the diffusivity and structures of tin are insensitive to the inserted deuterium at temperatures and concentrations considered. We also observe that tin and deuterium do not form stable solid compounds. These predicted results from simulations enable us to have a better understanding of the retention of hydrogen isotopes in liquid tin. The rest of the paper is organized as follows. We introduce the computational methods in Sec. II. The results are presented and discussed in Sec. III. We draw conclusions in Sec. IV.
II Computational Methods
The FPMD simulations of tin were performed with the ABACUS (Atomic-orbital Based Ab-initio Computation at USTC) package.Li et al. (2016) ABACUS was developed for large-scale density functional theory simulations based on a set of linear combination of atomic orbitals (LCAO).Chen et al. (2010, 2011) The plane-wave (PW) basis set is an alternative choice in ABACUS. By taking the advantage of real-space locality, the LCAO basis set is more efficient for large systems when compared to the PW basis set. The recently developed systematically improvable optimized numerical atomic orbitals Chen et al. (2010, 2011) were found to be an excellent choice in describing a variety of materials.Li et al. (2016) We adopted the norm-conserving pseudopotentialsGiannozzi et al. (2009) for both tin and deuterium. The exchange-correlation functionals have different performances for solid tin. The local density approximationCeperley and Alder (1980); Perdew and Zunger (1981) was found to perform better Aguado (2003) than the generalized gradient approximationPerdew et al. (1996) for structural and elastic properties of solid tin, whereas the latter one provides more accurate binding energies. For the liquid tin, the structural and dynamical properties of liquid tin at different temperature were accurately captured by the local density approximation in previous studies.Itami et al. (2003); Calderín et al. (2008) For example, the radial distribution functions, dynamic structure factors, and diffusion coefficients were found to match reasonably well with experimental data. Therefore, we decided to use the local density approximation. The energy cutoff for plane-wave basis set was set to be 16 Ry. The radius cutoffs of numerical atomic orbitals were chosen to be 8.0 bohr. The atomic orbitals basis set of tin includes two s, two p, and one polarized (d) orbitals. We utilized two s and one polarized (p) orbitals for deuterium. A 101010 k-point mesh was adopted to sample the Brillouin zone for solid phases of tin. The Murnaghan’s equation of stateMurnaghan (1944) was employed to calculate the bulk moduli. All calculations were performed with periodic boundary conditions.
We performed the Born-Oppenheimer molecular dynamics by utilizing the canonical ensemble NVT (constant number of particles N, constant volume V, and constant temperature T) with the Nosé-Hoover thermostat.Nosé (1984); Hoover (1985) We used the Verlet algorithm and the thermostat mass was chosen to ensure the fluctuations of temperature to be within 0.5%. The gamma point was adopted in the k-point sampling of the Brillouin zone. The masses of tin and deuterium were chosen to be 118.71 and 2.014 amu, respectively. In order to ensure the accuracy of integrals performed in Newton’s equations of motion for atoms with different masses, the time step was chosen to be 1.0 fs for pure liquid tin and 0.2 fs when deuterium atoms were inserted. Two simulation cells were tested in order to validate the size effectYeh and Hummer (2004): 64- and 216-atom cells. The liquid densities of tin at different temperatures were chosen based on the experimental data in Ref. Nasch and Steinemann, 1995. The liquid tin structure was first prepared by heating the -tin structure at 1073 K for 5.0 ps. We then ran a 30 ps trajectory at each given temperature between 573 and 1673 K. Next, we randomly inserted a few deuterium atoms into these 216-atom liquid tin cells. For each system at a given temperature, the equilibrium process was run for 4 ps followed by a production trajectory for another 16 ps (80,000 steps). We ran five concentrations of deuterium at 1073 K in order to understand the concentration effect on the diffusion coefficients. Note that we did not change the cell volumes of liquid tin after deuterium atoms were inserted. The reason is that the averaged pressures on cells are only increased within 5.5 kB (20 deuterium atoms), which is close to the fluctuation of 5.0 kB observed in our MD trajectories. Thus, we do not expect the slightly increased pressures to have significant effects on the final results.
We analyze the structural and dynamic properties of liquid tin and liquid tin-deuterium systems through a few tools. The radial distribution function is calculated based on
| (1) |
where is the ionic density, is the total number of atoms, and are atomic coordinates of atoms and , respectively. Next, the partial radial distribution functionMarrocchelli et al. (2010) between two species and can be written as
| (2) |
The static structure factor has the form of
| (3) |
where is the reciprocal space vector and . The formula of diffusion coefficient is
| (4) |
where is the mean square displacement of atoms at time . In our study, less accurate statistics are obtained for deuterium than tin atoms because there are a smaller number of deuterium atoms than tin atoms in the simulations. Consequently, the mean square displacements computed for deuterium atoms are less accurate than those for tin atoms. In order to obtain trusted diffusion coefficients, we divided each tin-deuterium trajectory into five segments and calculated the final diffusion coefficient by averaging the diffusion coefficients computed from all segments. The diffusion data were shown with the standard deviation. We further adopt a decay function to compute the lifetimes of tin-deuterium bonds.Haughney et al. (1987) The decay function represents the fraction of unbroken bonds at time and is defined as
| (5) |
where is the number of bonds that break after steps. A bond would be treated as a new one if it breaks and then reforms. The mean lifetime can be then defined as
| (6) |
where is the time step.
III Results and Discussion
III.1 Solid Tin
| / | Method | |||||
| -tin | 5.780 | 0.537 | 26.15 | 0.000 | 58 | FP (PW) |
| 5.786 | 0.538 | 26.23 | 0.000 | 57 | FP (LCAO) | |
| 5.831 | 0.546 | 27.07 | - | - | EXPBarrett and Massalski (1966) | |
| 5.8119 | 0.543 | 26.65 | - | - | EXPRayne and Chandrasekhar (1960) | |
| - | - | - | - | 57.037 | EXPBook (1983) | |
| - | - | - | - | 57.9 | EXPVaidya and Kennedy (1970) | |
| -tin | 6.442 | - | 33.41 | -0.019 | 43 | FP (PW) |
| 6.445 | - | 33.47 | -0.055 | 43 | FP (LCAO) | |
| 6.483 | - | 34.05 | - | - | EXPBarrett and Massalski (1966) | |
| - | - | - | - | 42.617 | EXPBook (1983) | |
| - | - | - | - | 54 | EXPBuchenauer et al. (1971) | |
| bct | 3.933 | 0.846 | 25.73 | 0.045 | 53 | FP (PW) |
| 3.920 | 0.844 | 25.42 | 0.047 | 54 | FP (LCAO) | |
| bcc | 3.664 | 24.60 | 0.095 | 70 | FP (PW) | |
| 3.658 | 24.47 | 0.130 | 71 | FP (LCAO) |
We benchmark four phases of solid tin including -tin, -tin, body-centered tetragonal (), and body-centered cubic (). Experimentally, the -tin phase has the lowest energy, and transforms to -tin with a tetragonal crystal structure at 286.3 K and atmospheric pressure.Cohen and van Lieshout (1935) At room temperature, the -tin structure transforms to the structure at 9.5 GPaOlijnyk and Holzapfel (1984) and at approximately 45 GPa,Desgreniers et al. (1989) and the phase is stable up to 120 GPa.Desgreniers et al. (1989) Table 1 lists the first-principles results and available experimental data. We calculated several bulk properties including lattice constants, equilibrium volumes, energy orderings, and bulk moduli. Note that PW and LCAO basis sets were used in calculations and results from both basis sets agree well with each other. For instance, the ratio of (0.844) from the LCAO basis only differs within 0.3% when compared to the one (0.846) from the PW basis. Although the computed lattice constants of -tin and -tin are slightly smaller (within 0.9) than the experimental values, this level of discrepancies is expected due to the use of the local density approximationCeperley and Alder (1980); Perdew and Zunger (1981) which tends to yield stronger binding between atoms. We also find that the bulk moduli calculated from the two basis sets are all close within 1 GPa and agree well with experiments. Notably, both basis sets yield the same energy orderings among the selected four phases of solid tin: -tin is the most stable phase, followed by -tin, , and phases. However, the LCAO basis predicts a 36 meV/atom of larger energy difference between -tin and -tin than the PW basis does. The error probably comes from the incompleteness of the LCAO basis set. Although this energy difference may be important in calculating the phase transition between -tin and -tin, we demonstrate that it does not affect our simulations of liquid tin, as evidenced in the following section. Overall, we find that the first-principles calculations with the LCAO basis set well capture the bulk properties of solid tin crystals.
III.2 Liquid Tin
| (K) | Method | |||||||
|---|---|---|---|---|---|---|---|---|
| 573 | EXP | 3.169 | 2.697 | 6.241 | 1.274 | 1.97 | 0.472 | 10.7 |
| FPMD | 3.118 | 2.783 | 6.178 | 1.243 | 1.98 | 0.447 | 10.5 | |
| 773 | EXP | 3.149 | 2.527 | 6.253 | 1.217 | 1.99 | 0.482 | 10.2 |
| FPMD | 3.102 | 2.525 | 6.162 | 1.142 | 1.99 | 0.452 | 10.1 | |
| 1073 | EXP | 3.121 | 2.347 | 6.188 | 1.162 | 1.98 | 0.495 | 9.6 |
| FPMD | 3.071 | 2.320 | 6.162 | 1.091 | 2.01 | 0.470 | 9.7 | |
| 1673 | EXP | 3.099 | 2.086 | 6.354 | 1.104 | 2.05 | 0.529 | 8.6 |
| FPMD | 3.085 | 2.022 | 6.095 | 1.076 | 1.98 | 0.532 | 8.8 |
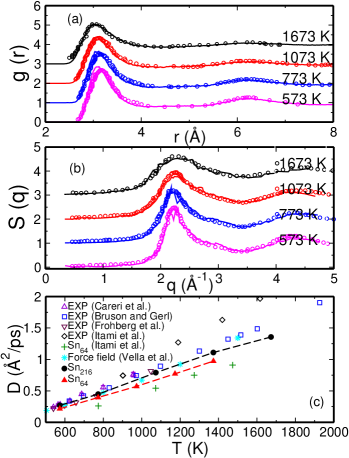
We next compare several properties of liquid tin obtained from simulations to available experiments. Figures 1(a) and (b) illustrate the radial distribution functions and static structure factors of liquid tin, respectively. The experimental data of were obtained from neutron scattering experiments.Itami et al. (2003) We show and at temperatures ranging from 573 to 1673 K except the ones at 1373 K because the experimental data were suggested to be inaccurate.Itami et al. (2003) In general, we find that the predicted shapes and positions of peaks in both and at these four temperatures match very well with the experiment data. For instance, the computed first and second peaks of and decrease with elevated temperatures, which agree with the experiment and suggest more liquid-like structures of liquid tin at higher temperatures. In order to quantitatively compare the simulation data to experiments, we list more characteristic features of radial distribution functions in Table II, which contains the positions (, ) and heights (, ) of the first and second peaks. Table II also includes the ratio () between and , the ratio () between and , and the first coordination number . The data shown in Table II agree quite well with the experiment.Itami et al. (2003) For example, the computed decreases from 10.5 (573 K) to 8.8 (1673 K), which is consistent with the experimental value that decreases from 10.7 (573 K) to 8.6 (1673 K). In addition, both and from simulations are close to the experimental data except at 1673 K. We point out that some discrepancies exist in and at 1673 K because the smooth second peak of at the temperature was difficult to be located. We also notice that both and are reasonably accurate but slightly smaller than the experimental data. These discrepancies can be attributed to the utilization of the local density approximation that overbinds atoms. Furthermore, the shoulder feature of on the high- side of the first peak (around 2.8 Å-1) is captured by our simulations, in consistent with a previous first-principles study by Itami et al.Itami et al. (2003) More detailed discussion on the shoulder feature of can be found in Ref. Itami et al., 2003. Note that there are some noisy features appear on the computed in Figure 1(b), which are due to the fact that static structure factors are more difficult to converge than the radial distribution functions.Itami et al. (2003)
Figure 1(c) illustrates the diffusion coefficients of tin in both 64- and 216-atom cells, as well as four sets of available experimental data.Careri et al. (1958); Bruson and Gerl (1980); Frohberg et al. (1986); Itami et al. (2003) The experimental data are in excellent agreement at temperatures lower than 1200 K, so our comparison is mainly discussed in this temperature range. We observe that our diffusion coefficients of tin (red) from the 64-atom cell are close to those first-principles data (green) of Itami et al.,Itami et al. (2003) albeit both are significantly smaller than the experimental values. The underestimation of the diffusion coefficients is probably due to the size effect, because the imposed periodic boundary conditions create artificial interactions between images of liquid atoms, causing large errors in small cells.Itami et al. (2003); Chen et al. (2015) As expected, the diffusion coefficients calculated from the 216-atom cell (shown in black dots) are larger than those obtained from the 64-atom cell and in better agreement with experimental data. Although the size effect is still expected in the 216-atom cell and should be clarified in future studies, we consider the cell size is a good balance between accuracy and efficiency. In this regard, we study the deuterium diffusion in liquid tin by adopting the 216-atom cell.
III.3 Deuterium in Liquid Tin
To the best of our knowledge, we cannot find any FPMD simulations of deuterium diffusion in liquid tin reported. One of the reasons is that performing first-principles simulations on cells containing hundreds of atoms at different temperatures is computationally demanding. With the aid of numerical atomic orbitals as accurate basis sets, we are able to reduce the computational cost. We first validated the basis set for hydrogen (deuterium) atoms, where calculations within the framework of density functional theory gave rise to the same structural properties including the bond length and formation energy because the mass of the nuclei did not play a role. The computed bond lengths of hydrogen dimer are 0.766 Å for PW basis set compared with 0.761 Å for LCAO basis set, which are close to the experimental length of 0.74 Å.DeKock and Gray (1989) The binding energies of hydrogen dimer are 4.85 and 4.95 eV from PW and LCAO basis sets, respectively; the computed binding energies are somehow larger than the experimental value of 4.467 eV DeKock and Gray (1989) which are consistent with the overbinding feature of local density approximation. Next, we obtained diffusivity data and structural properties of liquid Sn1-xDx by using molecular dynamics. These results include the temperature- and concentration-dependent diffusion coefficients of deuterium and tin, and the bonding status between deuterium and tin.
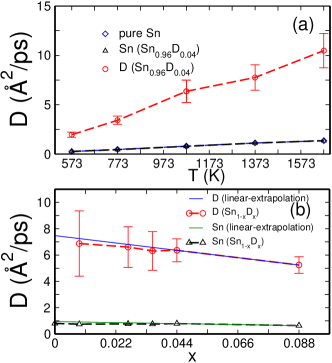
Figure 2(a) shows the diffusion coefficients of deuterium (10 atoms) in a 216-atom liquid tin cell at five temperatures ranging from 573 to 1673 K. We find that the diffusion coefficient of deuterium increases faster than that of tin as temperature increases. For instance, the diffusion coefficients of deuterium are 7.3 and 7.7 times larger than those of tin at 573 and 1673 K, respectively. In addition, we observe that the diffusion coefficients of pure liquid tin almost remain the same values even with the presence of inserted deuterium atoms at all temperatures considered, in stark contrast to the diffusion coefficients of lithium that can be significantly affected with the presence of deuterium.Chen et al. (2016a)
Figure 2(b) illustrates the impact of the concentration of deuterium on the diffusivities of both deuterium and tin atoms at 1073 K. We find that the concentrations of deuterium, varying from 8.47% (20 deuterium atoms in a 216-atom liquid tin cell) to 0.92% (2 deuterium atoms in a 216-atom liquid tin cell), have relatively smaller impacts on the diffusion coefficients of deuterium as compared to the temperature effect in our simulations. Specifically, we observe that the diffusion coefficient of deuterium increases from 5.2 to 6.9 when its concentration decreases from 8.47% to 0.92%. However, the diffusion coefficient of deuterium (concentration is 4.42%) largely increases from 2.0 to 10.5 when temperature is elevated from 573 to 1673 K as shown in Figure 2(a). Based on the temperatures (573 to 1673 K) and concentrations of deuterium (0.92% to 8.47%) considered in our simulations, we suggest that temperatures impact the diffusion coefficients of deuterium more significantly than concentrations of deuterium. We notice that the error bars of the diffusion coefficients also increase as the concentration of deuterium decreases, which can be attributed to the small samplings of deuterium atoms. Unfortunately, the high computational cost limits our further study of diffusion coefficients of deuterium at concentrations smaller than 0.92%, in which cases larger cells are needed. We also tried linear extrapolations based on the diffusion data obtained when 0.044 and 0.085, as shown in Figure 2(b). The extrapolated data for both deuterium and tin atoms are close to the values we obtained by molecular dynamics simulations, supporting the above conclusions. We further compare the diffusion coefficients of tin at different concentrations of deuterium to those of pure liquid tin, and find that different concentrations of deuterium do not affect the diffusion coefficients of tin at the same temperature. This observation further supports our previous finding that the diffusion coefficients of tin are not affected by the presence of deuterium at different temperatures considered (573 to 1673 K).
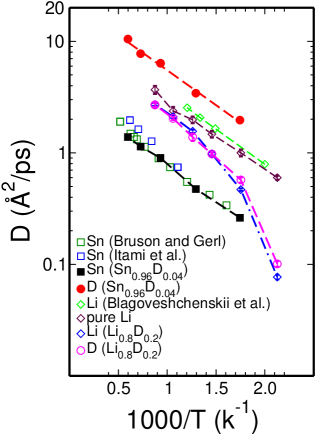
Although only limited data are available, it is informative to compare the behaviors of deuterium in liquid tin and liquid lithium at different temperatures. We summarize the diffusivity data in Figure 3 including both experimental and available first-principles simulation data. Specifically, the first-principles results of lithium and deuterium in the Li0.8D0.2 system are taken from Ref. Chen et al., 2016a, where simulations were performed in a cell containing 128 lithium and 32 deuterium atoms; data in terms of higher concentrations of deuterium in lithium are not included here, but the trend is that the diffusivities of both deuterium and lithium at a given temperature decrease as the concentration of deuterium increases. The decrease of diffusion coefficients is due to the formation of solid lithium deuteride, which has a high melting point of 9652 K.Messer and Levy (1965) However, we did not observe formation of any solid compounds in our simulated tin-deuterium systems. As shown in Figure 3 with a dashed red line, we fit the computed temperature-dependent diffusion coefficients of deuterium in Sn0.96D0.04 into an equation asMoriyama et al. (1992); Fukada et al. (2005)
| (7) |
where is the gas constant (in Jmol-1K-1) and (in K) is temperature. Besides the simulation data, we also show experimental data including lithium diffusivities from Blagoveshchenskii et al.,Blagoveshchenskii et al. (2012) and tin diffusivities from Itami et al.Itami et al. (2003) (blue squares) and Bruson and Gerl (dark green squares).Bruson and Gerl (1980) There are a few interesting observations in Figure 3. First, both diffusivities of pure lithium and tin are accurately captured by the FPMD simulations when compared to available experiments, suggesting that simulations are able to yield trustable diffusion coefficients. Second, the diffusivity of lithium in Li0.8D0.2 is smaller than that of pure lithium, and the difference becomes more significant at relatively lower temperatures. For example, the diffusion coefficients of lithium and deuterium significantly drop by about one order of magnitude from 570 to 470 K, which can be explained by the formation of strong chemical bonds between lithium and deuterium.Chen et al. (2016a) Third, we find that the diffusivity of tin is insensitive to the presence of inserted deuterium (concentration from 0.92% to 8.47%) in a wide range of temperatures (573 to 1673 K) considered here. Finally, the deuterium in liquid tin diffuses faster than both pure tin and pure lithium.
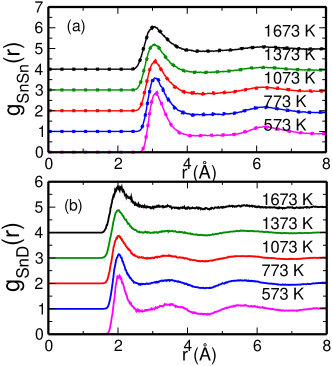
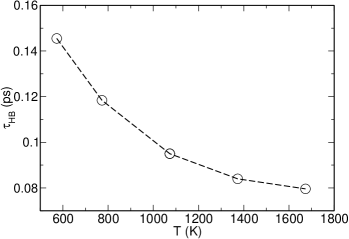
The different behaviors of deuterium predicted in liquid tin and lithium can be partially attributed to the different chemical bonding statuses between deuterium and liquid metals. In this regard, we calculated the partial radial distribution functions and performed lifetime analysis to obtain bonding information between deuterium and tin in liquid Sn0.96D0.04. Figures 4(a) and (b) show the partial radial distribution functions of tin-tin () and tin-deuterium () at five temperatures ranging from 573 to 1673 K. Two interesting features are discussed here. First, the positions and heights of the first and second peaks of (solid lines) in Figure 4(a) are almost indistinguishable to those (dotted lines) in pure liquid tin (Figure 1(a)) at each given temperature, indicating that deuterium atoms have only little impact on the liquid structure of tin atoms. Second, the position of the first peak of is predicted to be around 2.1 Å, which is shorter than that of (about 3.1 Å). This implies that deuterium atoms prefer to stay between tin and its first shell of tin neighbors. In addition, the first minimum of is at 2.6 Å and we chose it as a cutoff for lifetime analysis. Figure 5 illustrates the calculated average lifetimes (Eq. 6) of the tin-deuterium bonds at different temperatures. We can see that the lifetime of the tin-deuterium bonds monotonically decreases as temperature increases. More importantly, the largest lifetime is 0.145 ps for the tin-deuterium bond at 573 K, implying that tin and its adjacent deuterium atoms dissociate quickly. We also observe formation of a few deuterium pairs that last for 0.1 ps on average, but the pairs dissociate quickly. We do not observe formation of deuterium clusters in liquid tin with inserted deuterium.
IV Conclusions
Liquid tin is a promising candidate of liquid metal plasma-facing materials that have substantial advantages over solid materials. Therefore, the interactions between liquid tin and the fuels of a fusion reactor, i.e., hydrogen isotopes should be thoroughly understood. For example, the knowledge of retention and recycling of hydrogen isotopes in liquid metal at different temperatures should be well documented. However, the diffusion coefficients of hydrogen isotopes in liquid metals such as lithium and tin are still controversial or even lacked from experiments. Classical force fields could be an ideal tool to study deuterium diffusion in liquid tin, but such models have not yet been established.
In this regard, we have performed first-principles molecular dynamics simulations to study deuterium diffusion in liquid tin. We first tested pure liquid tin at temperatures ranging from 573 to 1673 K. The computed radial distribution functions and static structure factors match reasonably well with the experimental data. Importantly, the diffusion coefficients calculated from a 216-atom cell agree better with experiments than those from a 64-atom cell, suggesting the 216-atom cell is more suitable for studying diffusivities of liquid tin. Next, we studied liquid tin with inserted deuterium and predicted the diffusion coefficients of deuterium in liquid tin at different temperatures. We predicted several interesting results. First, we found faster diffusion of deuterium in liquid tin than the self-diffusion of tin. Second, the tin diffusivity and structures are insensitive to the inserted deuterium at temperatures and concentrations considered. Finally, tin and deuterium do not form stable tin-deuterium solid compounds in liquid Sn1-xDx. These predicted results from first-principles molecular dynamics not only gave us a better understanding of the retention of hydrogen isotopes in liquid tin, but can also be used to develop classical tin-deuterium force fields for large scale simulations.
In future, quantum-mechanics-based first-principles simulations and classical force fields can be utilized as important computational tools in understanding more fundamental properties of plasma-facing materials and their interactions with hydrogen isotopes and impurities at different environments. For example, tritium atoms can be introduced into liquid metals and their isotope effects can be studied. Moreover, it is worth examining the diffusion of hydrogen isotopes in liquid lithium-tin mixtures, which are also candidates of liquid metal plasma-facing materials.
Acknowledgment
The authors are grateful to Tyler Abrams and G. G. van Eden for providing valuable input to the manuscript. This work was funded by the Chinese National Science Foundation (Grant number 11374275), the National Key Research and Development Program of China (Grants No. 2016YFB0201202). The numerical calculations have been done on the USTC HPC facilities.
References
- Lipschultz et al. (2012) B. Lipschultz, J. Coenen, H. Barnard, N. Howard, M. Reinke, D. Whyte, and G. Wright, Nuclear Fusion 52, 123002 (2012).
- Pitts et al. (2013) R. Pitts, S. Carpentier, F. Escourbiac, T. Hirai, V. Komarov, S. Lisgo, A. Kukushkin, A. Loarte, M. Merola, A. S. Naik, et al., Journal of Nuclear Materials 438, S48 (2013).
- Van Eden et al. (2014) G. Van Eden, T. Morgan, H. Van der Meiden, J. Matejicek, T. Chraska, M. Wirtz, and G. De Temmerman, Nuclear fusion 54, 123010 (2014).
- Coenen et al. (2014) J. Coenen, G. De Temmerman, G. Federici, V. Philipps, G. Sergienko, G. Strohmayer, A. Terra, B. Unterberg, T. Wegener, and D. Van den Bekerom, Physica Scripta T159, 014037 (2014).
- Kaita et al. (2007) R. Kaita, R. Majeski, and T. Gray, Physics of Plasmas 14, 056111 (2007).
- Mazzitelli et al. (2010) G. Mazzitelli, M. Apicella, V. P. Ridolfini, G. Apruzzese, R. De Angelis, D. Frigione, E. Giovannozzi, L. Gabellieri, G. Granucci, C. Mazzotta, et al., Fusion Engineering and Design 85, 896 (2010).
- Majeski et al. (2013) R. Majeski, T. Abrams, and D. Boyle, Physics of Plasmas 20, 056103 (2013).
- Fiflis et al. (2014) P. Fiflis, A. Press, W. Xu, D. Andruczyk, D. Curreli, and D. Ruzic, Fusion Engineering and Design 89, 2827 (2014).
- Tritz et al. (2014) K. Tritz, R. E. Bell, and P. Beiersdorfer, Plasma Physics and Controlled Fusion 56, 125014 (2014).
- Schmitt et al. (2015) J. C. Schmitt, R. E. Bell, and D. P. Boyle, Physics of Plasmas 22, 056112 (2015).
- Abrams et al. (2015) T. Abrams, M. Jaworski, R. Kaita, J. Nichols, D. Stotler, G. De Temmerman, M. van den Berg, H. van der Meiden, and T. Morgan, Journal of Nuclear Materials 463, 1169 (2015).
- Abrams et al. (2016) T. Abrams, M. Jaworski, M. Chen, E. Carter, R. Kaita, D. Stotler, G. D. Temmerman, T. Morgan, M. van den Berg, and H. van der Meiden, Nucl. Fusion 56, 016022 (2016).
- Morgan et al. (2015) T. W. Morgan, D. C. M. van den Bekerom, and G. De Temmerman, Journal of Nuclear Materials 463, 1256 (2015).
- van Eden et al. (2016) G. van Eden, T. Morgan, D. Aussems, M. van den Berg, K. Bystrov, and M. van de Sanden, Phys. Rev. Lett. 116, 135002 (2016).
- Chen et al. (2016a) M. Chen, T. Abrams, and M. A. Jaworski, Nucl. Fusion 56, 016020 (2016a).
- Weir et al. (2012) S. Weir, M. Lipp, S. Falabella, G. Samudrala, and Y. Vohra, J. App. Phys. 111, 123529 (2012).
- Boehler (1983) R. Boehler, Phys. Rev. B. 27, 6754 (1983).
- Brooks (2002) J. N. Brooks, Fusion Engineering and Design 60, 515 (2002).
- Coventry et al. (2003) M. Coventry, J. Allain, and D. Ruzic, Journal of Nuclear Materials 313, 636 (2003).
- Coventry et al. (2004) M. Coventry, J. Allain, and D. Ruzic, Journal of Nuclear Materials 335, 115 (2004).
- Loureiro et al. (2016) J. Loureiro, H. Fernandes, F. Tabarés, G. Mazzitelli, C. Silva, R. Gomes, E. Alves, R. Mateus, T. Pereira, H. Figueiredo, et al., Nuclear Materials and Energy (2016).
- Causey (2002) R. A. Causey, Journal of Nuclear Materials 300, 91 (2002).
- Moriyama et al. (1992) H. Moriyama, K. Iwasaki, and Y. Ito, Journal of nuclear materials 191, 190 (1992).
- Fukada et al. (2005) S. Fukada, M. Kinoshita, K. Kuroki, and T. Muroga, Journal of nuclear materials 346, 293 (2005).
- Chen et al. (2013) M. Chen, L. Hung, and C. Huang, Molecular Physics 111, 3448 (2013).
- Vella et al. (2014) J. R. Vella, F. H. Stillinger, A. Z. Panagiotopoulos, and P. G. Debenedetti, The Journal of Physical Chemistry B 119, 8960 (2014).
- Chen et al. (2015) M. Chen, J. R. Vella, A. Z. Panagiotopoulos, P. G. Debenedetti, F. H. Stillinger, and E. A. Carter, AIChE Journal 61, 2841 (2015).
- Chen et al. (2016b) M. Chen, J. Roszell, E. V. Scoullos, C. Riplinger, B. E. Koel, and E. A. Carter, J. Phys. Chem. B 120, 6110 (2016b).
- Vella et al. (2017) J. R. Vella, M. Chen, F. H. Stillinger, E. A. Carter, P. G. Debenedetti, and A. Z. Panagiotopoulos, Phys. Rev. B 95, 064202 (2017).
- Hohenberg and Kohn (1964) P. Hohenberg and W. Kohn, Phys. Rev. 136, 864B (1964).
- Kohn and Sham (1965) W. Kohn and L. J. Sham, Phys. Rev. 140, 1133A (1965).
- Aguado (2003) A. Aguado, Phys. Rev. B 67, 212104 (2003).
- Itami et al. (2003) T. Itami, S. Munejiri, and T. Masaki, Phys. Rev. B 67, 064201 (2003).
- Calderín et al. (2008) L. Calderín, D. J. González, L. E. González, and J. M. López, The Journal of chemical physics 129, 194506 (2008).
- Li et al. (2016) P. Li, X. Liu, M. Chen, P. Lin, X. Ren, L. Lin, C. Yang, and L. He, Computational Materials Science 112, 503 (2016).
- Chen et al. (2010) M. Chen, G.-C. Guo, and L. He, J. Phys.: Condens. Matter 22, 445501 (2010).
- Chen et al. (2011) M. Chen, G.-C. Guo, and L. He, J. Phys.: Condens. Matter 23, 325501 (2011).
- Giannozzi et al. (2009) P. Giannozzi, S. Baroni, and N. Bonini, J. Phys.: Condens. Matter 21, 395502 (2009).
- Ceperley and Alder (1980) D. M. Ceperley and B. J. Alder, Phys. Rev. Lett. 45, 566 (1980).
- Perdew and Zunger (1981) J. P. Perdew and A. Zunger, Phys. Rev. B 23, 5048 (1981).
- Perdew et al. (1996) J. P. Perdew, K. Burke, and M. Ernzerhof, Phys. Rev. Lett. 77, 3865 (1996).
- Murnaghan (1944) F. Murnaghan, Proceedings of the National Academy of Sciences 30, 244 (1944).
- Nosé (1984) S. Nosé, J. Chem. Phys. 81, 511 (1984).
- Hoover (1985) W. G. Hoover, Phys. Rev. A 31, 1695 (1985).
- Yeh and Hummer (2004) I.-C. Yeh and G. Hummer, The Journal of Physical Chemistry B 108, 15873 (2004).
- Nasch and Steinemann (1995) P. Nasch and S. Steinemann, Physics and Chemistry of Liquids 29, 43 (1995).
- Marrocchelli et al. (2010) D. Marrocchelli, M. Salanne, and P. A. Madden, J. Phys.: Condens. Matter 22, 152102 (2010).
- Haughney et al. (1987) M. Haughney, M. Ferrario, and I. R. McDonald, J. Phys. Chem. 91, 4934 (1987).
- Barrett and Massalski (1966) C. S. Barrett and T. B. Massalski, Structure of Metals (McGraw-Hill, New York, 1966).
- Rayne and Chandrasekhar (1960) J. A. Rayne and B. S. Chandrasekhar, Physical Review 120, 1658 (1960).
- Book (1983) S. M. R. Book, 6th ed. edited by E. A. Brandes (Butterworths, London, 1983).
- Vaidya and Kennedy (1970) S. N. Vaidya and G. C. Kennedy, Journal of Physics and Chemistry of Solids 31, 2329 (1970).
- Buchenauer et al. (1971) C. J. Buchenauer, M. Cardona, and F. H. Pollack, Physical Review B 3, 1243 (1971).
- Cohen and van Lieshout (1935) O. L. Cohen and A. K. W. A. van Lieshout, Z. Phys. Chem. A 173, 32 (1935).
- Olijnyk and Holzapfel (1984) H. Olijnyk and W. B. Holzapfel, J. Phys. (Paris), Colloq. 45, C8 (1984).
- Desgreniers et al. (1989) S. Desgreniers, Y. K. Vohra, and A. L. Ruoff, Phys. Rev. B 39, 10359 (1989).
- Careri et al. (1958) G. Careri, A. Paoletti, and M. Vicentini, Il Nuovo Cimento 10, 1088 (1958).
- Bruson and Gerl (1980) A. Bruson and M. Gerl, Phys. Rev. B 21, 5447 (1980).
- Frohberg et al. (1986) G. Frohberg, K. H. Kraatz, and H. Weber, in Proceedings of the 6th European Symposium on Materials Sciences under Microgravity Conditions, Bordeaux, France (ESA SP-256) (1986) p. 585.
- DeKock and Gray (1989) R. L. DeKock and H. B. Gray, Chemical structure and bonding (University Science Books, 1989).
- Blagoveshchenskii et al. (2012) N. Blagoveshchenskii, A. Novikov, and V. Savostin, Physica B: Condensed Matter 407, 4567 (2012).
- Messer and Levy (1965) C. E. Messer and I. S. Levy, Inorganic Chemistry 4, 543 (1965).