Pre-melting hcp to bcc Transition in Beryllium
Abstract
Beryllium (Be) is an important material with wide applications ranging from aerospace components to X-ray equipments. Yet a precise understanding of its phase diagram remains elusive. We have investigated the phase stability of Be using a recently developed hybrid free energy computation method that accounts for anharmonic effects by invoking phonon quasiparticles. We find that the transition occurs near the melting curve at GPa with a positive Clapeyron slope of K/GPa. The phase exists in a narrow temperature range that shrinks with increasing pressure, explaining the difficulty in observing this phase experimentally. This work also demonstrates the validity of this theoretical framework based on phonon quasiparticle to study structural stability and phase transitions in strongly anharmonic materials.
pacs:
63.20.Ry, 81.30.Bx, 61.50.Ks, 63.20.D-, 64.70.K-Elemental solids usually undergo a series of phase transitions from ambient conditions to extreme conditions element1 ; element2 ; element3 . Knowledge of their phase diagrams is a prerequisite for establishing their equations of state (EOS), a fundamental relation for determining thermodynamics properties and processes at high pressures and temperatures (PT). However, resolving phase boundaries is challenging for experiments given the uncertainties from several sources, especially at very high PT. Beryllium (Be) is a typical system whose phase diagram remains an open problem despite intense investigations. It assumes a hexagonal close-packed () structure at relatively low T element1 . Near the melting temperature ( K at 0 GPa), a competing phase with the body-centered cubic symmetry () seems to emerge exp1 ; exp2 ; exp3 . However, not all experiments hcp1 ; cexp1 ; cexp2 ; cexp3 ; cexp4 ; cexp5 ; cexp6 have observed this phase, causing confusion and controversies. Be is important for both fundamental research sci1 ; sci2 ; sci3 ; sci4 and practical applications. Being a strong and light-weight metal, it has been widely used in a broad range of technological applications in harsh environments and extreme PT conditions, e.g., up to 4,000 K and 200 GPa app1 ; app2 ; app3 ; app4 ; app5 .
The phase of Be was directly observed exp1 ; exp2 only at K around ambient pressure before melting. Measurements of the temperature dependent resistance suggested that Be is a high pressure phase and the phase boundary between GPa has a negative Clapeyron slope ( K/GPa) exp3 . However, recent experiments have challenged this conclusion cexp1 ; cexp2 ; cexp4 ; cexp5 ; cexp6 . For example, it was reported that Be was not observed for GPa and K cexp6 . On the theory side, the study of Be’s phase diagram using conventional methods encounters significant difficulties. The lattice dynamics of Be is highly anharmonic, and the widely used quasi-harmonic approximation (QHA) and Debye model are not able to capture such effect qha1 ; qha2 ; qha3 ; debye1 ; debye2 ; debye3 ; debye4 . For this reason, Be and the associated phase transition remain poorly understood for GPa (density ) where Be is dynamically unstable at 0 K qha2 . At GPa, Be is dynamically stabilized by pressure and the QHA might, in principle, be applied. However, the boundary qha1 ; qha2 ; qha3 predicted by the QHA does not agree with experiments cexp6 , suggesting that anharmonic effects still play an important role at higher pressures.
In this Letter, we report a new investigation of the phase stability of Be and the associated phase transition boundary up to 30 GPa and temperatures up to 2,000 K. We have used a recently developed hybrid approach tool1 ; tool2 that combines first-principles molecular dynamics (MD) and lattice dynamics calculations to address anharmonic effects in the free energy. In this method, the concept of phonon quasiparticles offers a quantitative characterization of the effects of lattice anharmonicity phonon1 ; phonon2 . We show that Be exhibits pronounced anharmonic effects in both the and phases. Specifically, our results reveal the dynamical stabilization of Be with increasing T. The phase, however, is favorable only in a narrow temperature range near , with phase boundary having a positive Clapeyron slope of K/GPa. The stability field shrinks with increasing pressure and eventually disappears at around 11 GPa. This result seems to agree overall with early experiments exp1 ; exp2 and differs from other phase boundaries (e.g., Mg renata3 ), usually displaying a negative Clapeyron slope.
In the present approach, phonon quasiparticles are numerically characterized by the mode projected velocity autocorrelation function tool1 ; tool2 ,
| (1) |
where is the mode projected and mass weighted velocity for normal mode () with wave vector ; is the atomic velocity produced by first-principles MD simulations with atoms, and and are the atomic mass and coordinate of atom , respectively. is the polarization vector of normal mode () calculated using density functional perturbation theory (DFPT) dfpt . For a well-defined phonon quasiparticle, the velocity autocorrelation function displays an oscillatory decaying behavior and its Fourier transform, i.e., the power spectrum,
| (2) |
should have a Lorentzian-type line shape tool1 ; tool2 . The renormalized phonon frequency , and the linewidth, can then be obtained as discussed in more details in the Supplemental Materials.
The concept of phonon quasiparticle reduces the complex problem of interacting anharmonic phonons to an effective non-interacting system phonon1 , such that the conventional kinetic gas model and, to a great extent, the theory of harmonic phonons are still applicable. Moreover, since structural phase transition is triggered by lattice vibrations for many cases, insight into the transition mechanism can be also obtained by monitoring the variation of frequencies and line widths of phonon quasiparticles.
We used the Vienna simulation package (VASP) vasp1 ; vasp2 to carry out first principles MD simulations on supercells (128 atoms) of Be. We used the generalized gradient approximation of Perdew, Burke, and Ernzerhof pbe and the projector-augmented wave method paw with an associated plane-wave basis set energy cutoff of 350 eV. For metallic Be, the finite temperature Mermin functional mermin ; mermin2 was used. Simulations were carried out at a series of volumes (V): /atom for Be and /atom for Be. For Be, proper aspect ratio () is adopted to obtain good hydrostatic conditions for specific volume and temperature. Temperatures ranging from 300 to 2,800 K are controlled through the Nosé dynamics nose . The considered volumes and temperatures result in a pressure range of GPa. For each volume and temperature, multiple independent MD runs (5 parallel replica) were performed to improve phase space sampling quality that also allow for evaluation of statistical uncertainties. Each MD run lasted 50 ps and used a time step of 1 fs. Harmonic phonon frequencies and normal modes were calculated using density functional perturbation theory (DFPT) dfpt .
Before proceeding, we should clarify the general understanding of the transition. The low T and low P structure relates to the structure through the zone center transverse optical (TO) mode and a macroscopic strain. This mode consists of opposite displacements of neighboring (0001) planes along and softens with increasing T. This is not necessarily a soft mode transition, but generally a first order transition with negative Clapeyron slope renata3 . The (0001) plane transforms into the (110) plane of the phase. This picture was validated by an early variable cell shape molecular dynamics study renata2 . The opposite transition involves the lowest transverse acoustic mode (TA2) at , the point of the Brillouin zone, marked by an open circle in Fig. 2(a). With this in mind we monitor closely the behavior of these modes with changing T.
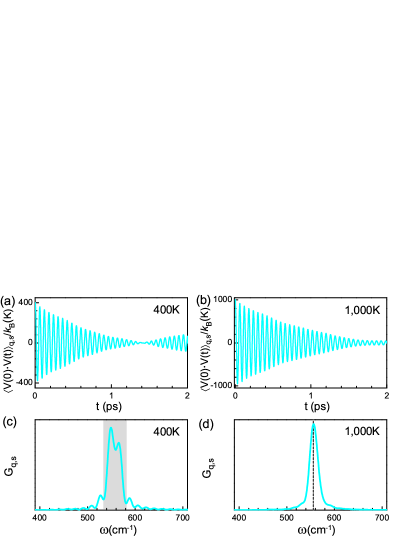
We first investigate the behavior of phonon quasiparticles at different temperatures. For Be, phonon quasiparticles are not well defined at low T as found in other systems phonon1 , but recovered at high T for unstable (soft) modes e.g., TA2. The analysis of this mode is shown in Fig. S2 of the Supplementary material. It is more interesting to notice that at low T, phonon quasiparticles are not well defined even for certain stable modes with positive harmonic frequencies. Fig. 1 shows and the corresponding power spectra of the TA1 phonon mode at calculated at 400 K (Fig. 1(a)) and 1,000 K (Fig. 1(b)). This mode is marked by an open square in Fig. 2(a). Although at K displays an oscillatory behavior, the amplitude decay is non-monotonic (Fig. 1(a)). Consequently, the power spectrum has two major peaks within the shaded area as shown in Fig. 1(c). This indicates that the frequency of this mode cannot be well constrained, or equivalently, the corresponding phonon quasiparticle is not well-defined. In contrast, at K exhibits a nicely decaying oscillatory behavior, Fig. 1(b). The corresponding power spectrum now has a well-defined Lorentzian line shape with a single and well defined peak, Fig. 1(d). It is thus straightforward to identify the renormalized frequency of this mode as cm-1. Similarly, all other quasiparticle mode frequencies sampled by the 4x4x4 supercell are equally well defined. As previously indicated tool1 ; tool2 , these renormalized phonon frequencies plus the normal modes enable the calculation of the renormalized force constant matrix and complete phonon dispersions. This quantitative characterization of phonon quasiparticles and renormalized phonon dispersion provide a solid foundation for studying thermal properties.
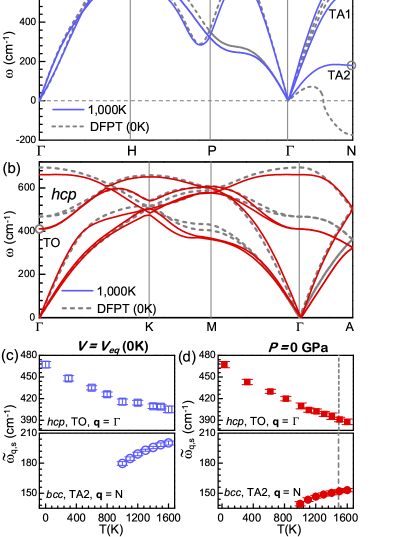
Figure 2(a) compares the anharmonic phonon dispersion of Be at 1,000 K with the harmonic phonon dispersion calculated using DFPT. Results are obtained at the static equilibrium volume of Be, /atom. There are noticeable differences between the anharmonic and harmonic phonon dispersions. In particular, the unstable (soft) TA2 branch along the line stabilizes when high temperature anharmonic effects are accounted for. This indicates that Be is stabilized by anharmonic effects. To gain further insight into anharmonic effects, we analyze T-dependent phonon frequency shifts. Fig. 2(c) shows that the frequency of the zone edge phonon mode at associated with the TA2 branch calculated at fixed volume varies non-linearly with T. Lowest order many-body perturbation theory (MBPT) mbpt predicts a linear frequency shift with T. Therefore, as expected, higher order anharmonic effects ignored in the perturbative treatment play an important role here.
The calculated anharmonic phonon dispersion over the whole Brillouin zone makes it possible to calculate the free energy in the thermodynamic limit (). Since Be is stable at low T for the entire pressure range of interest, the lattice thermal properties have been studied within the QHA qha1 ; qha2 ; qha3 without further examination of the validity of the approximation. This naturally brings up a question: how important are anharmonic effects in the free energy in this seemingly stable structure? Fig. 2(b) compares the anharmonic phonon dispersion at K and the harmonic phonon dispersion of Be calculated at a fixed volume of /atom corresponding to zero static pressure. The differences, although not alarming, are still significant in most of the Brillouin zone. A detailed analysis of individual phonon modes in the Supplementary material reveals that the frequency shifts with increasing T can be positive, negative or nearly zero, demonstrating the complexity of lattice anharmonic effects. What is important here is that the large frequency shifts in Be should be incorporated into the free energy calculation for more accurate evaluations of thermodynamic properties and phase boundaries.
The large frequency shifts not only reveal pronounced anharmonic effects but also shed light on the microscopic mechanism of this phase transition. As mentioned earlier, the and structures are related by a combination of phonon displacements and a macroscopic strain bain . Together they provide a path for the transition. The frequency of the zone center TO mode drops significantly from 467 to 405 cm-1 when T increases from 0 to 1,600 K (see Fig. 2(c)). This observation is consistent with expectations based on the anticipated transformation mechanism renata1 ; renata2 ; renata3 . We note that although the frequency shift is very large at 1,600 K, the picture of phonon quasiparticle is still valid for the phase (see the Supplementary material for detailed analysis). As mentioned earlier, from the Brillouin zone-folding relation, the corresponding mode in Be is the zone edge TA2 mode at , whose property is shown in Fig. 2(c) and (d).
We now demonstrate that anharmonic effects are critical for obtaining this phase boundary. When using anharmonic T-dependent phonon dispersions, the QHA free energy formula is no longer valid whereas the entropy formula is still applicable helm . Therefore, we first calculate the vibrational entropy tool1 ; phonon1 ,
| (3) |
with , and obtain the total free energy as:
| (4) |
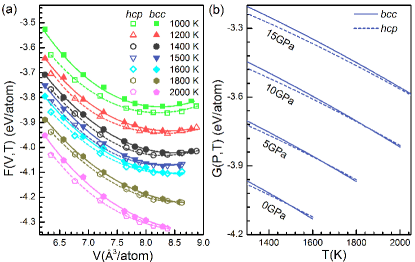
where is 1,000 K, is the total entropy including both vibrational and electronic contributions (See the Supplementary material for more details). Our analysis of phonon quasiparticles demonstrates that they are well defined for both phases for K, therefore the choice of . , where is the internal energy obtained from the MD simulation. Fig. 3(a) displays the calculated free energies for both and phases. It is seen that at K, , and consistently, the common tangent to these curves starts to have negative slope, indicating a transition from to at positive pressure. We note that the volumetric variations of both phases also provide clues to understand the predicted transition at very high P (e.g., 400 GPa) qha1 ; qha2 ; qha3 . More details of the variation of and is shown in Fig. S6 the Supplementary material.
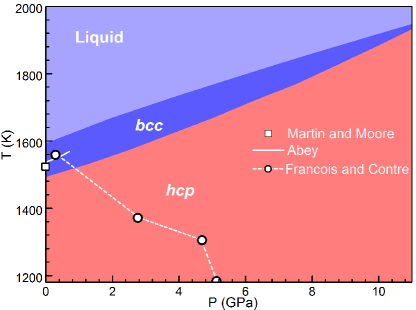
It is more convenient to convert into to obtain the phase boundary (see the Supplementary material for details). Fig. 3(b) displays for both and phases. At each P, the intersection of and gives the transition temperature. The resulting phase boundary shown in Fig. 4 together with the predicted/measured melting line, reveal several important aspects: (i) Be is stable only when T approaches the melting point, in good agreement with direct experimental measurements. For example, at ambient pressure where the melting temperature is K, Be was observed at K exp1 ; exp2 . (ii) The phase boundary has a positive Clapeyron slope of K/GPa, close to the experimental value ( K/GPa) reported by Abey exp2 . Francois et al. reported a negative Clapeyron slope through an indirect measurement of the T-dependent resistivity exp3 . Our results call for future experiments to clarify this issue. (iii) The phase transition occurs only in a narrow pressure range of GPa. Our results are consistent with recent experiments that do not observe Be at high pressures cexp1 ; cexp2 ; cexp3 ; cexp4 ; cexp5 . One report did not observe the phase at pressures as low as 8 GPa cexp6 whereas our results suggest that the phase should exist up to 11 GPa. However, the predicted temperature range over which the phase is favorable is vanishingly narrow. Thus, it is possible that this narrow temperature range was missed in experiments or that our calculations overestimate the stability field of the phase by few GPa.
In summary, using the concept of phonon quasiparticle, we have investigated the controversial phase boundary of Be. We find that Be is stabilized at low pressures and high temperatures by anharmonic effects. For Be, anharmonic effects on phonon properties are also significant. Using anharmonic phonon dispersions, we evaluated the free energies of both phases and showed that the phase emerges as a pre-melting phenomenon at relatively low pressures. Our results for the phase boundary are consistent with most experimental observations exp1 ; exp2 ; cexp1 ; cexp2 ; cexp3 ; cexp4 ; cexp5 ; cexp6 in all important aspects. The temperature range over which the phase exists shrinks with increasing pressure and vanishes at a theoretical pressure of about 11 GPa. This narrow temperature range explains the difficulty in observing the phase experimentally.
This work was supported by NSFC under Grant Nos. U1530401, 41474069 and 11328401, and NSAF under Grant No. U1530258. RW was supported by the Hareaus visiting professorship award from the University of Frankfurt and by NSF grants EAR-1319368 and -1348066. PZ was supported by the NSF grant DMR-1506669. Computations were performed at Beijing Computational Science Research Center and Minnesota Supercomputing Institute.
References
- (1) J. F. Cannon, J. Phys. Chem. Ref. Data, 3, 781 (1974).
- (2) K. Persson, M. Ekman, V. Ozolin, Phys. Rev. B, 61, 11221 (2000).
- (3) D. A. Young, Phase Diagrams of the Elements, University of California, 1991.
- (4) A. J. Martin and A. Moore, J. Less-Common Met. 1, 85 (1959).
- (5) A. Abey, LLNL Report No. UCRL-53567, 1984 (unpublished).
- (6) M. Francois and M. Contre, in Proceedings of the Conference internationale sur la metallurgie du beryllium, Grenoble, (Presses Universitaires de France, Paris, 1965).
- (7) W. J. Evans, M. J. Lipp, H. Cynn, C. S. Yoo, M. Somayazulu, D. Häusermann, G. Shen and V. Prakapenka, Phys. Rev. B 72, 094113 (2005).
- (8) L. C. Ming and M. H. Manghnani, J. Phys. F: Met. Phys. 14, L1 (1984).
- (9) V. Vijayakumar, B. K. Godwal, Y. K. Vohra, S. K. Sikka, and R. Chidambaram, J. Phys. F: Met. Phys. 14, L65 (1984).
- (10) A. R. Marder, Science 142, 664 (1963).
- (11) K. Nakano, Y. Akahama, and H. Kawamura, J. Phys.: Condens. Matter. 14, 10569 (2002).
- (12) N. Velisavljevic, G. N. Chesnut, Y. K. Vohra, S. T. Weir, V. Malba, and J. Akella, Phys. Rev. B 65, 172107 (2002).
- (13) A. Lazicki, A. Dewaele, P. Loubeyre, and M. Mezouar, Phys. Rev. B 86, 174118 (2012).
- (14) S. H. Glenzer, G. Gregori, R.W. Lee, F. J. Rogers, S.W. Pollaine, and O. L. Landen, Phys. Rev. Lett. 90, 175002 (2003).
- (15) S. H. Glenzer, O. L. Landen, P. Neumayer et al., Phys. Rev. Lett. 98, 065002 (2007).
- (16) H. J. Lee, P. Neumayer, J. Castor et al., Phys. Rev. Lett. 102, 115001 (2009).
- (17) I. Vobornik, J. Fujii, M. Hochstrasser et al., Phys. Rev. Lett. 99, 166403 (2007)
- (18) S. W. Haan et al., Phys. Plasmas 18, 051001 (2011).
- (19) D. Swift, D. Paisley, and M. Knudon, AIP Conf. Proc. 706, 119 (2003).
- (20) K. L. Wilson, R. A Causey, W. L. Hsu, B. E. Mills, M. F. Smith, and J. B. Whitley, J. Vac. Sci. Technol. A 8, 1750 (1990).
- (21) D. S. Clark, S.W. Haan, and J. D. Salmonson, Phys. Plasmas 15, 056305 (2008).
- (22) D. C. Wilson, P. A. Bradley, N. M. Hoffman et al., Phys. Plasmas 5, 1953 (1998); J. L. Kline, S. A. Yi, A. N. Simakov et al., Phys. Plasmas 23, 056310 (2015).
- (23) G. Robert and A. Sollier, J. Phys. IV France 134, 257 (2006).
- (24) G. Robert, P. Legrand, and S. Bernard, Phys. Rev. B 82, 104118 (2010).
- (25) F. Luo, L.-C. Cai, X.-R. Chen, F.-Q. Jing, and D. Alfé, J. Appl. Phys. 111, 053503 (2012).
- (26) L. X. Benedict, T. Ogitsu, A. Trave, C. J. Wu, P. A. Sterne, and E. Schwegler, Phys. Rev. B 79, 064106 (2009).
- (27) G. V. Sin′ko and N. A. Smirnov, Phys. Rev. B 71, 214108 (2005).
- (28) K. Kádas, L. Vitos, R. Ahuja, B. Johansson, and J. Kollár, Phys. Rev. B 76, 235109 (2007).
- (29) K. Kádas, L. Vitos, B. Johansson, and J. Kollár, Phys. Rev. B 75, 035132 (2007).
- (30) D.-B. Zhang, T. Sun, and R. M. Wentzcovitch, Phys. Rev. Lett. 112, 058501 (2014).
- (31) T. Sun, D.-B. Zhang, and R. M. Wentzcovitch, Phys. Rev. B 89, 094109 (2014).
- (32) T. Sun, X. Shen, and P. B. Allen, Phys. Rev. B 82, 224304 (2010).
- (33) A. J. C. Ladd, B. Moran, and W. G. Hoover, Phys. Rev. B 34, 5058 (1986).
- (34) J. D. Althof, P. B. Allen, R.. M. Wentzcovitch, and J. A. Moriarty, Phys. Rev. B 48, 13253 (1993).
- (35) S. Baroni, S. D. Gironcoli, A. D. Corso, and P. Giannozzi, Rev. Mod. Phys. 73, 515 (2001); Giannozzi, et al., J. Phys. Condens. Matter 21, 395502 (2009).
- (36) P. E. Blöchl, Phys. Rev. B 50, 17953 (1994).
- (37) G. Kresse, J. Furthmller, Phys. Rev. B 54, 11169 (1999).
- (38) G. Kresse and J. Hafner, Phys. Rev. B 4̱9, 14251 (1994).
- (39) J. P. Perdew, K. Burke, M. Ernzerhof, Phys. Rev. B 77, 3865 (1996).
- (40) A. Togo and I. Tanaka, Scr. Mater., 108, 1 (2015).
- (41) S. Nosé, J. Chem. Phys. 8̱1, 511 (1984); W.G. Hoover, Phys. Rev. A 31, 1695 (1985).
- (42) A. A.Maradudin and A. E. Fein, Phys. Rev. 128, 2589 (1962).
- (43) G. Grimvall, B. Magyari-Kop̈e, Vidvuds Ozoliņš, and K. A. Persson, Rev. Mod. Phys. 84, 945 (2012).
- (44) R. M. Wentzcovitch and M. L. Cohen, Phys. Rev. B, 37, 5571 (1988).
- (45) R. M. Wentzcovitch, Phys. Rev. B 50, 10358 (1994).
- (46) D. C. Wallace, Thermodynamics of Crystals (Wiley, New York, 1972).
- (47) N. D. Mermin, Phys. Rev. 137, A1441 (1965).
- (48) R. M. Wentzcovitch, J. L. Martins, and P. B. Allen, Phys. Rev. B 45, 11372 (1992).