Chemical Abundances of Two Stars in the Large Magellanic Cloud Globular Cluster NGC 1718
Abstract
Detailed chemical abundances of two stars in the intermediate-age Large Magellanic Cloud (LMC) globular cluster NGC 1718 are presented, based on high resolution spectroscopic observations with the MIKE spectrograph. The detailed abundances confirm NGC 1718 to be a fairly metal-rich cluster, with an average . The two red giants appear to have primordial O, Na, Mg, and Al abundances, with no convincing signs of a composition difference between the two stars—hence, based on these two stars, NGC 1718 shows no evidence for hosting multiple populations. The Mg abundance is lower than Milky Way field stars, but is similar to LMC field stars at the same metallicity. The previous claims of very low [Mg/Fe] in NGC 1718 are therefore not supported in this study. Other abundances (Si, Ca, Ti, V, Mn, Ni, Cu, Rb, Y, Zr, La, and Eu) all follow the LMC field star trend, demonstrating yet again that (for most elements) globular clusters trace the abundances of their host galaxy’s field stars. Similar to the field stars, NGC 1718 is found to be mildly deficient in explosive -elements, but moderately to strongly deficient in O, Na, Mg, Al, and Cu, elements which form during hydrostatic burning in massive stars. NGC 1718 is also enhanced in La, suggesting that it was enriched in ejecta from metal-poor AGB stars.
keywords:
galaxies: individual(LMC) — galaxies: abundances — galaxies: star clusters: individual(NGC 1718) — globular clusters: general — galaxies: evolution1 Introduction
Detailed abundances of stars in globular clusters (GCs) are essential for two primary goals: 1) understanding the nature of GC formation (e.g., Gratton et al. 2012) and 2) tracing the properties of field star populations in distant, unresolved galaxies (e.g., Colucci et al. 2013, Sakari et al. 2015). For most elements, the abundances of GC stars trace those of the field stars in their birth environment (Pritzl et al., 2005; Hendricks et al., 2016), providing probes of a galaxy’s star formation history, abundance gradients, chemical evolution, and assembly history. However, for a handful of other elements, from light elements like C, N, O, and Na to heavy neutron capture elements like Ba and Eu, Milky Way (MW) GCs host star-to-star variations that are unique to GCs and are not seen in most field stars (detections of field stars with these abundance variations are thought to be accreted from dissolved GCs; e.g., Martell et al. 2016). Similar variations have also been observed in classical, old GCs in dwarf galaxies, including the Large Magellanic Cloud (LMC; Johnson et al. 2006; Mucciarelli et al. 2009, 2010). These variations seem to be present in M31 GCs as well, and do affect the integrated abundances from distant, unresolved GCs (Colucci et al. 2014, Sakari et al. 2013, 2016). Despite the prevalence of GC multiple populations, the cause of these abundance variations is not yet well-understood. Observations of GCs outside of the MW, particularly ones that are unlike standard MW GCs, are necessary to understand GC formation. Without a more complete understanding of the multiple populations in GCs, interpreting integrated abundances of unresolved clusters remains difficult.
One cluster that is particularly intriguing for detailed abundance studies is the intermediate-age LMC cluster NGC 1718. Hubble Space Telescope photometry has revealed that the cluster is of intermediate age and moderately high metallicity, with an age Gyr and (Brocato et al., 2001; Kerber et al., 2007). Calcium triplet spectroscopy of three cluster stars suggests a slightly lower value of (Grocholski et al., 2006), while comparisons with other LMC clusters of a similar age suggest that NGC 1718 should have a metallicity of (Mackey & Gilmore, 2003). NGC 1718 is far too massive (Baumgardt et al., 2013) to be an open cluster—it is therefore distinctly different from the classical, metal-rich MW GCs, which are all older than 10 Gyr.111Though there are metal-rich, intermediate-age MW clusters (e.g. Palomar 1; Sakari et al. 2011), these clusters are much less massive than NGC 1718, and are not obviously classical GCs. Intermediate-age GCs like NGC 1718 are therefore excellent targets for studying the nature of GC multiple populations and for examining relatively recent star formation in the LMC.
The first detailed abundances for NGC 1718 were derived by Colucci et al. (2011, 2012) from integrated light (IL) spectroscopy, where a single spectrum is obtained from the entire stellar population. With a spectrum that only covered % of the cluster, they found NGC 1718 to be a moderate-metallicity (), intermediate-age (1.25-2 Gyr), solar [Ca/Fe] cluster with a very low Mg abundance (). While Mg is not always expected to trace the heavier -elements like Ca and Ti in a low mass galaxy, it is difficult to explain such a low Mg abundance through canonical chemical evolution scenarios. Colucci et al. suggested that NGC 1718’s low integrated Mg abundance indicated that the cluster was enriched solely through ejecta from a Type Ia supernova, a scenario which would increase Fe significantly without appreciably changing Mg (Tsujimoto & Bekki, 2012). However, similarly low-[Mg/Fe] field stars have not been found in the LMC (Lapenna et al., 2012), as would be expected if NGC 1718 formed in a environment enriched only by a Type Ia supernova.
Because of its age and mass, NGC 1718 is also interesting as a GC. The source of multiple populations within GCs continues to be debated; a particularly contentious point is whether the multiple populations are actually multiple generations with a very small ( Myr) age spread. Under many multiple population formation scenarios, the ratios of “primordial,” first generation stars (with normal abundance ratios) to “extreme” second generation stars (with enhanced [Na/Fe] and deficient [O/Fe]) requires a significant amount of mass loss from the first generation prior to the formation of the second generation. Convincing age spreads have not yet been detected in any of the younger LMC GCs, including NGC 1718. (Despite its broad main sequence, which suggests that the cluster hosts an age spread, its red clump implies that NGC 1718 does host a population with a single age; Niederhofer et al. 2016.) However, although multiple populations have been spectroscopically confirmed in LMC and Small Magellanic Cloud GCs older than Gyr (Johnson et al., 2006; Mucciarelli et al., 2009, 2010; Hollyhead et al., 2016) there is not yet any convincing evidence for the existence of multiple populations in GCs younger than Gyr (Mucciarelli et al., 2008, 2011, 2014a). This difference implies that the LMC GCs that formed more recently may be fundamentally different from the old GCs that formed early in the universe. The intermediate-age and young LMC GCs are therefore important targets for understanding the nature of multiple populations within GCs.
This paper presents the first abundance analyses of individual stars in NGC 1718, from high resolution spectroscopy of two cluster members. These abundances are calculated differentially with respect to the well studied giant Arcturus, and therefore have relatively low systematic errors. The detailed abundances of the two stars are then examined in light of NGC 1718’s context as a young GC and as a member of the LMC.
2 Observations and Data Reduction
| 2MASS IDs | RA (hms) | Dec (dms) | Observation | Seeing | S/N | |||||
|---|---|---|---|---|---|---|---|---|---|---|
| J2000 | J2000 | Dates | (sec) | (arcsec) | a | (km s-1) | ||||
| NGC 1718-9 | 04522589-6702590 | 4:52:26.0 | 67:02:59.1 | 13.52 | 12.56 | 26 Feb, 2012 | 11,400 | 0.65 | 49 | |
| NGC 1718-26 | 04521682-6703242 | 4:52:16.8 | 67:03:24.3 | 13.95 | 12.90 | 27 Feb, 2012 | 10,800 | 0.60 | 52 |
a S/N is per final extracted wavelength pixel at the
peak of the H order; weak lines typically have FWHM
pixels.
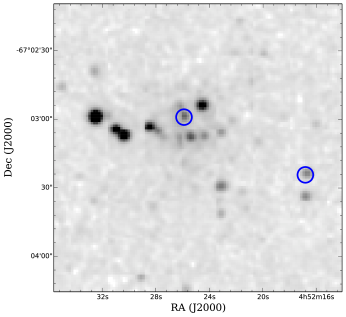
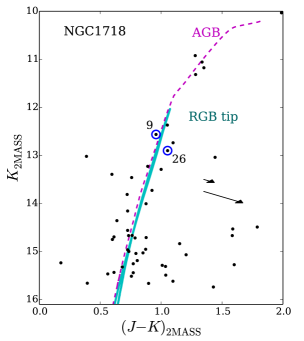
Probable RGB members of NGC 1718 were selected using photometry from the Two Micron All-Sky Survey (2MASS; Skrutskie et al. 2006). Figure 1 shows a 2MASS -band image of the cluster and the versus colour-magnitude diagram (CMD) for stars within 60 of the cluster centre. The two targets in this paper are identified. Following the 2 Gyr age estimated by Elson & Fall (1988) and Kerber et al. (2007), a 2 Gyr, z=0.004 BaSTI isochrone (Pietrinferni et al., 2004) is also displayed in Figure 1 to distinguish the RGB from the brighter AGB stars. The star identification numbers used here and shown in Table 1 and Figure 1 were assigned ad-hoc (by distance from input cluster centre in the 2MASS catalog).
High-resolution (R45,000) spectra of the two target stars were obtained on 26 and 27 February 2012, using the MIKE echelle spectrograph, with a 0.5 slit, on the Magellan/Clay telescope. The average atmospheric seeing was 0.6″, FWHM, on both nights. The usable wavelength coverage is from to 9000 Å.
Extraction of the spectra from the CCD data was performed using the MIKE pipeline software from Kelson (2003). However, subsequent analysis employed the suite of routines from the Image Reduction and Analysis Facility program (IRAF).222IRAF is distributed by the National Optical Astronomy Observatory, which is operated by the Association of Universities for Research in Astronomy, Inc., under cooperative agreement with the National Science Foundation. S/N ratios at the peak of the Hα order are estimated at 49 and 52 for star #9 and #26, respectively, per extracted wavelength pixel. Typical weak stellar lines have FWHM pixels.
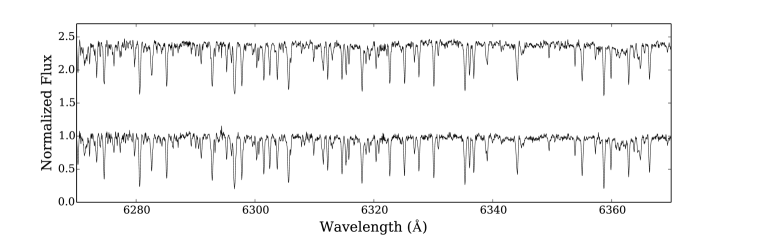
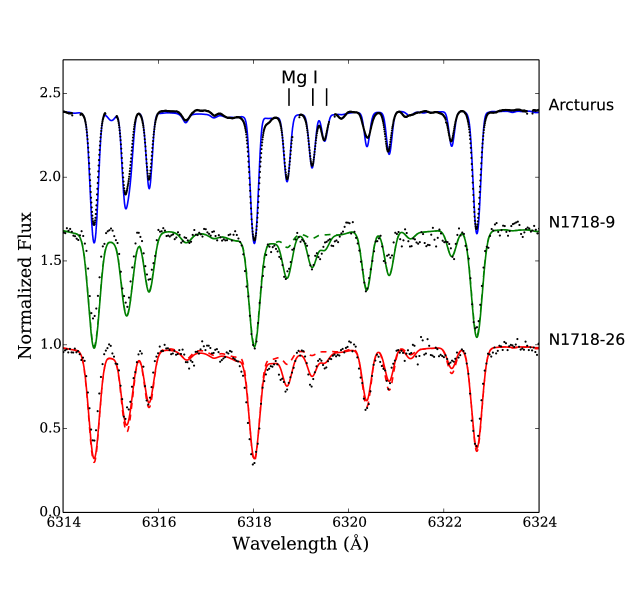
In order to facilitate continuum placement and EW measurement, the spectral modulation resulting from the echelle blaze was removed by dividing by a high S/N blaze function spectrum, which was found by fitting the continuum flux of the bright, extremely metal-poor, RGB star HD 126587. Radial velocities were determined through cross-correlations with a high resolution, high S/N Arcturus spectrum from Hinkle et al. (2003).333ftp://ftp.noao.edu/catalogs/arcturusatlas/ The final, heliocentric radial velocities are shown in Table 1 and are in agreement with the radial velocities of other confirmed cluster members from Grocholski et al. (2006). Spectra in the Å range are shown in Figure 2.
3 Atmospheric Parameters
Kurucz atmospheres444http://kurucz.harvard.edu/grids.html (Castelli & Kurucz, 2004) are adopted for this analysis, with an interpolation scheme to select and values that fall between the grid points. Solar-scaled (ODFNEW) atmospheres are adopted for the NGC 1718 stars, since the [/Fe] ratios in these targets are low (see Section 5).
Photometric effective temperatures were derived utilizing the observed 2MASS colours (see Figure 1(b)) and the empirical relation of González Hernández & Bonifacio (2009). The reddening and distance modulus from Kerber et al. (2007), and , are adopted, and the reddening relations from McCall (2004) are used to deredden the observed 2MASS colours. These photometric temperatures are shown in Table 2. Note that the Schlafly & Finkbeiner (2011) map implies a significantly higher reddening of . However, a reddening this high would increase the photometric temperatures by at least 500 K, which is not in agreement with the spectroscopic temperatures (see below) or the temperatures predicted by isochrones. The predicted stellar temperatures therefore support the lower reddening from Kerber et al. (2007), and indicate that the higher value from Schlafly & Finkbeiner (2011) is likely due to 100 m emission behind the two target stars. Bolometric corrections in the band were then derived given the photometric temperatures and the empirical relation from Buzzoni et al. (2010). NGC 1718 is estimated to be Gyr old (Kerber et al., 2007); BaSTI isochrones (Pietrinferni et al., 2004) with and an age of 2 Gyr indicate that the mass of red giants in such a GC is about 1.4 M☉. The photometric temperatures, bolometric corrections, and turnoff masses then yield initial photometric surface gravities.
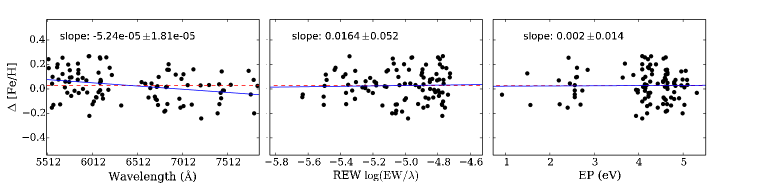
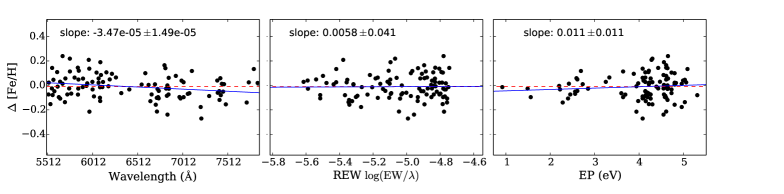
Spectroscopic temperatures and microturbulent velocities (, in km s-1) were derived by flattening slopes in \textFe 1 abundance with wavelength, reduced equivalent width (REW)555REW = (EW/), where is the wavelength of the transition., and excitation potential (EP, in eV). As in Fulbright et al. (2006), Koch & McWilliam (2008), and McWilliam et al. (2013), these [\textFe 1/H] abundances are calculated differentially, line by line, with respect to the [Fe/H] ratios of the cool giant star, Arcturus. The large uncertainties in the distance modulus and reddening make the photometric gravities very uncertain. For this reason, scaled solar BaSTI isochrones were utilized for the final surface gravities, using the spectroscopic temperatures. The stars were assumed to be RGB stars; if instead they are AGB stars, the gravities would change by 0.05 dex. The values from the , and the , models were averaged, since the two NGC 1718 stars have . The final atmospheric parameters are listed in Table 2. Star 9’s spectroscopic temperature is slightly lower than its photometric temperatures, which may be due to uncertainties in the foreground reddening.
| Photometric | Spectroscopic | Isochrone | |||
|---|---|---|---|---|---|
| (K)a | (K) | (km s-1) | |||
| NGC 1718-9 | |||||
| NGC 1718-26 | |||||
a The errors in the photometric temperature only consider the Kerber et al. (2007) reddening.
4 Line Lists and Analysis Techniques
The line lists of Fulbright et al. (2006, 2007), Koch & McWilliam (2008), and McWilliam et al. (2013) were adopted for this analysis. The lines in these lists were selected to be clean, relatively free of blends, and suitable for high precision, differential analyses. All Arcturus abundances are calculated relative to solar abundances derived with the same lines; the EWs from the above sources were used to derive these abundances. The LMC stellar [X/H] abundances from each spectral line are then calculated relative to the Arcturus [X/H] abundances from the same line. The average offsets of the NGC 1718 stars are then applied relative to the average [X/H] Arcturus ratios.
All abundances are determined with the July 2014 version of the Local Thermodynamic Equilibrium (LTE) line analysis code MOOG (Sneden, 1973). The abundances of Fe, Ca, etc. are determined via EWs, which are measured with the automated code DAOSPEC (Stetson & Pancino, 2008) for the NGC 1718 stars. (Recall that the EWs of Fulbright et al. 2006, 2007 and Koch & McWilliam 2008 were used for the Sun and Arcturus; these EWs were not altered.) A moderately-high order polynomial (order 33) was fit to the continuum levels of the normalized spectra. Since DAOSPEC can have difficulty accurately measuring the strongest lines (see Sakari et al. 2013), lines with EWs stronger than 100 mÅ were checked manually with IRAF’s splot routine. For elements with a few lines (e.g., Mg) all EWs were checked with IRAF’s splot routine. For most elements, lines stronger than were not considered because they are on the (relatively) flat part of the curve of growth and are therefore sensitive to uncertain damping constants and microturbulent velocities (see the discussion in McWilliam et al. 1995). For elements with only strong lines and HFS components, this limit was pushed to . Although this may introduce uncertainties dex, tests were performed to ensure that the lines were not saturated. Random errors in EW-based abundances were determined as in Shetrone et al. (2003). The lines utilized for EWs are shown in Table 3, along with the values measured in NGC 1718-9 and -26.
| Wavelength | Element | EP | EW (mÅ) | |
|---|---|---|---|---|
| (Å) | (eV) | NGC 1718-9 | NGC 1718-26 | |
| 5522.450 | 26.0 | 4.210 | 90.10 | 72.70 |
| 5525.540 | 26.0 | 4.230 | 98.90 | 90.00 |
| 5543.940 | 26.0 | 4.220 | - | 91.00 |
| 5560.210 | 26.0 | 4.430 | 71.80 | 78.80 |
| 5562.710 | 26.0 | 4.430 | 95.80 | 100.00 |
Notes: Table 3 is published in
its entirety in the electronic edition of Monthly Notices of
the Royal Astronomical Society. A portion is shown here for
guidance regarding its form and content.
References: Lines were selected from the
line lists of Fulbright et al. (2006, 2007) and
Koch & McWilliam (2008); the solar and Arcturus EWs are also taken
from those papers.
Other abundances are derived via spectrum syntheses (SS); in this case, spectral lines in a given wavelength range were selected from the Kurucz database.666http://kurucz.harvard.edu/linelists.html Molecular lines were included in regions where they are noted in the Arcturus atlas (Hinkle et al., 2003). Syntheses of the sun and Arcturus were first performed to identify the solar and Arcturus synthesis-based abundances. The uncertainty in SS-based abundances is determined from the range of abundances that can fit a given spectral line profile. The lines used for SS are shown in Table 4, along with the abundances for the sun, Arcturus, and the NGC 1718 stars. Figure 4 shows examples of the fits to the 6318/6319 Å \textMg 1 lines, which are near a \textCa 1 autoionization feature.
Appendix A presents a detailed analysis of the abundance sensitivity to the adopted atmospheric parameters, following the procedure of McWilliam et al. (1995, 2013). The final errors in [X/Fe] ratios are shown in Table 9.
| Wavelength | Element | EP | (X) | |||
|---|---|---|---|---|---|---|
| (Å) | (eV) | Sun | Arcturus | NGC 1718-9 | NGC 1718-26 | |
| 6300.304 | 8.0 | 0.00 | 8.84 | 8.69 | ||
| 6154.222 | 11.0 | 2.10 | 6.28 | 5.87 | ||
| 6160.746 | 11.0 | 2.10 | 6.33 | 5.94 | ||
| 6318.705 | 12.0 | 5.10 | 7.60 | 7.43 | ||
| 6319.232 | 12.0 | 5.10 | 7.60 | 7.45 | ||
| 6696.015 | 13.0 | 3.14 | 6.30 | 6.20 | ||
| 6698.665 | 13.0 | 3.14 | 6.32 | 6.13 | ||
| 5782.110a | 29.0 | 1.64 | 4.22 | 3.94 | ||
| 6645.130 | 63.1 | 1.37 | 0.42 | 0.24 |
a HFS components were included in the syntheses.
5 Abundances
Final abundances are shown in Table 5. As discussed in Sections 3 and 4, all abundances are calculated differentially with respect to Arcturus and the Sun. All [X/Fe] ratios are calculated using \textFe 1. Many analyses utilize \textFe 2 for singly ionized species (and \textO 1), because the systematic errors are expected to be similar. However, Table 9 demonstrates that for the NGC 1718 stars, the uncertainties are smaller when the [X/Fe] ratios are calculated with \textFe 1 (see Appendix A).
| Arcturus | NGC 1718-9 | NGC 1718-26 | |||||||||
|---|---|---|---|---|---|---|---|---|---|---|---|
| [X/Fe] | Method | [X/Fe] | Method | [X/Fe] | Method | ||||||
| \textFe 1 | 152 | EW | 99 | EW | 103 | EW | |||||
| \textFe 2 | 5 | EW | 2 | EW | 2 | EW | |||||
| \textO 1 | 1 | SS | 1 | SS | 1 | SS | |||||
| \textNa 1 | 2 | SS | 2 | SS | 2 | SS | |||||
| \textMg 1 | 11 | EW/SS | 7 | EW/SS | 7 | EW/SS | |||||
| \textAl 1 | 5 | EW/SS | 4 | EW/SS | 4 | EW/SS | |||||
| \textSi 1 | 19 | EW | 9 | EW | 12 | EW | |||||
| \textCa 1 | 14 | EW | 2 | EW | 2 | EW | |||||
| \textTi 1 | 25 | EW | 7 | EW | 12 | EW | |||||
| \textTi 2 | 6 | EW | 2 | EW | 2 | EW | |||||
| \textV 1 | 2 | EW | 3a | EW | 3a | EW | |||||
| \textMn 1 | 5 | EW | 3a | EW | 3a | EW | |||||
| \textNi 1 | 17 | EW | 15 | EW | 14 | EW | |||||
| \textCu 1 | 1 | SS | 1 | SS | 1 | SS | |||||
| \textRb 1 | 2 | EW | 2 | EW | 2 | EW | |||||
| \textY 2 | 3 | EW | 2 | EW | 1 | EW | |||||
| \textZr 1 | 4 | EW | 3a | EW | 3a | EW | |||||
| \textLa 2 | 5 | EW | 4 | EW | 3 | EW | |||||
| \textEu 2 | 1 | SS | 1 | SS | 1 | SS | |||||
Notes: a Lines have REW; in all
cases these lines have HFS components.
5.1 Iron
The \textFe 1 abundances in the two NGC 1718 stars are derived from EWs of unblended lines, while only two \textFe 2 lines are measurable. The greater number of \textFe 1 lines means that \textFe 1 has a lower random error than \textFe 2; still, \textFe 1 and \textFe 2 are in good agreement in all cases. In particular, any offsets that may be expected from NLTE effects (e.g., Kraft & Ivans 2003) are minimized with this differential abundance approach (since Arcturus is expected to have the same NLTE corrections as the NGC 1718 stars).
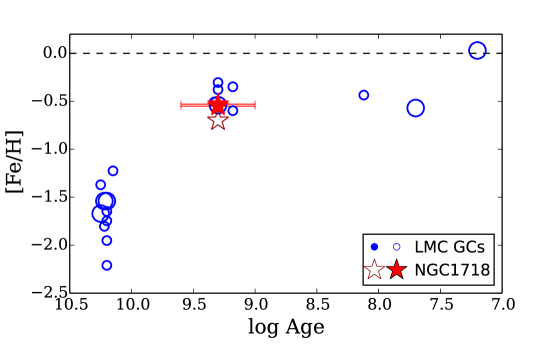
The abundances from the two NGC 1718 stars indicate an average cluster metallicity of . This value roughly agrees with the isochrone fits by Kerber et al. (2007), and is consistent with the age/metallicity relations of other LMC GCs (see Figure 5 and Mackey & Gilmore 2003) and field stars (e.g., Piatti et al. 2012). However, this value is higher than the integrated light metallicity from Colucci et al. (2011, 2012), who find (though note that their ) and the calcium triplet measurements from Grocholski et al. (2006), who find . Integrated abundances can be extremely sensitive to the properties of the adopted isochrone (e.g., Sakari et al. 2014; Colucci et al. 2016). In fact, for NGC 1718, Colucci et al. find two appropriate isochrones that reproduce their \textFe 1 line strengths: one with an age of 1 Gyr and , the other with age = 2.5 Gyr and . Because their analysis was unable to distinguish between the solutions, Colucci et al. averaged the age and metallicity, deriving a final abundance of . Uncertainties in the age and metallicity may introduce uncertainties in the integrated [\textFe 1/H] ratio dex (Sakari et al., 2014; Colucci et al., 2016). The disagreement with the CaT metallicities could be due to NGC 1718’s lower [/Fe], such that the CaT indicates a low [Z/H] rather than [Fe/H].
5.2 Light Elements: O, Na, Mg, and Al
The O and Na abundances are derived solely with SSs. The forbidden line at 6300 Å is used to determine the \textO 1 abundances. CN lines are included in these syntheses, and the O abundances are therefore mildly sensitive to the adopted C abundance. The Na abundances are from the 6154/6160 Å doublet, which should be least sensitive to non-LTE effects in this metallicity range (Lind et al., 2011); the INSPECT database777Data obtained from the INSPECT database, version 1.0: http://www.inspect-stars.com/ confirms that any corrections should be small. At most, non-LTE effects would introduce offsets dex in these giant stars (Mashonkina et al., 2000).
Mg and Al are derived with EWs and SSs. Most of the Mg and Al lines are sufficiently clean for EW analyses, with two exceptions: the 6318 and 6319 Å \textMg 1 lines and the 6696 and 6698 Å \textAl 1 lines. In the latter case the lines are weak enough to make EW measurements difficult. The 6318 and 6319 Å \textMg 1 lines are fairly strong—however, they are located on top of a broad \textCa 1 autoionization feature, which makes continuum identification difficult. Figure 4 shows these syntheses in Arcturus and the two NGC 1718 stars.
The only previous detailed abundances for NGC 1718 are from the integrated light analysis of Colucci et al. (2012). The integrated [Na/Fe] and [Al/Fe] ratios are slightly higher than the individual stars, but are in agreement within the errors. The integrated is considerably lower than the individual abundances. In their analysis of MW GCs, Colucci et al. (2016) find that their IL [Mg/Fe] ratios are generally dex lower than the values from individual values. This offset may be due to systematic effects (e.g., NLTE effects, as proposed by Colucci et al.) or it may reflect real abundance variations within the cluster. This possibility will be discussed in more detail in Section 6.1.
5.3 -Elements
The Si, Ca, and Ti abundances are determined from EWs. In the NGC 1718 stars there are 8-12 \textSi 1 lines, but only two \textCa 1 lines (there are many \textCa 1 lines in this wavelength range, but most are too strong for this analysis; see Section 4). There are 7-12 \textTi 1 lines available in the NGC 1718 spectra, but only 2 \textTi 2 lines. In NGC 1718-9, the \textTi 2 abundance is lower than \textTi 1. Si, Ca, and \textTi 1 are all in excellent agreement, suggesting that NGC 1718 is a moderately -enhanced cluster.
From the integrated light spectrum, Colucci et al. (2012) derive , which is lower than the individual stars analyzed in this work. Colucci et al.’s is much higher than NGC 1718-9 and -26; this high abundance suggests that the integrated Ti is systematically offset in some way. The optical IL \textTi 1 lines are very sensitive to stochastic sampling effects (Sakari et al., 2014); similarly, Colucci et al. (2016) find a large scatter in the IL \textTi 1 abundances of their MW GCs.
5.4 Iron-peak Elements
EWs are utilized for abundances of V, Mn, and Ni, though [Mn/Fe] was also verified with SSs. Cu was determined solely with SSs. V, Mn, and Cu require HFS components to properly account for the strengths of the lines. The HFS line lists and the Arcturus EW measurements from McWilliam et al. (2013) are adopted here. Note that two of the three \textV 1 lines and all three of the \textMn 1 lines have REWs larger than . However, these lines all have HFS splitting which de-saturates the lines; the EWs of such features are therefore still sensitive to the abundance. Tests of these features show that the lines are formed throughout the atmospheres and are not saturated in the top few layers, where the models are least reliable. The Cu abundance is determined from the 5782 Å line. HFS components and isotopic splits were included in the syntheses—again, these lists are from McWilliam et al. (2013). A solar isotopic ratio of 63Cu/65Cu is adopted (Asplund et al., 2009). In this metallicity range, non-LTE effects are not expected to be significant for these Cu lines (Yan et al., 2015).
The abundances of the two stars indicate that NGC 1718 has solar [Ni/Fe], mildly subsolar [V/Fe] and [Mn/Fe], and very deficient [Cu/Fe]. Colucci et al.’s integrated light analysis suggested that the abundances of iron-peak elements Mn and Ni are roughly solar in NGC 1718. Although the individual stars show a lower [Mn/Fe], the results are in agreement within the errors.
5.5 Neutron-Capture Elements
Neutron-capture elements form when free neutrons are captured by seed nuclei. The build-up of neutrons in the nucleus leads to heavier isotopes, while the subsequent decay into protons gradually forces elements to higher atomic number. The types of elements and isotopes that form from neutron captures depend on the incoming neutron flux, i.e., the slow (s-) neutron-capture process has different nucleosynthetic yields than the rapid (r-) process. Although the heavy elements typically form in both processes, certain elements form primarily in only one of the processes.
5.5.1 s-Process Elements
In the sun, Y, Zr, and La form primarily in the s- process, while % of Rb forms via the s-process (Burris et al., 2000). Abundances of all four elements were determined from EWs, utilizing the HFS line lists from McWilliam et al. (2013). Two \textRb 1 lines are utilized, at 7800 and 7947 Å; these lines are of moderate strength in both stars. Two \textY 2 lines (5728 and 7450 Å) are detectable in NGC 1718-9, while only the bluer one is detectable in NGC 1718-26. Zr abundances are determined from three strong lines, all with ; again, these lines have HFS components, and tests were done to ensure that the individual components were not saturated. Three to four moderate strength \textLa 2 lines were utilized.
Colucci et al. (2012) determine an integrated [Y/Fe] for NGC 1718, which they find to be roughly solar. This agrees with the abundances from the two individual stars in this work. Though they do not detect La lines in NGC 1718, Colucci et al. do present an integrated Ba abundance of . Barium is also primarily an s-process element in this metallicity range, and the lines are easily detectable; unfortunately, in this analysis the barium lines are far too strong in both of the target stars for a reliable abundance analysis (see Section 4). Given that they are both second peak, s-process elements, Ba is expected to track La. Though this analysis finds slightly higher [La/Fe], the two are in agreement within the errors.
5.5.2 r-Process Elements
Eu is primarily an r-process element, with only 3% forming from the s-process in the sun (Burris et al., 2000). Eu was determined from spectrum syntheses of the 6645 Å line. Nearby CN features were included in the syntheses. The HFS and isotopic information from McWilliam et al. (2013) were included, and the solar ratio was assumed (Asplund et al., 2009). Note that Colucci et al. (2012) do not provide a Eu abundance for NGC 1718. In this work, NGC 1718 is found to show moderate r-process enhancement.
5.6 Lithium
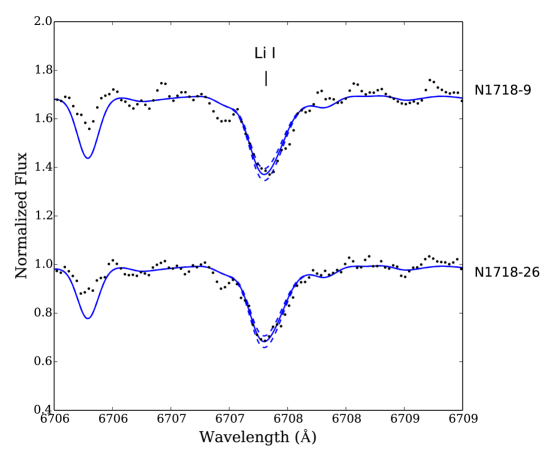
Lithium is detectable in the two NGC 1718 stars, as shown in Figure 6. Syntheses were done utilizing lines and HFS components from the Kurucz database888http://kurucz.harvard.edu/linelists/ and considering only 7Li lines. The derived abundances are and for NGC 1718 - 9 and NGC 1718 - 26, respectively. Note that NLTE corrections are expected to be dex for these stars, based on estimates from the INSPECT database999Data obtained from the INSPECT database, version 1.0: http://www.inspect-stars.com/ (Lind et al., 2009, though note that the atmospheric parameters in the database do not extend to sufficiently cool temperatures and low surface gravities). These rough Li abundances seem appropriate for normal, evolved RGB stars in GCs (e.g., Mucciarelli et al. 2014b; D’Orazi et al. 2014, 2015; Kirby et al. 2016).
6 Discussion
As discussed in Section 1, NGC 1718 is a valuable target for chemical abundance analyses, for two reasons: 1) its status as an intermediate-age, sparse GC (which will be discussed in Section 6.1), and 2) its presence in the LMC, which can be used to probe the chemical evolution of the LMC (see Section 6.2).
6.1 NGC 1718 as a Globular Cluster
Section 1 described the presence of multiple populations in GCs. To summarize, in the Milky Way, all classical GCs show star-to-star abundance variations in Na and O; some also show variations in Mg and Al (e.g., Carretta et al. 2009). Though Mg and Al variations are typically only seen in massive, metal-poor GCs (e.g., M15; Sneden et al. 1997), recent observations in the -band suggest that the Mg/Al anticorrelation may be present in metal-rich GCs as well (Meszaros et al., 2015). No convincing signs of similar multiple populations have yet been detected in intermediate-age or young LMC GCs (e.g., Mucciarelli et al. 2008, 2011, 2014a) though they have been detected in old LMC GCs (Johnson et al., 2006; Mucciarelli et al., 2009). Abundance variations within distant GCs can be inferred from integrated spectra, e.g., through high integrated [Na/Fe] ratios (Sakari et al., 2013, 2015; Colucci et al., 2014). Colucci et al. (2012) find that the intermediate-age GCs do not have high integrated [Na/Fe] ratios, while the older GCs do. Though they did find low integrated [Mg/Fe] in NGC 1718, they attributed this to low primordial Mg rather than to star-to-star variations within the cluster.
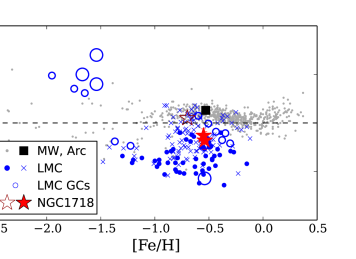
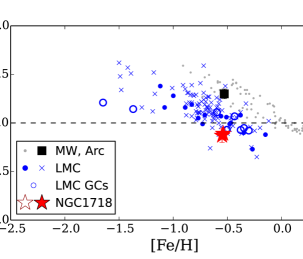
With only two stars in this sample it is difficult to assess the presence of any abundance spreads within NGC 1718. Though the two target stars do appear to have slightly different O and Na abundances (with one more O-deficient and Na-enhanced than the other) the abundances are identical within random errors. The Na abundance differences are driven solely by the 6160 Å line (the 6154 Å line gives similar Na abundances). Thus, there is no convincing evidence for a spread in Na and O between the two stars. Additionally, neither of the stars have enhanced Na or deficient O relative to the LMC field stars (see Figure 7). Similarly, the Mg and Al abundances in the two NGC 1718 stars track the LMC field star distribution and are identical within the errors (see Figure 8).
The O, Na, Mg, and Al abundances of these stars therefore appear to follow the “primordial” abundance signature of the cloud from which NGC 1718 formed. This lack of significant abundance differences between these two stars does not rule out the presence of multiple populations in NGC 1718—indeed, Colucci et al.’s higher [Na/Fe] and [Al/Fe] and lower [Mg/Fe] integrated ratios suggest that observations of more cluster stars are necessary to resolve this issue. It does imply, however, that Colucci et al.’s unexpected integrated abundances are not likely to be the result of unusual chemical evolution in the LMC.
6.2 The Chemical Evolution of NGC 1718, the LMC, and its GC System
The agreement between the abundances of the NGC 1718 stars and the LMC field stars suggests that NGC 1718 is a valuable probe for examining the chemical evolution of the LMC, particularly for elements like Mn and Rb, which have not yet been extensively studied in the LMC GCs. NGC 1718 can be compared with other stars and GCs, both in the LMC and the MW; however, systematic uncertainties may complicate these comparisons. The differential nature of this analysis, however, means that comparisons with Arcturus will be extremely robust.
6.2.1 -elements
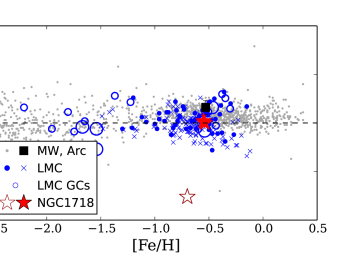
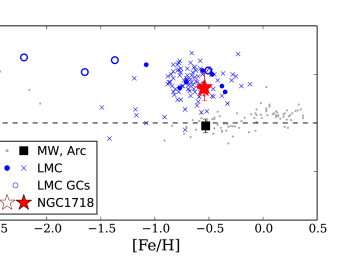
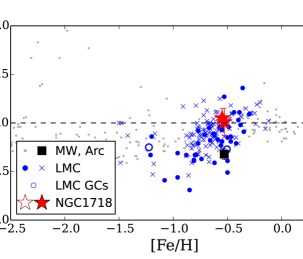
One major result from this analysis is that NGC 1718’s abundances do not require a unique formation scenario from the pure ejecta of Type Ia supernovae, as proposed by Colucci et al. (2012). The normal [Mg/Fe] in the two stars (relative to the LMC field stars) suggests that the low integrated [Mg/Fe] is either 1) an indication of a severe Mg spread within NGC 1718 (see Section 6.1) or 2) a result of some systematic uncertainty in the IL analysis. Regardless of the cause for the discrepancy with the integrated abundance, the normal [Mg/Fe] in the two stars from this analysis indicates that NGC 1718’s primordial abundances were not distinct from the LMC field stars at the same metallicity. In the other -elements, e.g., Ca (see Figure 8) NGC 1718 also tracks the LMC field stars.
The traditional -elements do not all share the same formation site. McWilliam et al. (2013) outline two broad categories of -elements: hydrostatic elements like O and Mg, which form during normal burning phases in massive stars; and explosive elements like Si, Ca, and Ti, which form in Type II supernovae. McWilliam et al. (2013) also add Na, Al, and Cu to the list of hydrostatic elements, since Na and Al are also expected to form during C and Ne burning (Woosley & Weaver, 1995), and Cu is expected to form from the weak s-process during hydrostatic burning in massive stars. In the NGC 1718 stars, the Na, Al, and Cu ratios are all lower than the MW field stars. Relative contributions of hydrostatic and explosive elements can be considered by examining ratios, e.g., [Mg/Ca] and [Cu/Ca] (see Figure 9). In the Sagittarius dwarf spheroidal (Sgr), McWilliam et al. found that the hydrostatic and explosive elements did not track each other; specifically, they found a paucity of hydrostatic elements compared to explosive elements (seen as low [Mg/Ca], for example). They interpreted these offsets as a signature of a top-light initial mass function (IMF), i.e., one lacking the most massive stars, which are expected to produce hydrostatic elements.
| [X/Ca] | [X/Ca]a | |||||
|---|---|---|---|---|---|---|
| Arcturus | NGC 1718-9 | NGC 1718-26 | NGC 1718-9 | NGC 1718-26 | ||
| Cu | ||||||
| O | ||||||
| Al | ||||||
| Na | ||||||
| Mg | ||||||
| Si | ||||||
| \textTi 1 | ||||||
a Relative to Arcturus.
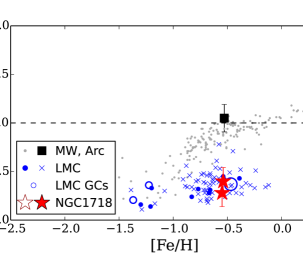
The LMC results are not as straightforward as the Sgr results. In their sample of bar stars, Van der Swaelmen et al. (2013) found that the hydrostatic elements were occasionally lower than the explosive elements, albeit with a large scatter. The NGC 1718 stars generally follow the LMC disk stars: the disk stars have similar [Mg/Fe] and [Ca/Fe] ratios, such that [Mg/Ca] is roughly solar101010Note that with the original Pompéia et al. (2008) results [Mg/Ca] was supersolar. Van der Swaelmen et al. (2013) subsequently revised the Pompéia et al. Mg abundances downward—these are the values given in the plots. (see Figure 9). The bar stars have slightly lower Mg and higher Ca, which leads to a mildly subsolar [Mg/Ca]. The offset between hydrostatic and explosive elements is therefore apparently smaller in the LMC than in Sgr, presumably because the LMC is more a massive galaxy than Sgr, and can therefore form more massive stars. However, [O/Ca] is mildly low in the two NGC 1718 stars, at . In NGC 1718 and the LMC field stars the other hydrostatic elements Na, Al, and Cu are lower than the explosive elements (see Figure 9). The Sgr results qualitatively show similar behaviour, i.e. Na, Al, and Cu are lower than Mg. This suggests that the LMC is not forming Na, Al, and Cu as efficiently as Mg and the explosive elements (though note that the two NGC 1718 stars in this work have higher Na and Al than the LMC disk stars, which suggests that the offsets in the hydrostatic elements in not uniform throughout the LMC).
Table 6 shows [X/Ca] ratios in Arcturus and the NGC 1718 stars for all the explosive and hydrostatic elements considered here. Compared to Arcturus, the two NGC 1718 stars are deficient in all hydrostatic elements relative to Ca. The strongest deficiencies are in Cu and O, with slightly weaker deficiencies in Na, Mg, and Al. This could be due to truncation of the high mass end of the IMF (McWilliam et al., 2013) but at a higher mass than for Sgr. It is unlikely that low O could be a result of CNO cycle oxygen burning, since the CNO cycle is expected to reduce oxygen abundances only slightly, by dex (Lambert & Ries, 1981). On the other hand, extensive burning of oxygen should also produce prodigious amounts of Na, which is not seen.
6.2.2 Fe-peak Elements
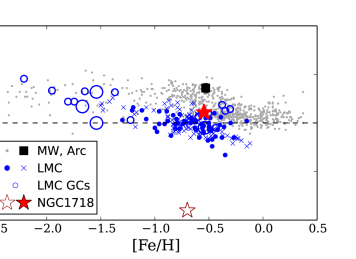
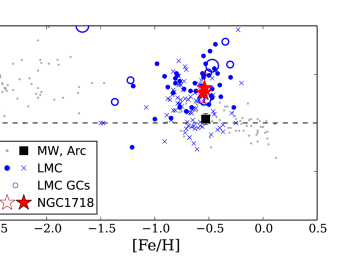
The Mn abundance ratios in NGC 1718 are subsolar, while [V/Fe] and [Ni/Fe] are roughly solar. [V/Fe] is in agreement with other LMC stars and GCs, through there is a large scatter. There are very few [Mn/Fe] measurements in LMC stars; however, NGC 1718 agrees with most of the GCs that have had Mn determinations. MW field stars also have subsolar [Mn/Fe] ratios at . Lower [Mn/Fe] has been seen in various dwarf galaxies, notably Sgr; however, (McWilliam et al., 2013) found solar [Mn/Fe] and [V/Fe] in their differential analyses of three Sgr field stars, and argued that previous reports of low V and Mn in Sgr stars may result from problems with, e.g., the adopted stellar temperatures, solar abundances, atomic data, and/or non-LTE corrections. All of these issues can be minimized with a line-by-line differential analysis. The differential analysis in this work also finds similar [Mn/Fe] and [V/Fe] as MW field stars.
6.2.3 Neutron Capture Elements: The s-Process
The s-Process
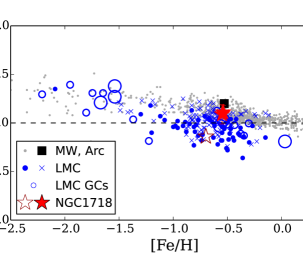
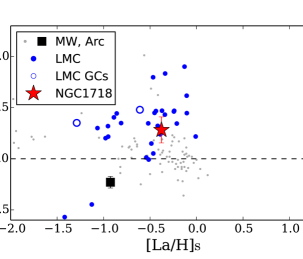
Table 5 shows that [La/Fe] is mildly enhanced in NGC 1718, by dex compared to Arcturus. This agrees with the LMC bar and disk stars and the other GCs, and is consistent with other dwarf galaxies (e.g., Smecker-Hane & McWilliam 2002; Shetrone et al. 2003; Venn et al. 2004; McWilliam et al. 2013), which are known to have excesses of second peak (heavy) s-process elements like La compared to first peak (light) elements like Y and Zr. Recall that the main site of the s-process is thought to be AGB stars. In metal-poor AGB stars there is a high ratio of neutrons to seed nuclei, which enables the s-process to create heavier nuclei than in metal-rich AGB stars. Stars in dwarf galaxy are thought to receive more s-process enrichment from metal-poor AGB stars, which leads to a higher [La/Y] than MW field stars (see Figure 10). This difference is not due to any contributions from the r-process: Figure 10 shows s-process only ratios, where the r-process contributions have been subtracted, following McWilliam et al. (2013). Indeed, NGC 1718’s [La/Y] ratio is higher than Arcturus and other MW field stars, in agreement with the LMC stars111111Note that the LMC bar stars show a large spread in [La/Y] at a fixed [La/H]—this is due to the Y abundances, which are slightly higher than the LMC disk stars. For this reason the bar stars are not included in Figure 10. Van der Swaelmen et al. (2013) confirm that this is not likely to be a systematic error, and they suggest that the high Y may therefore indicate that the bar stars have retained the ejecta of more metal-rich AGB stars. The scatter in [La/Y] suggests that the bar may have experienced inhomogeneous mixing, with some environments retaining metal-rich AGB ejecta and others experiencing leaky box chemical evolution and retention of metal-poor AGB ejecta. Comparisons with the dilution curves in McWilliam et al. (2013) show that this scatter can be reproduced with varying yields of La and Y. and the Sgr stars from McWilliam et al. (2013). Zr (another first peak s-process element) is also lower than La in these stars.
Rb is produced by the s-process (50% in the sun; Burris et al. 2000)—the dominant contributor is thought to be intermediate-mass AGB stars (e.g., Fishlock et al. 2014). McWilliam et al. (2013) provide a through explanation of Rb’s nucleosynthetic properties. Their comparison of Rb () with Zr () showed that Rb was underabundant with respect to Zr, as compared to MW field stars. This is also seen in NGC 1718, where [Rb/Zr] is dex lower than Arcturus. McWilliam et al. (2013) attribute this offset in Sgr to a lower retention of ejecta from intermediate-mass AGB stars at high [Fe/H], compared to lower-mass AGB stars. While this could indicate a paucity of intermediate-mass AGB stars compared to the MW (due to, e.g., a top-light IMF), McWilliam et al. also implicate “leaky box” chemical evolution as a means of selectively enriching a galaxy with low-mass AGB stars.
The LMC stars therefore generally show the excesses in heavy s-process elements that are typically seen in dwarf galaxies. The LMC’s offsets from the MW are not as significant as those seen in Sgr, which is consistent with the LMC being a more massive galaxy.
The r-Process
Eu is primarily an r-process element in the Sun (Burris et al., 2000). As can be seen in Table 5, NGC 1718-9 and -26 show no enhancements over Arcturus or the other MW field stars. This suggests that the LMC is not enhanced in r-process elements, relative to MW stars at the same [Fe/H]. The LMC disk and bar stars do seem to be slightly enhanced in [Eu/Fe]; Van der Swaelmen et al. (2013) argue that this is not a systematic offset since their Arcturus abundance is in agreement with the MW field stars. However, their Arcturus Eu abundance is dex higher than the value derived in this analysis. If the Van der Swaelmen et al. (2013) [Eu/Fe] ratios are all lowered by 0.1 dex, most of the stars are in agreement with the MW field stars.
Although the site of the r-process is not well constrained, core collapse supernovae (Qian & Wasserburg, 2008) and neutron star mergers (Tsujimoto & Shigeyama, 2014) are leading candidates. Both of these candidate sites fall at the end stages of massive star evolution. Recall that the hydrostatic elements O, Mg, etc. are also thought to form in massive stars (the progenitors of core collapse supernovae). Figure 11 compares Eu to the hydrostatic element O, and demonstrates that the LMC stars are enhanced in Eu relative to O. As discussed in Section 6.2.1, this is driven by deficiencies in the O abundances. Similar offsets are seen in the Sgr stars analyzed by McWilliam et al. (2013). In their framework, this indicates that the r-process occurs in stars with lower initial masses than the stars that produce the hydrostatic elements, indicating that Sgr and the LMC are missing the highest mass stars. However, regardless of the cause of the O deficiencies, the high [Eu/O] ratios relative to the MW indicate that the nucleosynthesis of r-process elements cannot occur in the same stars that produce most of the hydrostatic elements; otherwise, the ratios would be the same between the LMC and the MW.
The s- vs. the r-Process
Figure 11 shows [La/Eu] ratios. The ratio of [La/Eu] gives a rough indication of the relative contributions from the s-process vs. the r-process. As AGB stars evolve, [La/Eu] gradually rises over time. Relative to Arcturus, the NGC 1718 stars have high [La/Eu], similar to the Sgr stars in McWilliam et al. (2013). Since there is no convincing offset between the LMC and Arcturus in r-process contributions, the offset in [La/Eu] is driven entirely by the s-process; specifically, the LMC is enhanced in heavy s-process elements.
7 Conclusion
This paper has presented detailed chemical abundances of two stars in the intermediate-age ( Gyr) LMC cluster NGC 1718. The analysis was performed differentially with respect to Arcturus. This differential analysis drastically reduces the systematic uncertainties that will occur in a typical abundance analysis; as a result, these abundances have high precision. Although two stars represent a small fraction of the stars in the cluster, several important findings are evident from this analysis.
-
1.
The two stars have nearly identical heliocentric radial velocities and abundance ratios, indicating that these stars are both cluster members.
-
2.
The abundances of these stars are similar to LMC disk and bar field stars, suggesting a) that the abundances of these stars represent the primordial abundances of the giant molecular cloud from which NGC 1718 formed, and b) that these stars are useful for investigating the chemical evolution of the LMC.
-
3.
The cluster is found to have an average metallicity of , a value which is consistent with the age-metallicity relationship for the LMC.
-
4.
The [Mg/Fe] ratios of the two stars are similar to LMC field stars, demonstrating that the low [Mg/Fe] derived by Colucci et al. (2012) from integrated light spectroscopy cannot be due to a low primordial Mg abundance in NGC 1718’s birth environment. Although no signs of Na, O, Mg, and/or Al spreads are seen between the two stars, this analysis cannot rule out the possibility that the low integrated [Mg/Fe] is due to star-to-star variations within the cluster, although this seems unlikely given the low mass and high metallicity of this cluster.
-
5.
The [X/Fe] ratios of the explosive elements Si, Ca, and Ti are moderately enhanced, at dex, which is slightly low compared to MW field stars. Relative to Ca, NGC 1718 shows deficiencies in elements which form via hydrostatic burning in massive stars; the deficiencies in Na, Mg, and Al are moderate, while those in O and Cu are strong.
-
6.
The iron-peak elements V and Mn are roughly consistent with MW and LMC field stars.
-
7.
The s-process abundances, specifically the [La/Y] ratios, indicate that the LMC disk was enriched by metal-poor AGB stars.
-
8.
NGC 1718 shows no enhancement in the r-process relative to MW field stars of similar metallicity.
The two NGC 1718 stars in this analysis track the chemical properties of the LMC field stars. With only two stars, this analysis cannot rule out the possibility of multiple populations in other cluster stars, and NGC 1718 therefore remains an interesting cluster for future study. Analyses of more stars at various evolutionary stages would be necessary to rule out any signs of abundance variations within the cluster. When NGC 1718 is utilized to probe the chemical evolution of the LMC, its high precision, differential abundances indicate that LMC’s chemical abundances can be explained by a “top light” IMF that is missing the highest mass stars, as was proposed for Sgr by McWilliam et al. (2013).
Acknowledgments
The authors thank the anonymous referee for comments that improved the manuscript. CMS and GW acknowledge funding from the Kenilworth Foundation. This publication makes use of data products from the Two Micron All Sky Survey, which is a joint project of the University of Massachusetts and the Infrared Processing and Analysis Center/California Institute of Technology, funded by the National Aeronautics and Space Administration and the National Science Foundation.
References
- Alonso et al. (1999) Alonso, A., Arribas, S., & Martínez-Roger, C. 1999, A&AS, 140, 261
- Asplund et al. (2009) Asplund, M., Grevesse, N., Sauval, J.A., & Scott, P. 2009, ARA&A, 47, 481
- Baumgardt et al. (2013) Baumgardt, H., Parmentier, G., Anders, P., & Grebel, E.K. 2013, MNRAS, 430, 676
- Bensby et al. (2005) Bensby, T., Feltzing, S., Lundström, I., & Ilyin, I. 2005, A&A, 433, 185
- Brocato et al. (2001) Brocato, E., Di Carlo, E., & Menna, G. 2001, A&A, 374, 523
- Burris et al. (2000) Burris, D.L., Pilachowski, C.A., Armandroff, T.E., et al. 2000, ApJ, 544, 302
- Buzzoni et al. (2010) Buzzoni, A., Patelli, L., Bellazzini, M., Fusi Pecci, F., & Oliva, E. 2010, MNRAS, 403, 1592
- Carretta et al. (2009) Carretta, E., Bragaglia, A., Gratton, R., & Lucatello, S. 2009, A&A, 505, 139
- Castelli & Kurucz (2004) Castelli, F. & Kurucz, R. L. 2004, in IAU Symp. 210, Modelling of Stellar Atmospheres, ed. N. Piskunov, W.W. Weiss, & D. F. Gray (San Francisco: ASP), A20
- Colucci et al. (2011) Colucci, J.E., Bernstein, R.A., Cameron, S.A., & McWilliam, A. 2011, ApJ, 735, 55
- Colucci et al. (2012) Colucci, J.E., Bernstein, R.A., Cameron, S.A., & McWilliam, A. 2012, ApJ, 746, 29
- Colucci et al. (2013) Colucci, J.E., Duran, M.F., Bernstein, R.A., & McWilliam, A. 2013, ApJ, 773, 36
- Colucci et al. (2014) Colucci, J.E., Bernstein, R.A., & Cohen, J.G. 2014, ApJ, 797, 116
- Colucci et al. (2016) Colucci, J.E., Bernstein, R.A., & McWilliam, A. 2016, ApJ, in press, arXiv:1611.02734
- D’Orazi et al. (2014) D’Orazi, V., Angelou, G.C., Gratton, R.G., et al. 2014, ApJ, 791, 39
- D’Orazi et al. (2015) D’Orazi, V., Gratton, R.G., Angelou, G.C., et al. 2015, MNRAS, 449, 4038
- Elson & Fall (1988) Elson, R.A. & Fall, S.M. 1988, AJ, 96, 1383
- Fishlock et al. (2014) Fishlock, C.K., Karakas, A.I., Lugaro, M., & Yong, D. 2014, ApJ, 797, 44
- Fulbright et al. (2006) Fulbright, J.P., McWilliam, A., & Rich, R.M. 2006, ApJ, 636, 821
- Fulbright et al. (2007) Fulbright, J.P., McWilliam, A., & Rich, R.M. 2007, ApJ, 661, 1152
- González Hernández & Bonifacio (2009) González Hernández, J.I. & Bonifacio, P. 2009, A&A, 497, 497
- Gratton et al. (2012) Gratton, R.G., Carretta, E., & Bragaglia, A. 2012, The Astrononmy and Astrophysics Review, 20, 50
- Grocholski et al. (2006) Grocholski, A.J., Cole, A.A., Sarajedini, A., Geisler, D., & Smith, V.V. 2006, AJ, 132, 1630
- Hendricks et al. (2016) Hendricks, B., Boeche, C., Johnson, C.I., et al. 2016, A&A, 585, A86
- Hinkle et al. (2003) Hinkle, K., Wallace, L., Livingston, W., Ayres, T., Harmer, D., & Valenti, J. 2003, in The Future of Cool-Star Astrophysics: 12th Cambridge Workshop on Cool Stars, Stellar Systems, and the Sun (2001 July 30 - August 3), eds. A. Brown, G.M. Harper, and T.R. Ayres, (University of Colorado), 851
- Hollyhead et al. (2016) Hollyhead, K., Kacharov, N., Lardo, C., et al. 2016, MNRAS, arXiv:1609.01302
- Johnson et al. (2006) Johnson, J.A., Ivans, I.I., & Stetson, P.B. 2006, ApJ, 640, 801
- Kelson (2003) Kelson, D.D. 2003, PASP, 115, 688
- Kerber et al. (2007) Kerber, L.O., Santiago, B.X., & Brocato, E. 2007, A&A, 462, 139
- Kirby et al. (2016) Kirby, E.N., Guhathakurta, P., Zhang, A.J., et al. 2016, ApJ, 819, 135
- Koch & McWilliam (2008) Koch, A. & McWilliam, A. 2008, AJ, 135, 1551
- Kraft & Ivans (2003) Kraft, R.P, & Ivans, I.I. 2003, PASP, 115, 143
- Lambert & Ries (1981) Lambert, D.L. & Ries, L.M. 1981, ApJ, 248, 228
- Lapenna et al. (2012) Lapenna, E., Mucciarelli, A., Origlia, L., & Ferraro, F.R. 2012, ApJ, 761, 33
- Lind et al. (2009) Lind, K., Asplund, M., & Barklem, P.S. 2009, A&A, 503, 541
- Lind et al. (2011) Lind, K., Asplund, M., Barklem, P.S., & Belyaev, A.K. 2011, A&A, 528, 103
- Mackey & Gilmore (2003) Mackey, A.D. & Gilmore, G.F. 2003, MNRAS, 338, 85
- Martell et al. (2016) Martell, S., Shetrone, M., Lucatello, S., et al. 2016, arXiv:1605.05792
- Mashonkina et al. (2000) Mashonkina, L.I., Shimanskiĭ, V.V., & Sakhibullin, N.A. 2000, Astronomy Reports, 44, 790
- McCall (2004) McCall, M.L. 2004, AJ, 128, 2144
- McWilliam et al. (1995) McWilliam, A., Preston, G.W., Sneden, C., & Searle, L. 1995b, AJ, 109, 2757
- McWilliam et al. (2013) McWilliam, A., Wallerstein, G., & Mottini, M. 2013, ApJ, 778, 149
- Meszaros et al. (2015) Meszaros, S., Martell, S.L., Shetrone, M., et al. 2015, AJ, 149, 153
- Mucciarelli et al. (2008) Mucciarelli, A., Carretta, E., Origlia, L., & Ferraro, F.R. 2008, AJ, 136, 375
- Mucciarelli et al. (2009) Mucciarelli, A., Origlia, L., Ferraro, F.R., & Pancino, E. 2009, ApJ, 695, 134
- Mucciarelli et al. (2010) Mucciarelli, A., Origlia, L., & Ferraro, F.R. 2010, ApJ, 717, 277
- Mucciarelli et al. (2011) Mucciarelli, A., Cristallo, S., Brocato, E., et al. 2011, MNRAS, 413, 837
- Mucciarelli et al. (2014a) Mucciarelli, A., Dalessandro, E., Ferraro, F.R., Origlia, L., & Lanzoni, B. 2014a, ApJ, 793, 6
- Mucciarelli et al. (2014b) Mucciarelli, A., Salaris, M., Bonifacio, P., Monaco, L., & Villanova, S. 2014b, MNRAS, 444, 1812
- Niederhofer et al. (2016) Niederhofer, F., Bastian, N., Kozhurina-Platais, V., Hilker, M., de Mink, S.E., Cabrera-Ziri, I., Li, C., & Ercolano, B. 2016, A&A, 586, 148
- Piatti et al. (2012) Piatti, A.E., Geisler, D., & Mateluna, R. 2012, AJ, 144, 100
- Pietrinferni et al. (2004) Pietrinferni, A., Cassisi, S., Salaris, M. & Castelli, F. 2004, ApJ, 612, 168
- Pompéia et al. (2008) Pompéia, L., Hill, V., Spite, M., et al. 2008, A&A, 480, 379
- Pritzl et al. (2005) Pritzl, B.J., Venn, K.A., & Irwin, M. 2005, AJ, 129, 2232
- Qian & Wasserburg (2008) Qian, Y.-Z. & Wasserburg, G.J. 2008, ApJ, 687, 272
- Reddy et al. (2006) Reddy, B.E., Lambert, D.L., & Prieto, C.A. 2006, MNRAS, 367, 1329
- Sakari et al. (2011) Sakari, C.M., Venn, K.A., Irwin, M., Aoki, W., Arimoto, D., & Dotter, A. 2011, ApJ, 740, 106
- Sakari et al. (2013) Sakari, C.M., Shetrone, M., Venn, K., McWilliam, A., & Dotter, A. 2013, MNRAS, 434, 358
- Sakari et al. (2014) Sakari, C.M., Venn, K., Shetrone, M., Dotter, A., & Mackey, D. 2014, MNRAS, 443, 2285
- Sakari et al. (2015) Sakari, C.M., Venn, K.A., Mackey, D., et al. 2015, MNRAS, 448, 1314
- Sakari et al. (2016) Sakari, C.M., Shetrone, M.D., Schiavon, R.P., et al. 2016, ApJ, in press
- Schlafly & Finkbeiner (2011) Schlafly, E.F. & Finkbeiner, D.P. 2011, ApJ, 737, 103
- Shetrone et al. (2003) Shetrone, M., Venn, K., Tolstory, E., et al. 2003, AJ, 125, 684
- Simmerer et al. (2004) Simmerer, J., Sneden, C., Cowan, J.J., Collier, J., Woolf, V.M., & Lawler, J.E. 2004, ApJ, 617, 1091
- Skrutskie et al. (2006) Skrutskie, M.F., Cutri, R.M., Stiening, R., et al. 2006, AJ, 131, 1163
- Smecker-Hane & McWilliam (2002) Smecker-Hane, T.A. & McWilliam, A. 2002, arXiv:0205411
- Sneden (1973) Sneden, C. 1973, ApJ, 184, 839
- Sneden et al. (1997) Sneden, C., Kraft, R.P., Shetrone, M.D., Smith, G.H., Langer, G.E., & Prosser, C.F. 1997, AJ, 114, 1964
- Stetson & Pancino (2008) Stetson, P.B. & Pancino, E. 2008, PASP, 120, 1332
- Tsujimoto & Bekki (2012) Tsujimoto, T. & Bekki, K. 2012, ApJ, 751, 35
- Tsujimoto & Shigeyama (2014) Tsujimoto, T. & Shigeyama, T. 2014, ApJ, 795, L18
- Van der Swaelmen et al. (2013) Van der Swaelmen, M., Hill, V., Primas, F., & Cole, A.A. 2013, A&A, 560, A44
- Venn et al. (2004) Venn, K.A., Irwin, M., Shetrone, M.D., et al. 2004, AJ, 128, 1177
- Woosley & Weaver (1995) Woosley, S.E. & Weaver, T.A. 1995, ApJS, 101, 181
- Yan et al. (2015) Yan, H.L., Shi, J.R., & Zhao, G. 2015, ApJ, 802, 36
Appendix A Error Analysis
In this work the uncertainties in the abundance measurements are computed using equations similar to those employed by McWilliam et al. (1995) and McWilliam et al. (2013). The uncertainty in the adopted Teff is based on the scatter in the slope of the plot of Fe I abundance with EP, plus the uncertainty of 29K in the temperature of Arcturus (used in the differential abundance analysis), which was added in quadrature. The resultant 1 Teff uncertainty of 51K (see Table 7) is obtained for both stars. The adopted model atmosphere surface gravities were taken from BaSTI isochrones (Pietrinferni et al. 2004), with an age of 2 Gyr and appropriate metallicity, based on the adopted temperature (see Section 3); the temperature uncertainty and an age uncertainty of 1 Gyr were then used to estimate 1 on log g of 0.089 dex cm s-2. This method for adopting gravity resulted in a significant covariance between Teff and log g, for which a temperature-gravity covariance, , of 4.42 is found. The computed variances and covariance for the remaining atmospheric parameters are found following McWilliam et al. (2013), and are shown in Table 7.
| Parameters | Variance/covariance |
|---|---|
a The computed covariance values are sufficiently small that zero
is adopted.
The uncertainty in an average abundance ratio, , was found using an expansion similar to Equation A16 in McWilliam et al. (1995):
| (1) |
The abundance sensitivity to atmospheric parameters for the lines in Section 4 was computed for NGC 1718-26 and appears in Table 8; these gradients were subsequently employed with the variances, covariances, and Equation A to determine abundance ratio uncertainties. The final uncertainties in [X/H], [X/\textFe 1] and [X/\textFe 2] appear in Table 9.
| Teff (K) | log g (dex) | (km s-1) | [M/H] (dex) | ||||||||
|---|---|---|---|---|---|---|---|---|---|---|---|
| 50 | 50 | 0.2 | 0.2 | 0.3 | 0.3 | 0.1 | 0.1 | ||||
| Fe I | 0.03 | 0.03 | 0.04 | 0.07 | 0.09 | 0.11 | 0.03 | 0.04 | |||
| Fe II | 0.12 | 0.12 | 0.07 | 0.16 | 0.05 | 0.07 | 0.05 | 0.08 | |||
| [O I] | 0.01 | 0.02 | 0.08 | 0.09 | 0.03 | 0.04 | 0.04 | 0.05 | |||
| Na I | 0.04 | 0.04 | 0.02 | 0.00 | 0.08 | 0.09 | 0.01 | 0.01 | |||
| Mg I | 0.04 | 0.04 | 0.01 | 0.05 | 0.03 | 0.03 | 0.02 | 0.03 | |||
| Al I | 0.02 | 0.02 | 0.00 | 0.01 | 0.05 | 0.06 | 0.01 | 0.02 | |||
| Si I | 0.07 | 0.07 | 0.03 | 0.09 | 0.04 | 0.05 | 0.03 | 0.05 | |||
| Ca I | 0.05 | 0.05 | 0.00 | 0.01 | 0.07 | 0.10 | 0.01 | 0.01 | |||
| Ti I | 0.05 | 0.05 | 0.03 | 0.03 | 0.11 | 0.14 | 0.03 | 0.03 | |||
| Ti II | 0.04 | 0.04 | 0.07 | 0.11 | 0.04 | 0.05 | 0.04 | 0.05 | |||
| V I | 0.08 | 0.03 | 0.07 | 0.03 | 0.16 | 0.22 | 0.06 | 0.02 | |||
| Mn I | 0.01 | 0.00 | 0.04 | 0.07 | 0.13 | 0.14 | 0.03 | 0.04 | |||
| Ni I | 0.03 | 0.03 | 0.05 | 0.08 | 0.09 | 0.11 | 0.03 | 0.05 | |||
| Cu I | 0.01 | 0.00 | 0.06 | 0.09 | 0.11 | 0.13 | 0.04 | 0.05 | |||
| Rb I | 0.06 | 0.06 | 0.01 | 0.00 | 0.01 | 0.01 | 0.01 | 0.01 | |||
| Y II | 0.02 | 0.02 | 0.07 | 0.09 | 0.02 | 0.02 | 0.04 | 0.05 | |||
| Zr I | 0.06 | 0.07 | 0.03 | 0.03 | 0.21 | 0.26 | 0.03 | 0.04 | |||
| La II | 0.01 | 0.02 | 0.08 | 0.09 | 0.03 | 0.04 | 0.04 | 0.05 | |||
| Eu II | 0.01 | 0.00 | 0.07 | 0.09 | 0.03 | 0.03 | 0.04 | 0.05 | |||
It is notable that the systematic uncertainty on [\textFe 1/H] in Table 9 is quite small; this is apparently due to the covariance between the effects of Teff and on [\textFe 1/H]: for the \textFe 1 and II lines in these cool stars an increase in temperature results in a slightly lower \textFe 1 abundance (due to excitation); however, this change in the \textFe 1 abundance is compensated-for by the corresponding change in . The same temperature change results in a relatively large decrease in the derived \textFe 2 abundance, presumably due to an increase in Fe ionization. Table 9 also shows that for most abundance ratios [X/\textFe 1] exhibits smaller systematic uncertainty than [X/\textFe 2], even for ionized metals and [\textO 1] lines; thus, the [X/\textFe 1] abundance ratios provide the most reliable estimate.
Note that the implied systematic errors in abundance ratios are only as good as the input variances, co-variances and abundance sensitivity to atmosphere parameters. For an element ratio where the actual systematic abundance sensitivity is small, small errors in the adopted inputs to Equation A can result in a negative computed variance, implying unrealistic, or imaginary, 1 uncertainties, when they are simply close to zero; in this case, the uncertainty in the ratio is dominated by the random error component.
| Atmosphere Uncertainties | ||||||
|---|---|---|---|---|---|---|
| Ion | [X/H] | [X/Fe I] | [X/Fe II] | [X/Fe I] | [X/Fe II] | |
| Fe I | 0.009 | … | 0.066 | 0.01b | … | |
| Fe II | 0.073 | 0.066 | … | … | ||
| [O I] | 0.053 | 0.059 | 0.125 | 0.09 | ||
| Na I | 0.036 | 0.044 | 0.110 | 0.08 | ||
| Mg I | 0.028 | 0.021 | 0.046 | 0.05 | ||
| Al I | 0.023 | 0.030 | 0.096 | 0.08 | ||
| Si I | 0.046 | 0.039 | 0.028 | 0.05 | ||
| Ca I | 0.053 | 0.060 | 0.126 | 0.12 | ||
| Ti I | 0.064 | 0.071 | 0.137 | 0.08 | ||
| Ti II | 0.009 | 0.006 | 0.071 | 0.10 | ||
| V I | 0.078 | 0.085 | 0.150 | 0.12 | ||
| Mn I | 0.020 | 0.026 | 0.092 | 0.12 | ||
| Ni I | 0.007 | 0.004 | 0.070 | 0.05 | ||
| Cu I | 0.028 | 0.034 | 0.100 | 0.11 | ||
| Rb I | 0.063 | 0.070 | 0.136 | 0.11 | ||
| Y II | 0.016 | 0.021 | 0.087 | 0.08 | ||
| Zr I | 0.079 | 0.086 | 0.152 | 0.10 | ||
| La II | 0.053 | 0.059 | 0.125 | 0.09 | ||
| Eu II | 0.031 | 0.036 | 0.102 | 0.06 | ||
Notes: a For species with more than one measured line, random abundance errors, due to EW
uncertainties, were adopted from the 1 dispersion about the mean abundances.
b Instead of [X/Fe], [Fe/H] ratios are provided.
c Random abundance errors for O, Cu and Eu were computed including estimates of the 1
SS measurement uncertainties.