Pulsator-like spectra from Ultraluminous X-ray sources and the search for more ultraluminous pulsars
Abstract
Ultraluminous X-ray sources (ULXs) are a population of extragalactic objects whose luminosity exceeds the Eddington limit for a 10 M⊙ black hole (BH). Their properties have been widely interpreted in terms of accreting stellar-mass or intermediate-mass BHs. However at least three neutron stars (NSs) have been recently identified in ULXs through the discovery of periodic pulsations. Motivated by these findings we studied the spectral properties of a sample of bright ULXs using a simple continuum model which was extensively used to fit the X-ray spectra of accreting magnetic NSs in the Galaxy. We found that such a model, consisting of a power-law with a high-energy exponential cut-off, fits very well most of the ULX spectra analyzed here, at a level comparable to that of models involving an accreting BH. On these grounds alone we suggest that other non-pulsating ULXs may host NSs. We found also that above 2 keV the spectrum of known pulsating ULXs is harder than that of the majority of the other ULXs of the sample, with only IC 342 X-1 and Ho IX X-1 displaying spectra of comparable hardness. We thus suggest that these two ULXs may host an accreting NS and encourage searches for periodic pulsations in the flux.
Subject headings:
stars: neutron – (stars:) pulsars: general – X-rays: individual (NGC 7793 P13, NGC 5907 X-1, IC 342 X-1, Ho IX X-1, Ho II X-1, NGC 5408 X-1, NGC 1313 X-1, NGC 1313 X-2, NGC 5204 X-1, NGC 55 ULX1, NGC 5643 ULX1, NGC 6946 X-1)1. Introduction
Ultraluminous X-ray sources (ULXs) are a class of extragalactic, point-like sources with luminosity from erg s-1 up to erg s-1, in excess of the Eddington limit for a 10 black hole (BH) (e.g. Fabbiano 2006). Such a high X-ray luminosity suggests that they host either intermediate mass BHs accreting at sub-Eddington rate (Colbert & Mushotzky 1999; Miller et al. 2004), or super-Eddington accreting BHs of stellar mass or of stellar origin (e.g. Gladstone et al. 2009; Feng & Soria 2011). In particular, the most luminous ULXs ( erg s-1) are usually considered as the best intermediate mass BH candidates (e.g. Sutton et al. 2012), while less luminous sources could be super-Eddington accreting BHs with masses in the range 5–80 M⊙ (e.g. Zampieri & Roberts 2009). The recent discovery of three pulsating neutron stars (NSs) in the ULX M82 X-2 (Bachetti et al. 2014), NGC 7793 P13 and NGC 5907 X-1 (Israel et al. 2016a, Israel et al. 2016b) proved that ULXs can be powered by objects different from BHs.
The ULXs spectra are generally described in terms of a cold (kT keV) soft thermal component coupled to a high-energy component with a cut-off below 10 keV (e.g. Sutton et al. 2013; Bachetti et al. 2013; Pintore et al. 2014; Middleton et al. 2015). The soft component is possibly associated to the photosphere of strong outflows ejected from the accretion disc at super-Eddington rates (e.g. Poutanen et al. 2007; Ohsuga & Mineshige 2011), while the high-energy component might come from the bare inner accretion disc or from an optically-thick corona close to the BH (e.g. Middleton et al. 2015). However, the quality of ULX spectra is generally low and the interpretation of their spectral properties is still matter of debate.
By exploiting the recent availability of broadband X-ray data obtained with the XMM-Newton and NuSTAR satellites, we carried out a comprehensive spectral analysis of a large sample of the brightest ULXs. Several previous investigations focussed on the phenomenological characterization of the spectra of ULXs (e.g Gonçalves & Soria 2006; Stobbart et al. 2006; Gladstone et al. 2009; Pintore & Zampieri 2012; Sutton et al. 2013; Pintore et al. 2014). Motivated by the discovery of X-ray pulsations from M82 X-2 and subsequently from NGC 7793 P13 and NGC 5907 X-1, we adopted a simple spectral model that was extensively used to fit the X-ray continuum of accreting magnetic NSs, especially X-ray pulsators in Galactic high mass X-ray binaries (for more details see White et al. 1983, 1995; Coburn et al. 2001). The model consists of a power-law with a high-energy exponential cut-off plus a blackbody; we find that in most cases the ULX spectra are well fit by such a model, indicating that different interpretations of the ULX spectra are possible.
2. Observations and data analysis
| Source. | Obs.ID | Date | Exp. | Obs.ID | Date | Exp | Epoch |
| XMM-Newton | (ks) | NuSTAR | (ks) | ||||
| NGC 5907 X-1 | 0724810401 | 2013-11-12 | 33.5 | 30002039005 | 2013-11-12 | 113 | 1 |
| 0729561301 | 2014-07-09 | 42.0 | 80001042002 | 2014-07-09 | 57.1 | 2 | |
| - | - | - | 80001042004 | 2014-07-12 | 56.3 | 2 | |
| NGC 7793 P13 | 0693760401 | 2013-11-25 | 46.0 | - | - | - | 1 |
| 0748390901 | 2014-12-10 | 47.0 | - | - | - | 2 | |
| NGC 55 ULX-1 | 0028740101 | 2001-11-15 | 28.3 | - | - | - | 1 |
| 0655050101 | 2010-05-24 | 124.0 | - | - | - | 2 | |
| NGC 1313 X-1 | 0150280301 | 2003-12-21 | 10.3 | - | - | - | 1 |
| 0693851201 | 2012-12-22 | 125.2 | 30002035004 | 2012-12-16 | 127.0 | 2 | |
| NGC 1313 X-2 | 0405090101 | 2012-12-16 | 123.3 | - | - | - | 1 |
| 0693851201 | 2012-12-22 | 125.2 | 30002035004 | 2012-12-16 | 127.0 | 2 | |
| IC 342 X-1 | 0693850601 | 2012-08-11 | 59.9 | 30002032003 | 2012-08-10 | 98.6 | 1 |
| 0693851301 | 2012-08-17 | 60.0 | 30002032005 | 2012-08-16 | 127.4 | 2 | |
| Ho II X-1 | 0200470101 | 2004-04-15 | 93.5 | - | - | - | 1 |
| 0724810101 | 2013-09-09 | 12.3 | 30001031002 | 2013-09-09 | 31.4 | 2 | |
| - | - | - | 30001031003 | 2013-09-09 | 79.4 | 2 | |
| 0724810301 | 2013-09-17 | 12.0 | 30001031005 | 2013-09-17 | 111.1 | 2 | |
| Ho IX X-1 | 0200980101 | 2004-09-26 | 117 | - | - | - | 1 |
| - | - | - | 30002033005 | 2012-11-11 | 40.7 | 2 | |
| 0693851701 | 2012-11-12 | 9.92 | 30002033006 | 2012-11-11 | 35.2 | 2 | |
| 0693851801 | 2012-11-14 | 13.8 | 30002033008 | 2012-11-14 | 14.5 | 2 | |
| 0693851101 | 2012-11-16 | 13.3 | 30002034010 | 2012-11-15 | 49.0 | 2 | |
| NGC 5204 X-1 | 0405690201 | 2006-11-19 | 43.5 | - | - | - | 1 |
| 0693851401 | 2013-04-21 | 16.9 | 30002037002 | 2013-04-19 | 96.0 | 2 | |
| NGC 5408 X-1 | 0653380501 | 2011-01-28 | 124.1 | - | - | - | 1 |
| NGC 5643 ULX-1 | 0744050101 | 2014-08-27 | 114.0 | - | - | - | 1 |
| NGC 6946 X-1 | 0691570101 | 2012-10-21 | 114.3 | - | - | - | 1 |
We analyzed a sample of 12 ULXs, including two ULX pulsars, located at distances lower than 15 Mpc, which shows a broad luminosity range spanning from erg s-1 to erg s-1. The sources have available XMM-Newton and, in some cases, simultaneous (or nearly simultaneous) NuSTAR observations of good quality which allow us to put robust constraints on the high energy curvature of their X-ray spectrum (i.e. with at least 10000 counts in the XMM-Newton EPIC instruments, as shown in Gladstone et al. 2009). Our sample is similar to those analyzed in several previous studies (e.g. Stobbart et al. 2006; Gladstone et al. 2009; Pintore et al. 2014; Middleton et al. 2015) and offers an overall picture of the spectral properties displayed by ULXs. In order to extract individual spectra with better statistics, observations of the same source obtained within time intervals of a few days were merged if no significant spectral variations were present. Data taken at very different times and/or showing different spectral states were instead considered as individual observations. Additionally to this selection, we also considered, for each source, the observations with the largest source spectral variability. We list in Table 1 the observations that are used in this work.
The data of the XMM-Newton EPIC instrument (Strüder et al. 2001; Turner et al. 2001) were reduced using SAS v.14.0.0. We extracted spectra from events with pattern for EPIC-pn (single- and double-pixel events) and pattern for EPIC-MOS (single- and multiple-pixel events). We set ‘flag=0’ in order to exclude bad pixels and events coming from the CCD edges and removed time intervals with high background. The spectra were extracted from circular regions with radius of 30′′ and 65′′ for source and background, respectively.
The NuSTAR data were reduced with the standard pipeline, based on the NuSTAR Data Analysis Software v1.3.0 (NUSTARDAS) in the HEASOFT ftools v6.16. We obtained cleaned event files by applying the standard corrections. Spectra were extracted from circular regions of radius 40′′ and 60′′ for source and background, respectively.
All XMM-Newton and NuSTAR spectra were rebinned so as to have at least 25 and 100 counts per bin, respectively, so that minimum fitting techniques could be used; model fitting was carried out using XSPEC v.12.8.2 (Arnaud 1996). The spectra of the pn and the two MOS cameras, and (when available) of the NuSTAR detectors were fit together, for each epoch. A multiplicative factor was included to account for possible inter-calibration uncertainties, which were in most cases smaller than 10%. We considered the 0.3–10 keV and 3–70 keV energy range for EPIC and NuSTARdata, respectively.
3. Results
3.1. Broadband spectral analysis
We fit the spectra with an absorbed power-law with an exponential cut-off characterized by two parameters, the cut-off energy and the folding energy : (highecutpowerlaw in xspec), with the exponential part acting for . In most cases, an additional soft component, that we model with a blackbody for simplicity, is needed. This model was extensively applied in the past to fit the X-ray continuum of accreting magnetic NSs, notably X-ray pulsators in high mass X-ray binaries. In those systems the hard component is believed to originate in a magnetic accretion-column close to the NS surface, whereas the soft blackbody-like component is usually ascribed to emission from the inner edge of the disk at the magnetospheric boundary (e.g. White et al. 1995; Coburn et al. 2001).
NGC 5907 X-1 was observed six times with XMM-Newton (e.g. Israel et al. 2016b, Fuerst et al. 2016) and good quality spectra are available for the observations of February 2003, February 2012, November 2013 and July 2014. Simultaneous and quasi-simultaneous NuSTAR data are available for the 2013 and 2014 observations. The fit of the 2003, 2012 and 2014 spectra give results consistent within the errors with absence of spectral variability, as also found by Fuerst et al. (2016). We therefore report here only the results from the 2014 observations which are of higher quality and can be complemented with NuSTAR data. They can be fit by a highecutpowerlaw alone (no soft component) with photon index 1.5, Ec = 5.5 keV and Ef = 8.3 keV. The 2013 spectrum, obtained when the source was about a factor of 2-3 fainter than in 2014, is slightly softer (1.9), but it can still be fit by a cut-off power-law without the addition of a soft component.
For NGC 7793 P13, we use two observations taken in 2013 and 2014 (no NuSTAR data are available). Both observations give similar results, requiring a thermal component with temperature kT0.2 keV in addition to a cut-off power-law with 1.1. Another XMM-Newton observation, obtained in May 2012 when the source was much fainter, provides a less constraining spectrum, but consistent in spectral shape with those of 2013 and 2014.
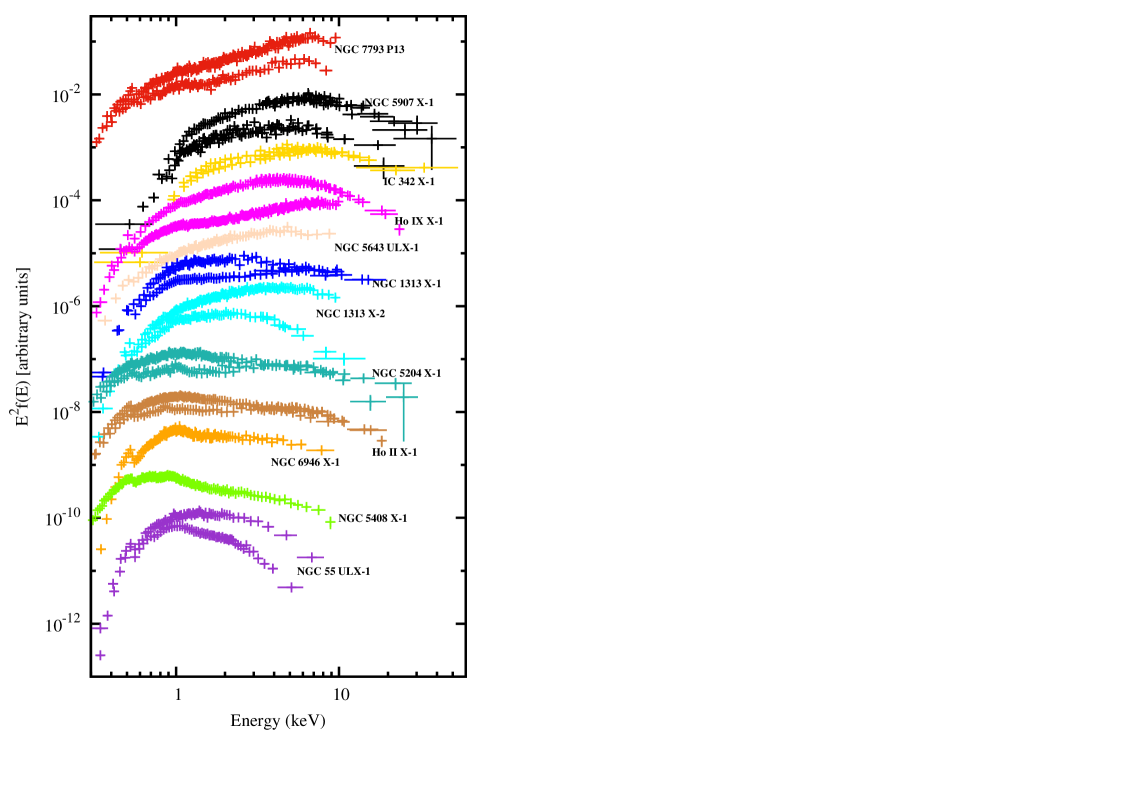
For all other ULXs in our sample, several XMM-Newton and NuSTAR observations are available. We analyze all the available good quality spectra, finding in most cases evidence for spectral variability, as already reported in the literature (e.g. Sutton et al. 2013; Pintore et al. 2014; Middleton et al. 2015). To illustrate the range of possible states in which the sources can be found, we plot in Fig. 1 the two representative spectra of each ULX, choosing for each source the observations with the hardest and softest spectrum (see section 2). These are the observations reported in Table 1, with corresponding best fit parameters listed in Table 2.
| Src. | Epoch | TBabs | bbody | highecut | powerlaw | gabs | |||||||
| NH | kTin | Norm | Ec | Ef | Norm | Energy | Strenght | La | |||||
| 1022 cm-2 | keV | keV | keV | 10-3 | keV | keV | erg s-1 | ||||||
| NGC 5907 X-1 | 1 | - | - | - | - | - | 4.2 | 149.44/173 | |||||
| 2 | - | - | - | - | - | 10.9 | 442.90/442 | ||||||
| NGC 7793 P13 | 1 | - | - | - | 0.21 | 357.49/325 | |||||||
| 2 | - | - | - | 0.53 | 629.78/563 | ||||||||
| NGC 55 ULX-1 | 1 | - | - | - | 0.26 | 700.77/688 | |||||||
| 2 | 0.23 | 270.40/243 | |||||||||||
| NGC 1313 X-1 | 1 | - | - | - | 1.67 | 250.54/229 | |||||||
| 2 | - | - | - | 1.07 | 1703.40/1718 | ||||||||
| NGC 1313 X-2 | 1 | - | - | - | - | - | 1.05 | 820.64/860 | |||||
| 2 | - | - | - | 0.28 | 1020.57/987 | ||||||||
| IC 342 X-1 | 1 | - | - | - | 0.43 | 937.17/981 | |||||||
| 2 | - | - | - | - | - | 0.51 | 1061.76/1063 | ||||||
| Ho II X-1 | 1 | - | - | - | 1.2 | 1317.83/1317 | |||||||
| 2 | - | - | - | 0.88 | 800.29/785 | ||||||||
| Ho IX X-1 | 1 | - | - | - | 1.4 | 2191.03/2043 | |||||||
| 2 | - | - | - | 3.8 | 1546.80/1433 | ||||||||
| NGC 5204 X-1 | 1 | - | - | - | 0.81 | 837.88/821 | |||||||
| 2 | - | - | - | 0.50 | 414.06/414 | ||||||||
| NGC 5408 X-1 | 1 | 0.87 | 1035.47/990 | ||||||||||
| NGC 5643 ULX-1 | 1 | - | - | - | - | - | 2.98 | 865.07/934 | |||||
| NGC 6946 X-1 | 1 | 0.9 | 613.68/637 | ||||||||||
Generally, the “pulsator-like” model gives good fits, except for a few cases in which the soft thermal component is not strictly required (i.e. IC 342 X-1 in August 2012, and NGC 1313 X-2 in December 2012). In all other cases, blackbody components with temperatures in the range 0.15–0.3 keV are required. A variety of power-law spectral slopes and cut-off parameters is found (Table 2).
The relatively large values obtained in the fit of Ho IX X-1 are caused by some excess emission at high energy, possibly indicating the presence of a further hard tail component, as discussed in Walton et al. (2014a). We note that hard tails are observed also in the spectra of some Galactic accreting NSs (e.g. McClintock & Remillard 2006).
Finally, the spectra of NGC 55 ULX1, NGC 5408 X-1, and NGC 6946 show some residuals around 1 keV, as already reported in literature (e.g. Middleton et al. 2014). These features have been associated lately to a blending of unresolved emission and absorption lines produced by the photosphere of a possible outflowing wind in a scenario of super-Eddington accretion on a stellar mass compact object (Pinto et al. 2016). For the three sources, we find that good fits are obtained with the addition of one or two broad Gaussian absorption lines centered at 0.7 keV and 1.2 keV and with widths keV.
3.2. Characterization of the hard component
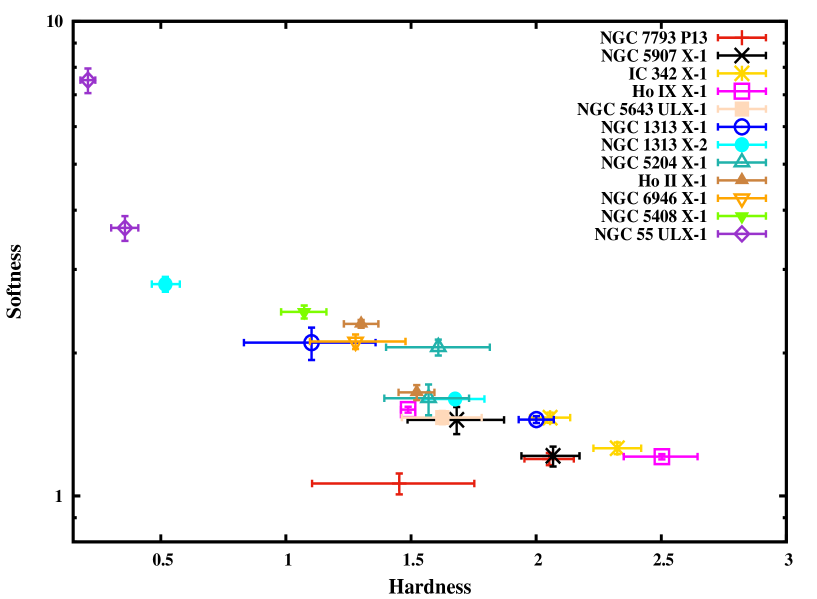
We found that the “pulsator-like” model can describe well the spectra of virtually all the ULXs of our sample. Different broad band spectral shapes and best fit parameters characterize different sources (see Fig. 1 and Table 2). This is particularly evident at low energy, where, besides the effect of different absorption column densities (from cm-2 to cm-2), the relative importance of the soft component can differ significantly (even if similar temperatures around kT0.2 keV are found). Spectral differences are apparent also at higher energies, where the spectrum is dominated by the cut-off power-law component. In order to study in greater detail differences in the harder spectral component (where the effects due to absorption and the additional soft component are negligible), search for correlations with other source properties, and possibly gather information on the innermost regions of the accretion flow close to the compact object, we characterize the high-energy spectra through a color-color diagram. This was done by using the fluxes in the 2–4 keV, 4–6 keV and 6–30 keV energy bands derived from the best-fit of Table 2. We present the color-color diagram in figure 2, where we defined the hardness as the (6–30 keV)/(4–6 keV) ratio and the softness as (2–4 keV)/(4–6 keV) ratio. We note that the fluxes above 10 keV are estimated directly from the spectra only in the cases where NuSTAR observations are available. In the other cases, the fluxes are calculated from an extrapolation of the 0.3–10 keV best-fit model. As expected, sources displaying spectral variations move across different regions in this diagram (note again that we pre-selected the most different spectra of each source) Several of the sources with parameters around hardness1.5 and softness1.5 become either softer (i.e. move toward the upper-left corner of the figure) or harder (i.e. move toward the lower-right corner), but none of them shows both behaviors. This leads to a distinction between two different classes of softer and harder ULXs. A similar conclusion was reached in e.g. Sutton et al. (2013) and Pintore et al. (2014) based on a different spectral analysis.
We highlight that the two known ULX pulsars in the sample lie in the region of the color-color diagram that corresponds to the hardest spectra. Their hardness values are close to the maximum but still within the broad distribution of the ULXs in our sample. We applied a Kolmogorov-Smirnov test (KS) to the distribution of the softness of pulsating and non-pulsating ULXs finding a KS-statistics of and a p-value of that they are drawn from the same sample. Although with the current limited sample it is difficult to obtain firm conclusions, it is interesting to note that also the ULX pulsar M82 X-2 has a rather hard spectrum111Unfortunately, good quality XMM-Newton spectral data are not available for the ULX pulsar M82 X-2, owing to contamination from the bright nearby ULX M82 X-1. (Brightman et al. 2016a, b).
We note that NGC 7793 P13 attained the lowest values of the softness ratio of the whole sample. During the epoch 1 observation, when no pulsations were found in the timing data (Israel et al. 2016b, a), the spectrum of NGC 5907 X-1 was close to the center of the distribution in Fig. 2. In 2014, when pulsations were detected, the position of NGC 5907 X-1 in the color-color diagram was closer to that of NGC 7793 P13. Hence, when pulsations were seen, the two ULX pulsars were significantly hard. The only sources that, at least on one epoch, had spectral parameters similar to those of the ULX pulsars are IC 342 X-1 and Ho IX X-1.
4. Discussion
In previous studies, ULX spectra characterized by a curvature above 3–5 keV and a soft excess below 1 keV were described in terms of physically-motivated spectral models for accreting BHs of different masses (e.g. Stobbart et al. 2006; Gladstone et al. 2009; Pintore & Zampieri 2012; Sutton et al. 2013; Bachetti et al. 2013; Walton et al. 2013). Inspired by the recent discovery of pulsations in three ULXs (Bachetti et al. 2014; Israel et al. 2016a, b), we applied here a model that has been commonly used to fit the X-ray continuum of accreting magnetic NSs (e.g. White et al. 1995) to good quality XMM-Newton and NuSTAR spectra of a sample of bright ULXs. Such model, highecutpowerlaw plus a soft blackbody, was introduced empirically (see White et al. 1995, and references therein) and later found to be similar to the spectra calculated from models of bulk and thermal Comptonization in magnetic accretion models (Becker & Wolff 2007) which have also been employed to fit the spectra of a few X-ray pulsars in HMXBs (Farinelli et al. 2016). The shape of its exponential cutoff is regulated by two parameters (the e-folding energy and the cutoff energy ), through which the spectra with vastly different curvature observed in accreting X-ray pulsars at high energies (usually keV) can be fitted. In this work we found that this “pulsator-like” continuum model, together with a soft component, can be successfully used to describe also the overall shape of the spectra of bright ULXs222As with other continuum models for ULXs, in a few cases the addition of broad absorption-like features (e.g. Pinto et al. 2016) and/or a high energy tail (e.g. Walton et al. 2014b; Mukherjee et al. 2015) proved necessary in order to make the fit acceptable. This suggests also that accreting BH-based models usually adopted for ULXs (e.g. disc blackbody plus Comptonization) do not necessarily have the interpretative power that has been attributed to them.
In our spectral fits, the soft blackbody component has a temperature of 0.1-0.3 keV in all sources, but its relative importance differs across different spectra and sources. The equivalent radius of the thermally emitting region, inferred from the normalization of the blackbody component, is typically larger than 100 km. This value rules out any association with the putative NS surface, but may be consistent with the size of the emitting region of the disc close to the co-rotation radius, as in the case of some X-ray pulsators and ULX pulsars (Israel et al. 2016a, b). Alternatively, since pulsating ULXs have super-Eddington accretion rates, the soft component may originate in a powerful outflow that is ejected from the accretion disc (e.g. Poutanen et al. 2007; Ohsuga & Mineshige 2011; Middleton et al. 2015).
The best fit values derived with the highecut powerlaw for the hard component span a fairly large range, both in spectral slope and cut-off and folding energies, as observed also in galactic accreting X-ray pulsars. This component is believed to arise in the post-shock region of the accretion column above the surface of the neutron star. Recent analytical calculations, as well as 2D radiation-hydro-simulations of accretion onto magnetized NSs, show that for magnetic fields of G or larger, very high luminosities (up to 2-3 orders of magnitude above the Eddington limit) can be produced (Mushtukov et al. 2015; Kawashima et al. 2016).
Based on currently available data, it is not possible to assess whether BH-models or the pulsator-like model we adopted provide a statistically better fit to the X-ray continuum of bright ULXs. The two types of models resemble each other in that they both comprise a soft component (a blackbody or a disk-blackbody, which is very difficult to distinguish at the soft X-ray energies where it is seen) and a harder component comprising a powerlaw-like spectrum with exponential cutoff, which likely originates from Comptonization in an accretion disk corona in the case of BHs and from the post-shock region of a magnetically-funneled accretion column in the case of NSs. The shape of the cut-off can be smoother or steeper than a simple exponential in the pulsator-like model. In order to ascertain what observations would be required to distinguish between BH and NS-like spectral models we simulated the spectra of IC 342 X-1 and NGC 1313 X-1 by using the best-fit diskbb+comptt model (see e.g. Middleton et al. 2015) and a 1 Ms exposure time with XMM-Newton and NuSTAR. By fitting these spectra with a highecutpowerlaw model, we found structured spectral residuals at high energy ( keV), not observed with a diskbb+comptt model. The same simulation was carried out based on the specifications of the future X-ray mission Athena+333http://www.the-athena-x-ray-observatory.eu/ where a discrimination of the two models required an exposure time of at least ks in the WFI instrument. However, we highlight that the simple diskbb+comptt model, when using NuSTAR data, has been challenged in the sources Ho IX X-1 (Walton et al. 2014b), already indicating that ULX spectra do not completely suit with a BH description only.
The relatively large number of parameters in the bb + highecutpowerlaw model hampers a straightforward comparison between the sources, but a clear picture emerges from a color-color diagram in which only the range above 2 keV is considered, where absorption effects are negligible and there is no (or marginal) contamination from the soft component. This clearly shows that the ULX pulsars, when pulsations are detected, have a harder spectrum than that of the majority of the other ULXs of the sample (note that the spectrum of NGC 5907 X-1 was somewhat softer in 2013, when no pulsations from this source were detected). There are no instrumental effects that favor the detection of pulsations, if present, in harder sources, but we cannot exclude that for some processes intrinsic to the sources the flux modulation increases when their spectra become harder. It is possible to speculate that the harder sources are those observed more directly in the inner regions close to the compact objects (or possibly from an accretion column, Fuerst et al. 2016) and this might facilitate the detection of pulsations in the case of accreting NS; while for softer sources the inner regions might be possibly occluded (because of higher angles of the line of sight) by cold, optically thick plasmas which reduce the pulsation coherence.
None of the other sources showed high-energy spectra as hard as the hardest spectra of the ULX pulsars, except for IC 342 X-1 and Ho IX X-1. The spectral parameters of these two sources overlap, at least on one epoch, with those of the ULX pulsars (see Fig. 2). Hence we suggest that IC 342 X-1 and Ho IX X-1 may be good candidates NS ULXs. On the basis of their spectrum alone, NGC 5408 X-1, Ho II X-1, NGC 1313 X-1 and X-2, NGC 5643 ULX1 and NGC 6946 X-1 are instead less likely to contain NSs. The failure to detect pulsations so far in IC 342 X-1 and Ho IX X-1 may be caused by intermittent activity of periodic flux modulation and/or by the presence of a large period derivative. However it should be also noted that X-ray luminosity swing of the ULX pulsars is much larger ( a factor of 100) than that of IC 342 X-1 and Ho IX X-1 (a factor of only). Following Israel et al. (2016a,b) and assuming that the sources are all viewed at comparable inclination angles and have comparable beaming, we expect that the higher the luminosity the higher the magnetic field. Israel et al. (2016a,b) estimated a dipolar magnetic field of G for NGC 5907 X-1 and G for NGC 7793 P13. Since IC 342 X-1 and Ho IX X-1 have luminosities of erg s-1, we can roughly guess a dipolar magnetic field of G for both sources if their spin period will turn out to be in the range of seconds as well.
5. Conclusion
We adopted a commonly used spectral model for accreting X-ray pulsating NS in the Galaxy to describe the spectra of a sample of bright ULXs. We found that this model well describes the spectra of most ULXs, suggesting that spectral models based on accreting BHs may not have the interpretative power that has been ascribed to them up to now. We conclude that other ULXs may be found to host NSs accreting at super-Eddington rates. We showed also that the known pulsating ULXs are amongst the hardest sources of our sample, with IC 342 X-1 and Ho IX X-1 having comparably hard spectra. Based on their spectral properties alone, we thus suggest these two sources are likely candidate NS ULXs.
Acknowledgements
We thank the anonymous referee for his/her helpful comments. We acknowledge financial contribution from the agreement ASI-INAF I/037/12/0 and PRIN INAF 2014.
References
- Arnaud (1996) Arnaud, K. A. 1996, in ASP Conf. Ser., San Francisco CA, Vol. 101, Jacoby, G. H. and Barnes, J., eds., Astronomical Data Analysis Software and Systems V., 17
- Bachetti et al. (2014) Bachetti, M., Harrison, F. A., Walton, D. J., et al. 2014, Nature, 514, 202
- Bachetti et al. (2013) Bachetti, M., Rana, V., Walton, D. J., et al. 2013, ApJ, 778, 163
- Becker & Wolff (2007) Becker, P. A., & Wolff, M. T. 2007, ApJ, 654, 435
- Brightman et al. (2016a) Brightman, M., Harrison, F., Walton, D. J., et al. 2016a, ApJ, 816, 60
- Brightman et al. (2016b) Brightman, M., Harrison, F. A., Barret, D., et al. 2016b, ApJ, 829, 28
- Coburn et al. (2001) Coburn, W., Heindl, W. A., Gruber, D. E., et al. 2001, ApJ, 552, 738
- Colbert & Mushotzky (1999) Colbert, E. J. M., & Mushotzky, R. F. 1999, ApJ, 519, 89
- Fabbiano (2006) Fabbiano, G. 2006, ARA&A, 44, 323
- Farinelli et al. (2016) Farinelli, R., Ferrigno, C., Bozzo, E., & Becker, P. A. 2016, A&A, 591, A29
- Feng & Soria (2011) Feng, H., & Soria, R. 2011, New Astronomy Reviews, 55, 166
- Fuerst et al. (2016) Fuerst, F., Walton, D. J., Stern, D., et al. 2016, ArXiv e-prints, arXiv:1610.00258
- Gladstone et al. (2009) Gladstone, J. C., Roberts, T. P., & Done, C. 2009, MNRAS, 397, 1836
- Gonçalves & Soria (2006) Gonçalves, A. C., & Soria, R. 2006, MNRAS, 371, 673
- Israel et al. (2016a) Israel, G. L., Papitto, A., Esposito, P., Stella, L., & Zampieri, e. a. 2016a, ArXiv e-prints, arXiv:1609.06538
- Israel et al. (2016b) Israel, G. L., Belfiore, A., Stella, L., et al. 2016b, ArXiv e-prints, arXiv:1609.07375
- Kawashima et al. (2016) Kawashima, T., Mineshige, S., Ohsuga, K., & Ogawa, T. 2016, PASJ, 68, 83
- McClintock & Remillard (2006) McClintock, J. E., & Remillard, R. A. 2006, in Compact stellar X-ray sources, ed. W. H. G. Levin and M. van der Klis (Cambridge: Cambridge University Press), 157
- Middleton et al. (2015) Middleton, M. J., Heil, L., Pintore, F., Walton, D. J., & Roberts, T. P. 2015, MNRAS, 447, 3243
- Middleton et al. (2014) Middleton, M. J., Walton, D. J., Roberts, T. P., & Heil, L. 2014, MNRAS, 438, L51
- Miller et al. (2004) Miller, J. M., Fabian, A. C., & Miller, M. C. 2004, ApJ, 614, L117
- Mukherjee et al. (2015) Mukherjee, E. S., Walton, D. J., Bachetti, M., & Harrison, F. A. e. a. 2015, ApJ, 808, 64
- Mushtukov et al. (2015) Mushtukov, A. A., Suleimanov, V. F., Tsygankov, S. S., & Poutanen, J. 2015, MNRAS, 454, 2539
- Ohsuga & Mineshige (2011) Ohsuga, K., & Mineshige, S. 2011, ApJ, 736, 2
- Pinto et al. (2016) Pinto, C., Middleton, M. J., & Fabian, A. C. 2016, Nature, 533, 64
- Pintore & Zampieri (2012) Pintore, F., & Zampieri, L. 2012, MNRAS, 420, 1107
- Pintore et al. (2014) Pintore, F., Zampieri, L., Wolter, A., & Belloni, T. 2014, MNRAS, 439, 3461
- Poutanen et al. (2007) Poutanen, J., Lipunova, G., Fabrika, S., Butkevich, A. G., & Abolmasov, P. 2007, MNRAS, 377, 1187
- Sanders et al. (2003) Sanders, D. B., Mazzarella, J. M., Kim, D.-C., Surace, J. A., & Soifer, B. T. 2003, AJ, 126, 1607
- Smith et al. (2007) Smith, B. J., Struck, C., Hancock, M., et al. 2007, AJ, 133, 791
- Stobbart et al. (2006) Stobbart, A.-M., Roberts, T. P., & Wilms, J. 2006, MNRAS, 368, 397
- Strüder et al. (2001) Strüder, L., et al. 2001, A&A, 365, L18
- Sutton et al. (2013) Sutton, A. D., Roberts, T. P., & Middleton, M. J. 2013, MNRAS, 435, 1758
- Sutton et al. (2012) Sutton, A. D., Roberts, T. P., Walton, D. J., Gladstone, J. C., & Scott, A. E. 2012, MNRAS, 423, 1154
- Tully et al. (2013) Tully, R. B., Courtois, H. M., Dolphin, A. E., Fisher, J. R., & et al. 2013, AJ, 146, 86
- Turner et al. (2001) Turner, M. J. L., et al. 2001, A&A, 365, L27
- Walton et al. (2014a) Walton, D. J., Harrison, F. A., Grefenstette, B. W., Miller, J. M., & et al. 2014a, ArXiv e-prints, arXiv:1402.2992
- Walton et al. (2014b) —. 2014b, ApJ, 793, 21
- Walton et al. (2013) Walton, D. J., Miller, J. M., Harrison, F. A., et al. 2013, ApJ, 773, L9
- White et al. (1995) White, N. E., Nagase, F., & Parmar, A. N. 1995, X-ray Binaries, 1
- White et al. (1983) White, N. E., Swank, J. H., & Holt, S. S. 1983, ApJ, 270, 711
- Zampieri & Roberts (2009) Zampieri, L., & Roberts, T. P. 2009, MNRAS, 400, 677