L1188: a promising candidate of cloud-cloud collision triggering the formation of the low- and intermediate-mass stars
Abstract
We present a new large-scale (2°2°) simultaneous 12CO, 13CO, and C18O (=10) mapping of L1188 with the PMO 13.7-m telescope. Our observations have revealed that L1188 consists of two nearly orthogonal filamentary molecular clouds at two clearly separated velocities. Toward the intersection showing large velocity spreads, we find several bridging features connecting the two clouds in velocity, and an open arc structure which exhibits high excitation temperatures, enhanced 12CO and 13CO emission, and broad 12CO line wings. This agrees with the scenario that the two clouds are colliding with each other. The distribution of young stellar object (YSO) candidates implies an enhancement of star formation in the intersection of the two clouds. We suggest that a cloud-cloud collision happened in L1188 about 1 Myr ago, possibly triggering the formation of low- and intermediate-mass YSOs in the intersection.
=1
1 Introduction
Triggered star formation sustains, amplifies, and disperses what large-scale instabilities begin (Elmegreen, 1998). Cloud-cloud collisions are an important triggering mechanism, because such collisions are believed to be frequent in Milky-Way-like disk galaxies (Tasker & Tan, 2009) and are expected to induce starbursts in galaxies (Olson & Kwan, 1990). As shown by hydrodynamics simulations (e.g., Habe & Ohta, 1992; Anathpindika, 2010), a cloud-cloud collision induces the formation of dense cores in the shock-compressed interface, and these dense cores are prone to gravitational instability leading to the formation of nascent stars. Recent magnetohydrodynamic simulations have shown that a cloud-cloud collision will lead to a large effective Jeans mass in the compressed layer, favoring the formation of massive cloud cores (Inoue & Fukui, 2013). The analytical theory of Tan (2000) argued if collisions are as frequent as several times per orbital period, cloud-cloud collisions could reproduce global star formation rates of galaxies and the Kennicutt-Schmidt relation (Kennicutt, 1998). However, good cloud-cloud collision candidates, including Westerlund 2 (Furukawa et al., 2009), NGC 3603 (Fukui et al., 2014), the Trifid Nebula M20 (Torii et al., 2011), RCW 120 (Torii et al., 2015), RCW 38 (Fukui et al., 2016), and N159W-S in the Large Magellanic Cloud (Fukui et al., 2015), are still rare in observational aspects. In this letter, we present a new promising cloud-cloud collision candidate L1188 which is likely to trigger the formation of low- and intermediate-mass stars.
L1188, known as a dark cloud complex (Lynds, 1962), is located at the periphery of the Cepheus Bubble (see Fig. 21 of Kun et al., 2008). Previous observations have found several dense cores and young stellar objects (YSOs) in L1188 (Abraham et al., 1995; Könyves et al., 2004; Marton et al., 2013; Verebélyi et al., 2013), indicative of on-going star formation. On the other hand, there are rare CO studies toward L1188. An area of 74′44′ was firstly studied in 13CO (10) with the Nagoya-4 m telescope (Abraham et al., 1995). The whole region was mapped by the FCRAO 12CO (10) outer galaxy survey (Heyer et al., 1998) and the Nagoya-4 m 13CO (10) survey (Yonekura et al., 1997), but there is lack of published further analysis toward L1188. Here, we will present new multiple line observations toward this region in the =10 transitions of the three main CO isotopologues (12CO, 13CO, and C18O), and detailed morphological and kinematic analysis.
2 Observations
As part of the Milky Way Imaging Scroll Painting (MWISP111http://www.radioast.nsdc.cn/mwisp.php) project, we carried out large-scale (2°2°) simultaneous observations of 12CO (10), 13CO (10), and C18O (10) toward the L1188 molecular cloud complex with the Purple Mountain Observatory (PMO) 13.7-m telescope during 2011 November 13 to 2014 April 1. The 3-beam sideband separation Superconducting Spectroscopic Array Receiver (SSAR, Shan et al., 2012) was used as front end, while a set of 18 fast Fourier transform spectrometers (FFTSs) were used as backend for signals from both sidebands. Each FFTS with a bandwidth of 1 GHz provides 16384 channels, resulting in a spectral resolution of 61 kHz, equivalent to a velocity resolution of 0.17 km s-1 at 110 GHz. Our observations cover a total of 16 cells, each of which is of size 30′30′ and was observed with the On-The-Fly mode at a scanning rate of 50″ per second and a dump time of 0.3 second. In order to reduce the scanning effects, each cell was mapped at least twice, along the Galactic longitude and the Galactic latitude, respectively. The observations encompasses a total of 72 observing hours.
The standard chopper-wheel method was used to calibrate the antenna temperature (Ulich & Haas, 1976). We used the relationship to convert the antenna temperature () to the main beam temperature (), where the main beam efficiency () is 44% at 115 GHz and 48% at 110 GHz according to the telescope status report222http://www.radioast.nsdc.cn/zhuangtaibaogao.php. The calibration errors are estimated to be within 10%. Typical system temperatures were 214—340 K at the upper sideband, and 126—176 K at the lower sideband. The resulting typical sensitivity is about 0.5 K () for 12CO (10) at a channel width of 0.16 km s-1, and 0.3 K () for 13CO (10) and C18O (10) at a channel width of 0.17 km s-1. The half-power beam widths (HPBW) are about 55″ and 52″ at 110 GHz and 115 GHz, respectively. The pointing accuracy was accurate to 5″. Velocities are all given with respect to the local standard of rest (LSR) in this work. Data analysis was performed with the GILDAS data reduction package333http://www.iram.fr/IRAMFR/GILDAS (see e.g. Gong et al., 2016, for details).
3 Results
3.1 Distance
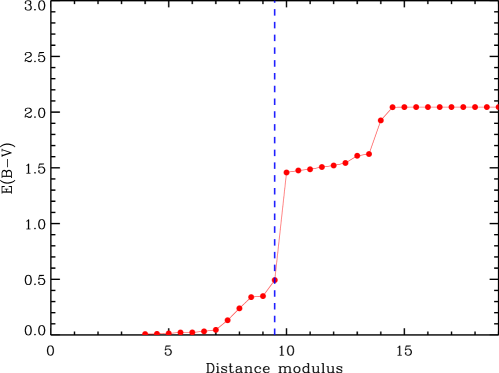
The distance is a fundamental parameter for deriving physical properties. However, there is no distance measurement toward L1188 so far. Here, we perform the distance estimate toward L1188 based on the 3D extinction map from Green et al. (2015). With 5-band Pan-STARRS 1 photometry and 3-band 2MASS photometry of stars embedded in the dust, Green et al. (2015) trace the extinction on 7′ scales out to a distance of several kpc, by simultaneously inferring stellar distance, stellar type, and the reddening along the line of sight. We select two regions with high 13CO intensities integrated from 15 to 5 km s-1. The regions are centered at the Galactic coordinates (=106.0°, =3.9°) and (=105.9°, =4.2°) with a radius of 0.15°. In Fig. 1, we show the median cumulative reddening in each distance modulus (DM) bin within the selected regions. We note two rapid increases in this figure. One is at DM9.5 (800 pc), and the other is at DM14 (6500 pc). L1188 has a velocity of around 10 km s-1, in favor of the near distance. Thus, the rapid increase at the distance of 800 pc should be due to the dust reddening in our studied molecular clouds. This also confirms the hypothesis, proposed by Abraham et al. (1995), that L1188 is associated with L1204/S140, the distance of which was measured to be 76427 pc (Hirota et al., 2008). Hereafter, we take 800 pc as the distance of L1188.
3.2 Morphology and kinematics
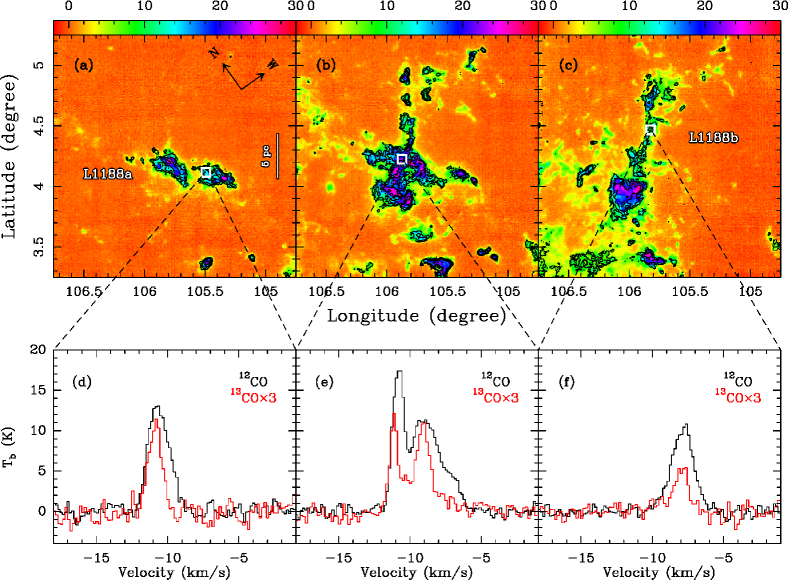
Figures 2a—2c show the intensity maps of 12CO and 13CO with three different integrated velocity ranges, i.e., 13.1 to 10.4 km s-1, 10.4 to 8.0 km s-1, and 8.0 to 5.5 km s-1. The integrated intensity maps display a molecular cloud elongated from northeast to southwest in Fig. 2a, and a cross-like morphology in Fig. 2b, and a molecular cloud elongated from northwest to southeast in Fig. 2c. The distributions suggest that the L1188 molecular cloud complex consists of two filamentary molecular clouds, named as L1188a (Fig. 2a) and L1188b (Fig. 2c), which are perpendicular to each other. L1188a has a length of 13.1 pc and a width of 0.7—2.8 pc (defined as the full width of the 13CO integrated intensity at the 3 level), while L1188b has a length of 15.9 pc and a width of 0.5—4.4 pc. Figures 2d—2f give the typical spectra in L1188a, L1188b, and the intersection of the two clouds. The spectra demonstrate that both L1188a and L1188b show single-peaked line profiles with systemic velocities of about 10.5 and 8 km s-1, respectively, while the intersection is characterised by two velocity components. Assuming local thermodynamic equilibrium (LTE), the 13CO optical depths of the two peaks in Fig. 2e are less than 0.5.
By assuming that all molecular gas is in LTE, the total gas mass of L1188 is estimated with the 13CO intensities integrated from 15 to 5 km s-1. Based on the excitation temperature map derived from the optically thick 12CO line and the correction factor ( is the optical depth of 13CO, Goldsmith & Langer, 1999) derived from the 13CO peak intensity, we can derive H2 column densities with a constant [12C/13C] isotopic ratio of 77 (Wilson & Rood, 1994) and a constant [H2/12CO] abundance ratio of 1.1 (Frerking et al., 1982). By integrating over the area with the 13CO (10) emission higher than 3 and assuming a mean molecular weight per hydrogen molecule to be 2.8, the total mass is found to be 3.9 which is more than twice the previous result (1.8 M⊙, Abraham et al., 1995). This discrepancy can be understood since Abraham et al. (1995) only took dense regions into account and did not apply the correction factor. Assuming that the two clouds make the same contribution to the mass of the intersection, we arrive at a mass of 1.2 for L1188a and 2.7 for L1188b.
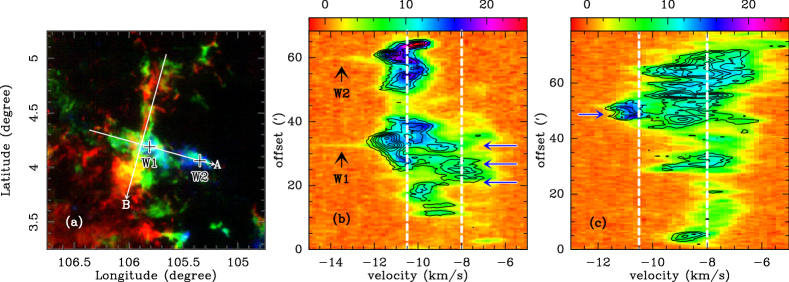
In order to investigate the velocity structure, we make position-velocity diagrams along the long axes of L1188a and L1188b shown in Fig. 3. In both 12CO and 13CO emission, one can clearly see bridging features in velocity between the two clouds. Although it is hard to separate such features individually from 12CO image only, 13CO contours can help to pick out at least four bridging features, indicated by blue arrows in Figs. 3b and 3c. Such bridging features are a robust verification of the association of the two clouds (e.g., Haworth et al., 2015a, b; Fukui et al., 2016). Furthermore, we can see that both L1188a and L1188b have small velocity spreads of 2 km s-1 at the 3 level of 13CO emission. In contrast, the intersection of the two clouds shows a larger velocity spread of 5 km s-1, indicating that molecular gas in this region is more turbulent. The region showing such a large velocity spread has a size of 20′, corresponding to a physical scale of 4.7 pc.
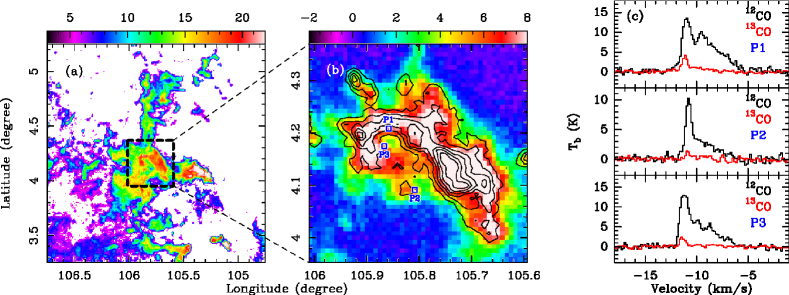
Figure 4a shows the 12CO excitation temperature map. In the intersection, we find an open arc structure which has excitation temperatures (18—22 K) higher than those (15 K) of ambient gas. The radius of curvature of the arc structure is found to be about 0.6 pc. In addition, the arc structure appears to be enhanced in both 12CO and 13CO emission (see Fig. 4b). Toward the arc structure, we find widespread emission showing broad 12CO line wings (see three examples in Fig. 4c), indicating that molecular gas in the arc structure is perturbed by shocks.
3.3 Star formation in the intersection of L1188a and L1188b
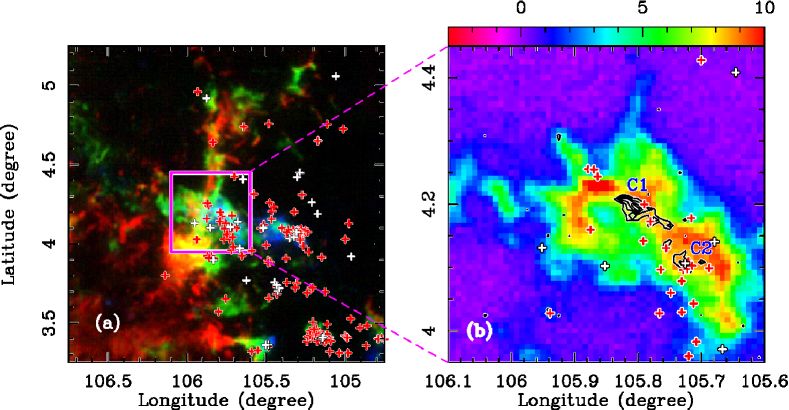
We use the WISE data (Wright et al., 2010) and the criteria introduced by Koenig et al. (2012) to search for class I and class II YSOs in the observed region. As a result, we found 228 YSO candidates, among which 31 are Class I and 197 are Class II. Figure 5a shows the distribution of these YSO candidates. In L1188, there are several regions showing overdense YSO candidates. What we are interested is the one located at the intersection of L1188a and L1188b. In this intersection, twenty-eight YSO candidates, including 3 class I and 25 class II YSO candidates, are found to be clustered around the arc structure. This is indicative of enhanced star formation. In the arc structure, we also discover two C18O cores, labeled as C1 and C2 in Fig. 5b. Their deconvolved radii are found to be 0.22 pc and 0.16 pc. By assuming LTE and a constant [16O/18O] isotopic ratio of 560 (Wilson & Rood, 1994), their core masses are found to be 35 and 15 by summing up all column densities inside the contour of 0.6 K km s-1(see Fig. 5b). C1 is more elongated and massive than C2. Compared with the empirical mass-size relationship for the formation of massive stars (Kauffmann et al., 2010), the two cores are unlikely to form massive stars. The two 12CO high velocity wings (W1 and W2) revealed in Fig. 3b are indicative of outflows driven by YSOs. From Fig. 3a, W1 is likely associated with C1. However, we cannot resolve the outflows with our data due to the limited angular resolution and the contamination from ambient clouds.
4 Discussion
In Sect. 3.2, we suggest that L1188 consists of two nearly orthogonal filamentary molecular clouds. Although the morphology can be alternatively explained by cores accretion from the surrounding filament material which was believed to play an important role in the formation of the embedded Serpens south protocluster (Kirk et al., 2013), this doesn’t seem to be the case for L1188. Such filamentary accretion flows will display self-absorption in optically thick emission and a single peaked profile in optically thin emission, which is not found in our data. Instead, our 13CO data has low optical depths (0.5) and show two distinct peaks, which supports that the two velocity components arise from two clouds rather than accretion flows. We also find several pieces of evidence to support the idea that L1188a and L1188b are colliding with each other. Firstly, bridging features connect the two clouds in velocity, which points out that the two clouds are interacting (Haworth et al., 2015a, b). Secondly, the intersection of the two clouds show large velocity spreads, indicative of more turbulent motions. This agrees with results given by simulations of cloud-cloud collisions (e.g., Inoue & Fukui, 2013). Thirdly, an arc structure exhibiting high excitation temperatures, enhanced 12CO and 13CO emission, and broad 12CO line wings is found in the intersection of the two clouds. Such a structure could result from stellar feedback. However, we do not find HII regions or YSOs toward the center of the arc structure to our knowledge. Instead, the open arc structure has been successfully created by simulations of cloud-cloud collisions where the arc-like layer is formed due to the shock compression (e.g., Habe & Ohta, 1992; Takahira et al., 2014). Toward the arc structure, the widespread gas showing broad 12CO line wings reinforce the presence of shocks. Furthermore, there is lack of YSOs around the positions showing such wings, indicating that the shocks arise from the cloud-cloud collision. We note that such wing profile is seldom reported in the other cloud-cloud candidates mentioned in Sect. 1.
From the systemic velocities of the two clouds, their velocity difference is about 2.5 km s-1 which is a lower limit of the relative collision velocity due to the projection effect. Previous studies suggest that the velocity spread in the shocked layer is similar to the relative collision velocity (Inoue & Fukui, 2013; Fukui et al., 2015). We thus roughly assume the relative collision velocity to be 5 km s-1. The collision velocity is also in consistent with simulations of small clouds which predicted an open arc dense structure at the assumed relative collision velocity (Takahira et al., 2014). Compared with the velocity difference, the relative collision velocity implies that the relative motion of the two clouds is about 60° to the line of sight. Assuming an effective radius of 5 pc for L1188, we estimate that a mass of 2.4 is required to gravitationally bind the two clouds, which is six times the observed LTE mass (3.9 ). Thus, the total mass of L1188 is too small to gravitationally bind the two clouds.
Given that star forming activities are found in the intersection, we propose a scenario that star formation is triggered by a collision of molecular clouds in L1188. The relative collision velocity of 5 km s-1 gives a transverse velocity of 4.3 km s-1. Assuming that the perturbed region showing large velocity spreads in Fig. 3b is ascribable to the collision, this implies that L1188a and L1188b collided with each other about a timescale of 4.7 pc divided by 4.3 km s-1, i.e., 1 Myr ago. Such a timescale is longer than the lifetime (0.5 Myr) of Class I YSOs and comparable to the lifetime (21 Myr) of Class II YSOs (Evans et al., 2009), which means that the YSO candidates in the region are possible to form after the collision between L1188a and L1188b. This implies that these stars are possible to be triggered by the collision. Together with the geometric simplicity of L1188, the cloud complex is unlikely to form massive stars, which makes it one of the best candidates to further study cloud-cloud collision triggering the formation of the low- and intermediate-mass stars.
5 Summary and conclusions
Based on the 3D extinction map, we perform the distance estimate toward L1188 which is found to be 800 pc. We present a new large-scale (2°2°) mapping of L1188 in the three CO isotopic lines with the PMO 13.7-m telescope. We unveil that L1188, displaying a cross-like morphology, consists of two nearly orthogonal filamentary molecular clouds (L1188a and L1188b) with systemic velocities of about 10.5 and 8.0 km s-1. The total mass of L1188 is 3.9 M⊙, unable to bind the two clouds. Toward the intersection of the two clouds which shows large velocity spreads, we find several bridging features connecting the two clouds in velocity, and an open arc structure which exhibits high excitation temperatures, enhanced 12CO and 13CO emission, and broad 12CO line wings. This is in consistent with the scenario that the two clouds are colliding with each other. An overdense distribution of young stellar object candidates is found in the intersection of the two clouds, indicative of enhanced star formation. We suggest that a cloud-cloud collision happened in L1188 about 1 Myr ago, possibly triggering the formation of low- and intermediate-mass stars in the intersection.
References
- Abraham et al. (1995) Abraham, P., Dobashi, K., Mizuno, A., & Fukui, Y. 1995, A&A, 300, 525
- Anathpindika (2010) Anathpindika, S. V. 2010, MNRAS, 405, 1431
- Elmegreen (1998) Elmegreen, B. G. 1998, in Astronomical Society of the Pacific Conference Series, Vol. 148, Origins, ed. C. E. Woodward, J. M. Shull, & H. A. Thronson, Jr., 150
- Evans et al. (2009) Evans, II, N. J., et al. 2009, ApJS, 181, 321
- Frerking et al. (1982) Frerking, M. A., Langer, W. D., & Wilson, R. W. 1982, ApJ, 262, 590
- Fukui et al. (2014) Fukui, Y., et al. 2014, ApJ, 780, 36
- Fukui et al. (2015) —. 2015, ApJ, 807, L4
- Fukui et al. (2016) —. 2016, ApJ, 820, 26
- Furukawa et al. (2009) Furukawa, N., Dawson, J. R., Ohama, A., Kawamura, A., Mizuno, N., Onishi, T., & Fukui, Y. 2009, ApJ, 696, L115
- Goldsmith & Langer (1999) Goldsmith, P. F., & Langer, W. D. 1999, ApJ, 517, 209
- Gong et al. (2016) Gong, Y., et al. 2016, A&A, 588, A104
- Green et al. (2015) Green, G. M., et al. 2015, ApJ, 810, 25
- Habe & Ohta (1992) Habe, A., & Ohta, K. 1992, PASJ, 44, 203
- Haworth et al. (2015a) Haworth, T. J., Shima, K., Tasker, E. J., Fukui, Y., Torii, K., Dale, J. E., Takahira, K., & Habe, A. 2015a, MNRAS, 454, 1634
- Haworth et al. (2015b) Haworth, T. J., et al. 2015b, MNRAS, 450, 10
- Heyer et al. (1998) Heyer, M. H., Brunt, C., Snell, R. L., Howe, J. E., Schloerb, F. P., & Carpenter, J. M. 1998, ApJS, 115, 241
- Hirota et al. (2008) Hirota, T., et al. 2008, PASJ, 60, 961
- Inoue & Fukui (2013) Inoue, T., & Fukui, Y. 2013, ApJ, 774, L31
- Kauffmann et al. (2010) Kauffmann, J., Pillai, T., Shetty, R., Myers, P. C., & Goodman, A. A. 2010, ApJ, 716, 433
- Kennicutt (1998) Kennicutt, Jr., R. C. 1998, ARA&A, 36, 189
- Kirk et al. (2013) Kirk, H., Myers, P. C., Bourke, T. L., Gutermuth, R. A., Hedden, A., & Wilson, G. W. 2013, ApJ, 766, 115
- Koenig et al. (2012) Koenig, X. P., Leisawitz, D. T., Benford, D. J., Rebull, L. M., Padgett, D. L., & Assef, R. J. 2012, ApJ, 744, 130
- Könyves et al. (2004) Könyves, V., Moór, A., Kiss, C., & Ábrahám, P. 2004, Baltic Astronomy, 13, 470
- Kun et al. (2008) Kun, M., Kiss, Z. T., & Balog, Z. 2008, Star Forming Regions in Cepheus, ed. B. Reipurth, 136
- Lynds (1962) Lynds, B. T. 1962, ApJS, 7, 1
- Marton et al. (2013) Marton , G., Verebélyi, E., Kiss, C., & Smidla, J. 2013, Astronomische Nachrichten, 334, 924
- Olson & Kwan (1990) Olson, K. M., & Kwan, J. 1990, ApJ, 349, 480
- Shan et al. (2012) Shan, W. L., et al. 2012, IEEE Transactions on Terahertz Science and Technology, 2, 593
- Takahira et al. (2014) Takahira, K., Tasker, E. J., & Habe, A. 2014, ApJ, 792, 63
- Tan (2000) Tan, J. C. 2000, ApJ, 536, 173
- Tasker & Tan (2009) Tasker, E. J., & Tan, J. C. 2009, ApJ, 700, 358
- Torii et al. (2011) Torii, K., et al. 2011, ApJ, 738, 46
- Torii et al. (2015) —. 2015, ApJ, 806, 7
- Ulich & Haas (1976) Ulich, B. L., & Haas, R. W. 1976, ApJS, 30, 247
- Verebélyi et al. (2013) Verebélyi , E., Könyves, V., Nikolić, S., Kiss, C., Moór, A., Ábrahám, P., & Kun, M. 2013, Astronomische Nachrichten, 334, 920
- Wilson & Rood (1994) Wilson, T. L., & Rood, R. 1994, ARA&A, 32, 191
- Wright et al. (2010) Wright, E. L., et al. 2010, AJ, 140, 1868
- Yonekura et al. (1997) Yonekura, Y., Dobashi, K., Mizuno, A., Ogawa, H., & Fukui, Y. 1997, ApJS, 110, 21