The imprints of bars on the vertical stellar population gradients of galactic bulges
Abstract
This is the second paper of a series aimed to study the stellar kinematics and population properties of bulges in highly-inclined barred galaxies. In this work, we carry out a detailed analysis of the stellar age, metallicity and [Mg/Fe] of 28 highly-inclined () disc galaxies, from S0 to S(B)c, observed with the SAURON integral-field spectrograph. The sample is divided into two clean samples of barred and unbarred galaxies, on the basis of the correlation between the stellar velocity and h3 profiles, as well as the level of cylindrical rotation within the bulge region. We find that while the mean stellar age, metallicity and [Mg/Fe] in the bulges of barred and unbarred galaxies are not statistically distinct, the [Mg/Fe] gradients along the minor axis (away from the disc) of barred galaxies are significantly different than those without bars. For barred galaxies, stars that are vertically further away from the midplane are in general more [Mg/Fe]–enhanced and thus the vertical gradients in [Mg/Fe] for barred galaxies are mostly positive, while for unbarred bulges the [Mg/Fe] profiles are typically negative or flat. This result, together with the old populations observed in the barred sample, indicates that bars are long-lasting structures, and therefore are not easily destroyed. The marked [Mg/Fe] differences with the bulges of unbarred galaxies indicate that different formation/evolution scenarios are required to explain their build-up, and emphasizes the role of bars in redistributing stellar material in the bulge dominated regions.
keywords:
galaxies: bulges – galaxies: kinematics and dynamics – galaxies: abundances – galaxies: evolution – galaxies: formation – galaxies: stellar content.1 Introduction
In the era of IFU spectroscopy, the spatially resolved spectroscopic information, along with modern stellar population models, have provided new insights into our understanding of the role of bars on the formation and evolution of disc galaxies. Barred galaxies represent a considerable fraction of the entire disc galaxy population (e.g. Eskridge et al., 2000; Knapen et al., 2000; Whyte et al., 2002; Grosbøl et al., 2004; Marinova & Jogee, 2007). They are considered as key drivers of the internal secular evolution in disc galaxies by re- distribution of the angular momentum, triggering of star formation and the morphological transformation of galaxies in general, as demonstrated observationally (e.g. Kormendy, 2013) and theoretically (e.g. Athanassoula, 2013).
Most stellar population studies of barred systems focus on face-on disc galaxies and the stellar population gradients along the bars major axis (see Sánchez-Blázquez, 2016, and references therein). Moorthy & Holtzman (2006) analysed long-slit spectra of 38 face-on spirals of type S0–Sbc and reported a trend towards younger ages for the bulges of barred galaxies. They concluded that a positive age gradient is a direct indicator of the existence of a bar. Pérez & Sánchez-Blázquez (2011) studied the age and metallicity gradients in the bulge region of a sample of 20 early-type barred galaxies. Using the long-slit spectra along the bar major axis, they found that at a given velocity dispersion (), the bulges of barred galaxies seem to be more metal rich than the bulges of unbarred galaxies. They measured mostly negative metallicity gradients for the bulges in their sample, suggesting a strong link between the metallicity of the bulge and the presence of a bar. They also indicated that bulge populations distributions and gradient measurements could be biased against the existence of the bulge substructures, such as a nuclear ring or an inner disc. Similar results have been obtained by Coelho & Gadotti (2011), that claim the current star formation is enhanced in the centres of barred galaxies, and consequently the measured mean stellar age of bulges is strongly affected by the bar.
A detailed and unbiased study of the extended stellar population in the bulges of barred and unbarred galaxies requires high inclinations to ensure minimal contamination by the stellar disc. Nonetheless, the number of works, dedicated to study the stellar populations in highly-inclined barred galaxies is still very low and is limited to a few nearby cases (e.g. Jablonka et al., 2007; Williams et al., 2011; Pérez & Sánchez-Blázquez, 2011). Understanding the variations of stellar population parameters of bulges at different heights from the disc provides stronger constraints on the formation and evolution scenarios of bulges. More specifically, comparing the vertical gradients of the stellar population parameters in bulges with and without bars can provide very important new information to expand our understanding of bars nurture and its role in formation and evolution of disc galaxies.
Using long-slit spectroscopy, Jablonka et al. (2007) studied the vertical gradients of stellar population properties in the bulges of 32 edge-on galaxies, spanning a wide range of Hubble types, from S0 to Sc. They found that the central parts of the bulges are mostly younger and more metal rich than their outer regions and the outer parts of the bulges have higher [/Fe] than the inner parts. They found no meaningful differences between the stellar populations of nearly edge-on barred and unbarred galaxies, although they were not in the position to precisely distinguish bulges with and without bars. It has been widely accepted that boxy/peanut-shaped bulges (hereafter BP bulges), found in about half of edge-on galaxies, are bars viewed from the side (e.g. Kuijken & Merrifield, 1995; Merrifield & Kuijken, 1999; Bureau & Freeman, 1999; Athanassoula, 2005). Williams et al. (2011) studied the stellar kinematics and populations in five edge-on galaxies, dominated by BP bulges, using long-slit spectroscopy. They measured the vertical gradients in the bulges and claimed that BP bulges in their sample do not form a homogeneous class of objects. Later, Williams et al. (2012), analysed the central and the major axis profiles in the stellar populations of 28 highly inclined S0–Sb disc galaxies, presented in Bureau & Freeman (1999) and Chung & Bureau (2004), mostly with BP bulges. They found that at a given , gradients in BP bulges are shallower than those in elliptical galaxies, but that the stellar populations at the very centres of disc galaxies with or without BP bulges do not differ from those of early-type galaxies.
As we stated earlier, only a limited number of studies have been dedicated to investigate the stellar population properties of bulges in highly-inclined barred galaxies, and on top of that, the results are mostly inconsistent (see Sánchez-Blázquez, 2016, and the references therein). This might be, at least in part, due to the lack of a reliable and robust method to distinguish barred and unbarred galaxies in highly-inclined systems. The presence of a bar is not generally apparent if the bar is oriented close to or exactly parallel to the line-of-sight, even in edge-on galaxies, (see e.g. Bureau et al., 2004; Athanassoula, 2016; Molaeinezhad et al., 2016). Therefore, previous results might be highly biased (see Peletier et al., 2007).
In the first paper of this series (Molaeinezhad et al., 2016, hereafter Paper I) we studied the connection between bulge morphology and kinematics in 12 mid to highly-inclined disc galaxies, observed with the SAURON integral-field spectrograph. We suggested that the strong positive correlation between the stellar velocity () and the h3 Gauss–Hermite moment appears to be the most reliable indicator for the presence of bars among all other bar diagnostics, even in cases with end-on orientation of the bar (see Bureau & Athanassoula, 2005; Athanassoula, 2016, for more details). This is followed by introducing a method to quantify cylindrical rotation that is robust against inner bulge substructures such as inner discs, which are likely more common in barred galaxies. Our results also confirmed high levels of cylindrical rotation in barred galaxies with boxy/peanut bulges. In the current work, we study the stellar population properties and in particular, the vertical gradients along the minor axis in the bulges of 28 highly-inclined () disc galaxies, observed with the SAURON integral-field spectrograph. Using the kinematic criteria introduced in Paper I, we are able to secure an unbiased classification of barred and unbarred galaxies in our sample, and compare the stellar population properties and vertical gradients in each class of bulges.
The paper is organised as follows. In Section 2 we describe the sample and give a summary of optical properties and kinematics of the galaxies in our sample. Section 3 is dedicated to the line-strength measurements and present the results of our stellar population analysis. In Section 4 we briefly discuss the possible scenarios to interpret these results. Finally, we summarize our findings and draw our conclusions in Section 5.
| Galaxy | Sample | PA | Vhel | T–type | incl. | Dust | Bar | ||||||
|---|---|---|---|---|---|---|---|---|---|---|---|---|---|
| (deg) | (km s-1) | (mag) | (deg) | (km s-1) | (arcsec) | (arcsec) | (arcsec) | ||||||
| (1) | (2) | (3) | (4) | (5) | (6) | (7) | (8) | (9) | (10) | (11) | (12) | (13) | (14) |
| NGC3098 | S2 | 88.5 | 1397 | 22.72 | 1.5 | 90 | 126.2 | N | 0.540.20 | N? | 1.5 | 10 | 9 |
| NGC4026 | S2 | 177.5 | 985 | 23.03 | 1.8 | 84 | 158.1 | N | 0.540.13 | Y | 3.0 | 12 | 10 |
| NGC4036 | S2 | 261.2 | 1385 | 24.40 | 2.6 | 75 | 181.9 | F | 0.260.24 | N | 2.0 | 12 | 9 |
| NGC4179 | S2 | 142.8 | 13 | 23.18 | 1.9 | 86 | 167.5 | N | 0.590.12 | Y | 2.0 | 13 | 10 |
| NGC4251 | S2 | 99.0 | 1066 | 23.68 | 1.9 | 80 | 128.8 | N | 0.730.08 | Y | 2.0 | 12 | 9 |
| NGC4270 | S2 | 109.8 | 2331 | 23.69 | 2.0 | 80 | 139.6 | N | 0.580.12 | Y | 1.5 | 13 | 10 |
| NGC4346 | S2 | 98.8 | 832 | 22.55 | 2.0 | 77 | 127.0 | N | 0.630.11 | Y | 3.5 | 12 | 12 |
| NGC4425 | S2 | 25.8 | 1908 | 22.09 | 0.6 | 90 | 82.8 | N | 0.530.15 | Y | 3.0 | 14 | 8 |
| NGC4435 | S2 | 10.0 | 791 | 23.83 | 2.1 | 68 | 152.8 | D | 0.510.14 | Y? | 3.0 | 11 | 9 |
| NGC4461 | S2 | 8.1 | 1924 | 23.08 | 0.8 | 71 | 133.0 | N | 0.580.15 | Y | 3.5 | 13 | 9 |
| NGC4474 | S2 | 79.4 | 1611 | 22.28 | 2.0 | 89 | 87.9 | N | 0.550.17 | Y? | 2.0 | 10 | 9 |
| NGC4521 | S2 | 166.3 | 2511 | 23.92 | 0.1 | 90 | 185.8 | N | 0.710.08 | Y | 2.0 | 10 | 8 |
| NGC4710 | S2 | 27.4 | 1102 | 23.53 | 0.9 | 88 | 104.7 | D | 0.540.20 | Y | 3.0 | 19 | 13 |
| NGC4762 | S2 | 29.6 | 986 | 24.48 | 1.8 | 90 | 133.7 | N | 0.660.13 | Y | 1.0 | 10 | 7 |
| NGC5103 | S2 | 140.6 | 1273 | 22.36 | – | 90 | 111.2 | N | 0.370.21 | N | 2.0 | 9 | 8 |
| NGC5326 | S1 | 130.0 | 2520 | 23.77 | – | 65 | 144.9 | N | 0.350.20 | N | 2.5 | 10 | 8 |
| NGC5353 | S2 | 140.4 | 2198 | 25.11 | 2.1 | 80 | 281.2 | D | 0.570.11 | Y | 3.0 | 15 | 9 |
| NGC5422 | S1 | 152.3 | 1838 | 23.69 | 1.5 | 90 | 161.8 | N | 0.690.08 | Y | 2.5 | 16 | 10 |
| NGC5475 | S1 | 166.2 | 1671 | 22.88 | – | 79 | 115.0 | N | 0.250.25 | N | 2.5 | 12 | 8 |
| NGC5574 | S2 | 62.7 | 1589 | 22.30 | 2.8 | 89 | 81.9 | N | 0.510.23 | Y | 2.0 | 11 | 9 |
| NGC5611 | S2 | 64.6 | 1968 | 22.20 | 1.9 | 74 | 137.4 | N | 0.400.24 | N | 1.5 | 10 | 9 |
| NGC5689 | S1 | 84.0 | 2160 | 24.00 | – | 81 | 157.4 | D | 0.640.09 | Y | 3.0 | 17 | 13 |
| NGC5707 | S1 | 35.0 | 2212 | 23.22 | – | 80 | 131.8 | N | 0.250.20 | N | 1.5 | 11 | 8 |
| NGC5746 | S1 | 170.0 | 1727 | 24.99 | – | 81 | 202.8 | D | 0.610.09 | Y | 3.5 | 22 | 15 |
| NGC5838 | S1 | 40.1 | 1341 | 24.13 | 2.6 | 72 | 246.0 | N | 0.470.17 | Y | 2.0 | 11 | 9 |
| NGC5854 | S2 | 54.8 | 1663 | 23.30 | 1.1 | 74 | 104.7 | N | 0.380.26 | Y | 3.5 | 13 | 10 |
| NGC5864 | S2 | 65.6 | 1874 | 23.62 | 1.7 | 74 | 110.7 | N | 0.590.12 | Y | 1.5 | 13 | 10 |
| NGC6010 | S1 | 102.9 | 2022 | 23.53 | – | 90 | 159.2 | D | 0.450.19 | Y | 3.5 | 11 | 10 |
NOTES: (1) Galaxy name. (2) Sample – S1: Molaeinezhad et al. (2016) sample. S2: Extracted from the ATLAS3D survey. (3) Position angle (N–E) of the dust free minor axis. (4) Heliocentric velocity, taken from Cappellari et al. (2011).For galaxies not in the ATLAS3D sample, values are taken from NED. (5) Total galaxy absolute magnitude in -band, taken from Peletier & Balcells (1997) and Cappellari et al. (2011), for samples S1 and S2, respectively. (6) Morphological T–type from HyperLeda (Paturel et al., 2003). (7) Inclinations derived from the best-fitting mass-follow-light JAM modelling (Cappellari et al., 2013), or if not available, derived from disc ellipticity in -band from Peletier & Balcells (1997), corrected for finite disc thickness. (8) Central velocity dispersion, defined as the maximum within the bulge analysis window, from our data. (9) Dust features – D: dusty disc, F: dusty filament, N: none (Taken from Cappellari et al., 2011). (10) Level of cylindrical rotation () within the bulge analysis window and its uncertainty. Values of are generally between 1 (pure cylindrical rotation) and 0 (no sign of cylindrical rotation). (11) Detection of a bar, based on the kinematic analysis as in Paper I. The Question mark (?) indicates cases where bar detection is uncertain. (12) Vertical extent of the region, close to the disc plane which is most likely disrupted by contamination of dust and/or central components. (13) and (14) Analysis window of the bulge along the major and minor axis respectively. See §2 for more details.
2 Sample & IFU observations
2.1 Sample Selection & Properties
Our sample consists of 28 highly-inclined () galaxies with high S/N IFU observations, that can be used to study the stellar population gradients along the minor axis. The sample is drawn from the complete, magnitude limited sample of 260 nearby galaxies in the ATLAS3D survey (Cappellari et al., 2011), complemented with the sample of highly inclined galaxies introduced in Paper I. For the ATLAS3D survey, we focused on disc galaxies, and only kept those galaxies whose inclination, as measured via the best fitting mass-follow-light JAM models (Cappellari et al., 2013), are above 65∘. This criterion allows us to access the clean vertical extent of the bulge, less disrupted by contamination of dust, disc and/or central components. We visually inspected the sample to discard galaxies with irregular morphology or low quality IFU data (with poor spatial sampling in the regions of interest). In addition we discarded galaxies where the emission line cleaning of the spectra was particularly problematic in the short wavelength range provided by the SAURON spectrograph. Our final sample comprises 20 galaxies from the ATLAS3D sample (hereafter S2), along with 8 galaxies from our original sample of Paper I (hereafter S1). The basic photometric properties of these 28 galaxies are presented in Table 1.
2.2 Observations
The SAURON observations of both samples S1 and S2 are described in detail in Paper I and Cappellari et al. (2011), respectively. Briefly, the spectroscopic observations of the S1 sample were carried out between October 1999 and 2011 with the SAURON integral-field spectrograph (Bacon et al., 2001) attached to the 4.2-m William Herschel Telescope (WHT) of the Observatorio del Roque de los Muchachos at La Palma, Spain. We used the low spatial resolution mode of SAURON which gives a field-of-view (FoV), with a spatial sampling of . This setup produces 1431 spectra per pointing over the SAURON FoV. Additionally, a dedicated set of lenses provides simultaneous sky spectra away from the main field. The spectral resolution delivered by the instrument is 4.2 Å (FWHM) and covers the narrow spectral range 4800-5380 Å. The IFU observing strategy and the data reduction of the S2 as described in Cappellari et al. (2011) is similar to the S1 sample, which guarantees the homogeneity of data for our sample. The stellar kinematics data, published here for S1 is the same as was presented in Paper I. Kinematics maps of the S2 sample were presented in details in Krajnović et al. (2011). In order to ensure meaningful and accurate stellar population parameters all the data were Voronoi binned, following Cappellari & Copin (2003), to a target SNR=60. We describe our procedures to extract the population parameters in §3.
2.3 Sample morphological and kinematic classification
2.3.1 Morphological analysis
In our study of the stellar population properties of bulges, the choice of
highly-inclined galaxies ensures minimal contamination by the stellar disc.
However, at these inclinations the bar component is not easily distinguishable if it is not inclined enough or has not vertically thickened enough to be clearly recognized above the disc plane, and/or beyond a possible large classical bulge. It is worth noting that
throughout this study, the ‘bulge’ of a galaxy is referred to the excess of
light that is above the main exponential disc.
A major concern in such studies is the disc contamination, that could severely
bias the bulge morphology analysis. For this purpose, as we did in Paper I, we
have used Galfit (Peng
et al., 2002) to find the best exponential disc model and
subtract it from the original image. These subtracted images have been used to
delimit the region of interest in our galaxies: the ’photometric bulge’. The
extent of the bulge in the radial () and vertical () directions has been
evaluated by integrating the residual images, along the minor (or major) axis,
and determining the region in which more than 90 per cent of light comes from the bulge.
We have made use of band images from the Sloan Digital Sky
survey DR10 (Ahn et al., 2014) for this purpose. In addition, we have produced
unsharp masked (median filtering) images to highlight the high frequency
features of the images and reveal possible structures with no radial symmetries.
These are presented in Appendix A, together with the bulge
region obtained from our Galfit analysis. The radial and vertical extent of our
bulges (in arcsec) are listed in Table 1.
2.3.2 Kinematic classification
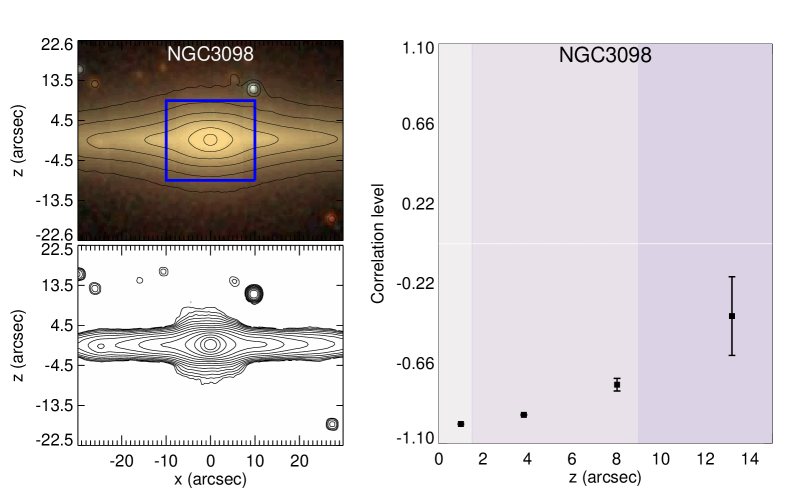
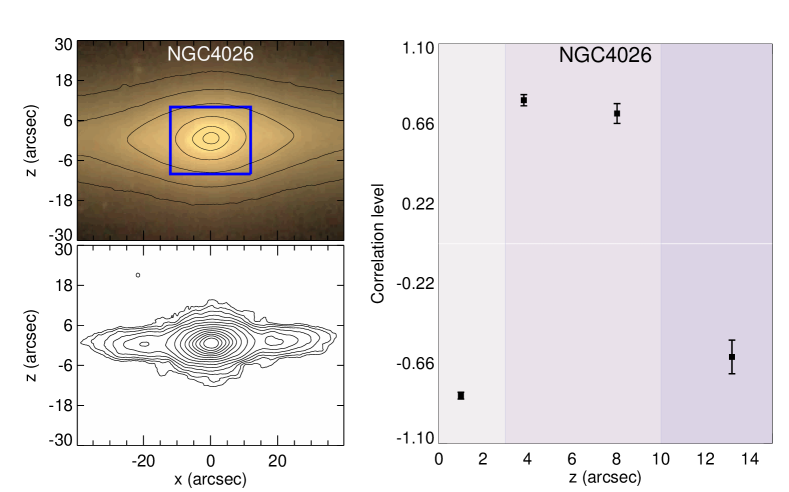
Bureau & Athanassoula (2005) suggested, using N-body simulations, a number of major-axis stellar kinematic features that can be used as bar diagnostics in highly inclined systems: (1) a ‘double-hump’ rotation curve; (2) a broad central velocity dispersion peak with a plateau (and possibly a secondary maximum) at moderate radii and (3) an h3 profile correlated with velocity over the projected bar length. All these diagnostics have been successfully expanded beyond the disc plane by Iannuzzi & Athanassoula (2015), who studied the imprints of bars on the 2D line-of-sight kinematics of simulated disc galaxies. In Paper I, we tested this approach on 12 mid- to highly inclined galaxies, all of them included in the S1 sample, and confirmed that the correlation between the stellar line of sight velocity () and the h3 Gauss–Hermite parameter is a very reliable bar diagnostic tool. The success of this method is the ability to unveil the hidden bar, when the bar is not clearly visible in photometric data, due to its orientation or strength. We have taken advantage of this approach to detect the presence of bars in our sample of galaxies. The diagnostic plots showing the degree of correlation can be found in Appendix A.
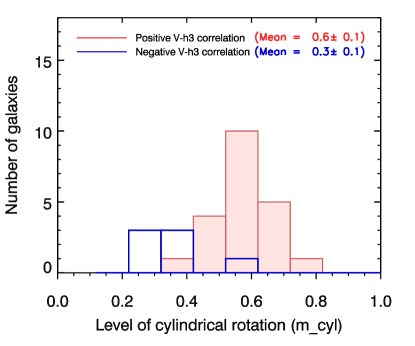
In addition, a typical kinematic feature of most barred galaxies with BP bulges is cylindrical rotation (e.g. Kormendy & Illingworth, 1982; Bureau & Freeman, 1999; Falcón-Barroso et al., 2006; Molaeinezhad et al., 2016). In such systems, the mean stellar rotation speed shows little difference at different height above the disc plane. In Paper I, we introduced a method to quantify the level of cylindrical rotation in bulges. This quantity () shows the importance of this property in bulges and is generally a value between +1 which indicates pure cylindrical rotation and 0 where there is no sign of cylindrical rotation within the bulge analysis window. Figure 1 shows the distribution of for the galaxies in our sample, separated into two categories of galaxies with positive –h3 correlations and those with negative or null –h3 correlations. As expected, the galaxies with relatively high values of are mostly those showing positive correlation between and h3, while those with lower values do not show a significant correlation. The values and related uncertainties are presented in Table 1.
As our goal is to have two clean classes of barred and unbarred systems, we use the combination of both bar diagnostic tools, the correlation –h3 and the level of cylindrical rotation, to define the galaxies belonging to each class. In this study, ”barred” galaxies refer to those systems that show remarkably positive correlation between and h3 in the areas above the mid-plane within the bulge analysis window, while those galaxies with non-positive –h3 and 0.55 are marked as ”unbarred” system. Not surprisingly, all galaxies with BP bulges in our sample belong to the ”barred” class.
3 Stellar population quantities
Besides stellar kinematics, we have also measured line-strength indices of the S1 and S2 galaxies in the recently defined Line Index System (LIS) LIS-8.4 Å (Vazdekis et al., 2010, hereafter VAZ10). This method has the advantage of circumventing the use of the so-called Lick/IDS fitting functions for the model predictions, which requires the determination of often uncertain offsets to account for differences in the flux calibration between models and observations.
The wavelength range provided by SAURON (4800–5380 Å) constrains the set of spectral indices that can be used to estimate stellar population parameters, i.e. age, metallicity, and [Mg/Fe]. We have used the three available indices that are measured across the full field for all galaxies, namely the H age indicator (i.e. the optimized H index of Cervantes & Vazdekis (2009)), as well as the metallicity- and [Mg/Fe]–sensitive indices Fe5015 and Mg (Trager et al., 1998). Notice that the [Mg/Fe] abundance ratio is of particular interest for the present study, as it measures – for a fixed IMF – the different timescale of the ejection of magnesium and iron into the interstellar medium. Thus, the [Mg/Fe] is believed to be a ”chemical clock” to estimate star-formation timescales for the bulk of a stellar population (e.g. Thomas et al., 2011; Vazdekis et al., 2015; Martín-Navarro, 2016).
Our analysis relies on –MILES stellar population models, from Vazdekis et al. (2015, hereafter V15). The models, constructed from MILES stellar spectra, have been computed, in a self-consistent manner, at both solar scale and for [/Fe] , over a range of metallicities, with the aid of theoretical stellar spectra from Coelho et al. (2005, 2007), and using BaSTi (either scaled-solar or –enhanced) isochrones from Pietrinferni et al. (2004, 2006). Notice that throughout the present work, we adopt the notation [Mg/Fe], rather than [/Fe], as our estimate of abundance ratios relies entirely on Mg- and Fe-sensitive features, i.e. Mg5177 and Fe5015.
The –MILES models cover the (optical) MILES spectral range (– Å), in the metallicity and age range of and Gyr, respectively. For both scaled-solar and –enhanced SSP models, we have produced an interpolated grid of model line-strengths with a step of Gyr in age, and dex in metallicity. The scaled-solar and –enhanced grids are then interpolated/linearly-extrapolated to cover the [Mg/Fe] range from to dex, with a step of dex in [Mg/Fe]. Notice that the extrapolation does not affect at all our results, as the integrated, average profiles of [Mg/Fe] for barred and unbarred galaxies exceeds only slightly (by dex; see Fig. 7) the value of [Mg/Fe] for which V15 –enhanced models have been computed.
For each spectrum, we derive the SSP-equivalent age, metallicity, and [Mg/Fe], by minimizing the following equation:
| (1) |
where the index runs over the available indices (H, Fe5015, and Mg), and are observed and model line-strengths, while denote uncertainties on observed line-strengths. The minimization is performed over the grid of SSP model predictions, with varying age, metallicity, and [Mg/Fe] (see above). Uncertainty on best-fit parameters are estimated from bootstrap iterations, where the fitting is repeated after shifting observed line strengths according to their uncertainties.
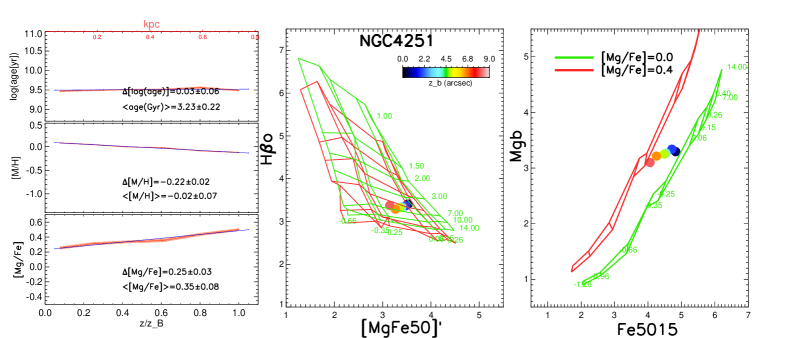
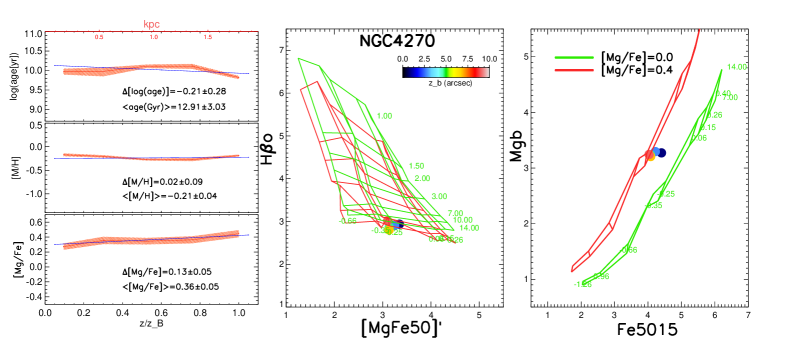
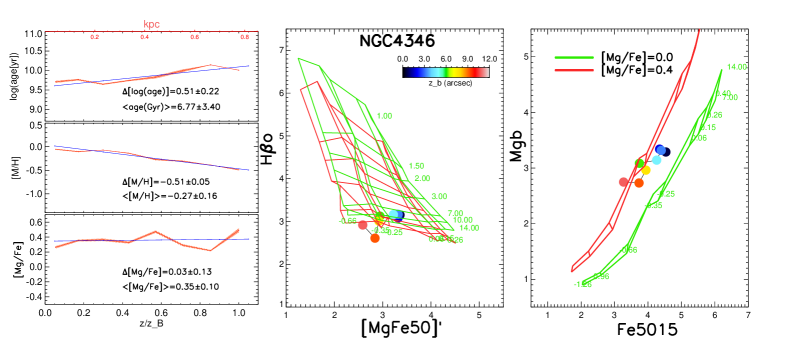
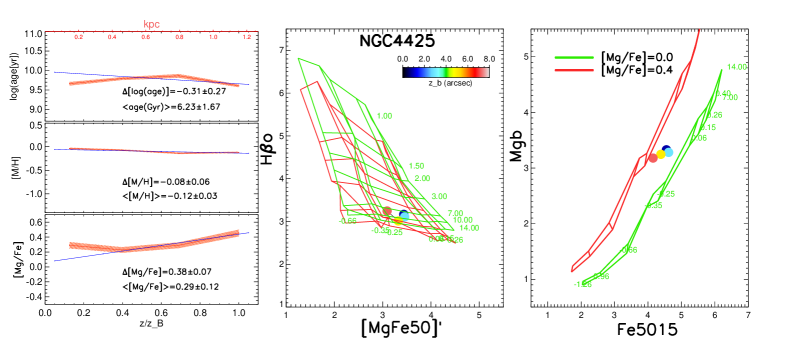
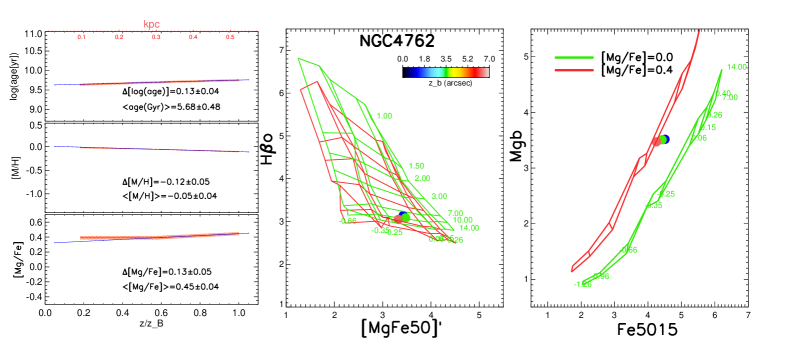
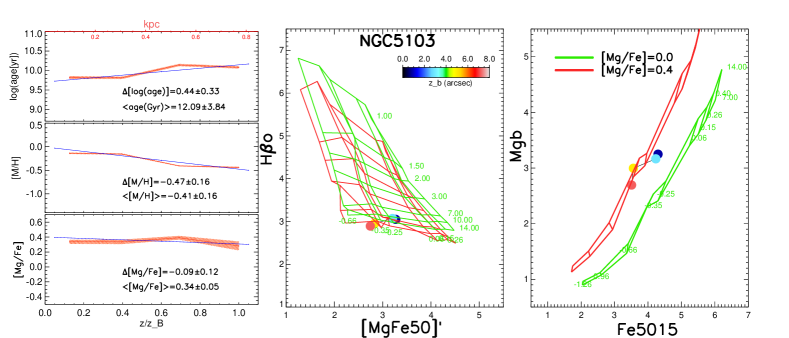
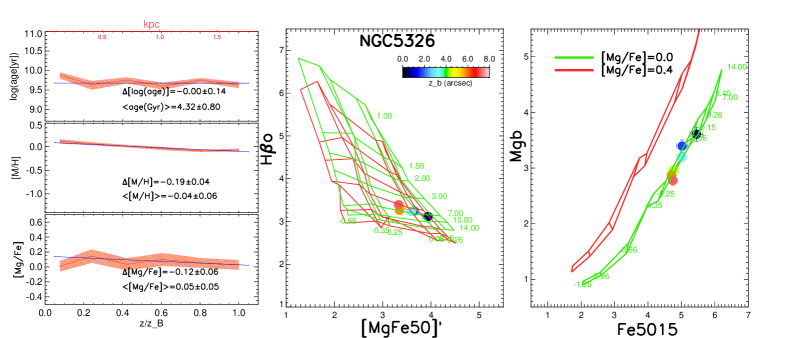
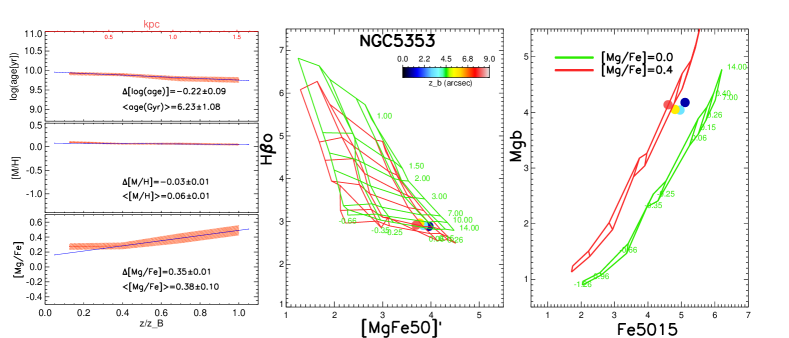
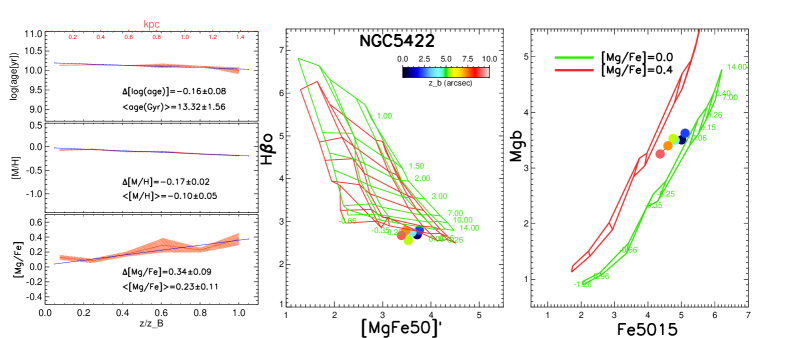
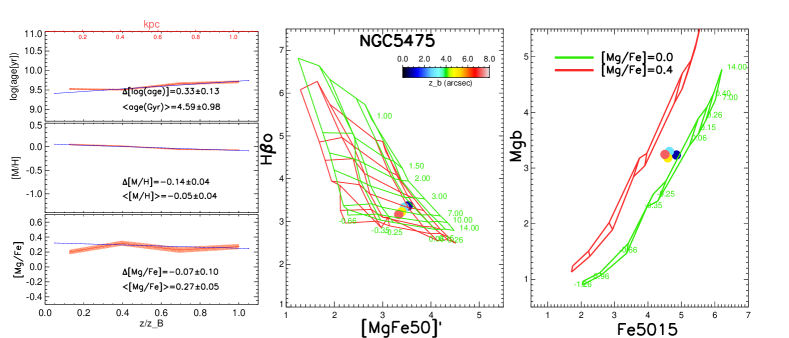
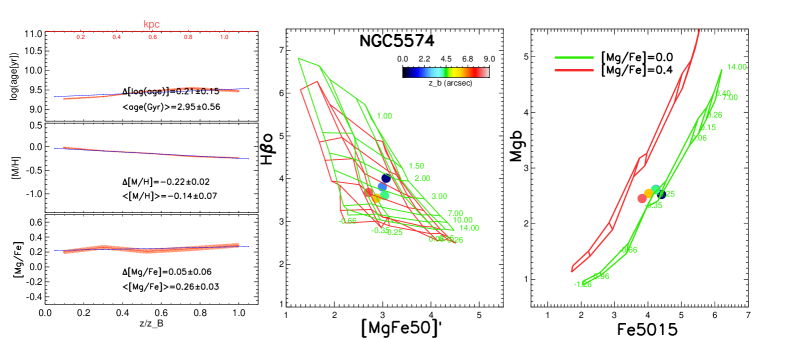
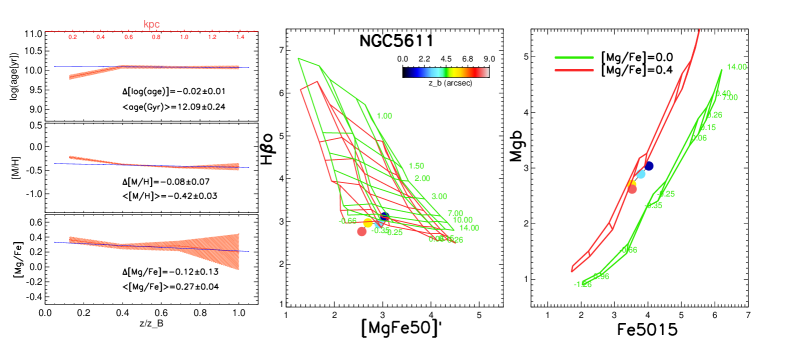
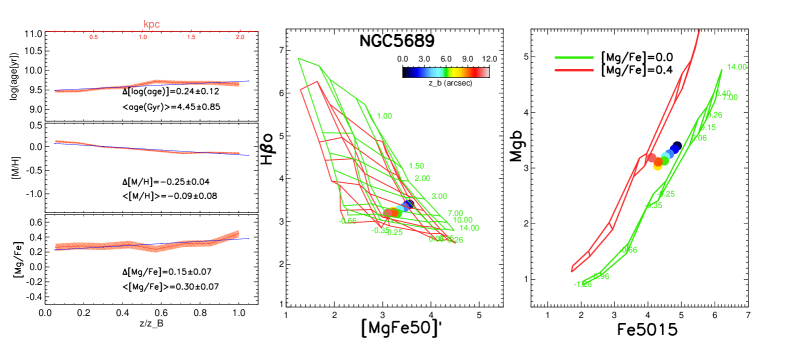
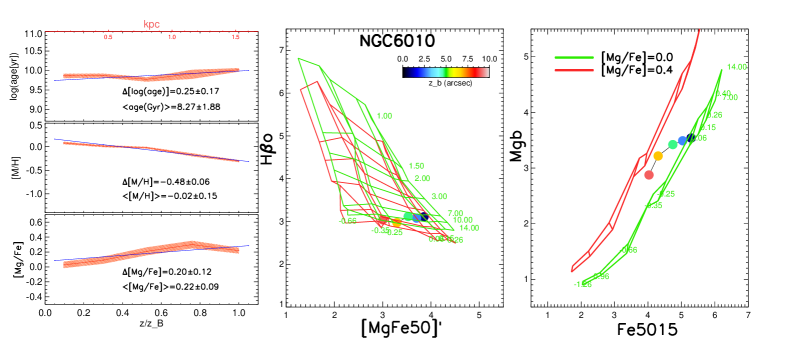
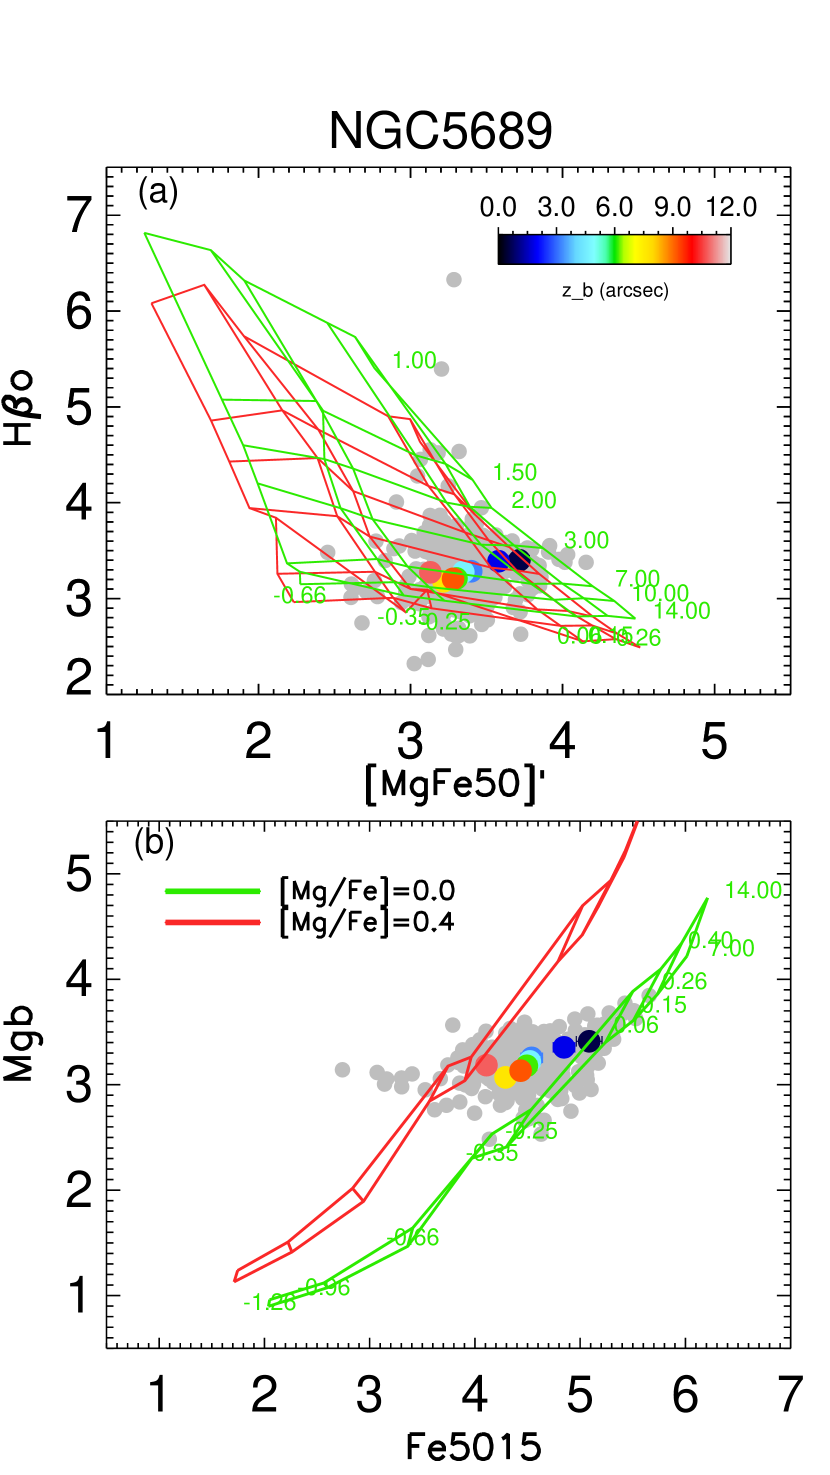
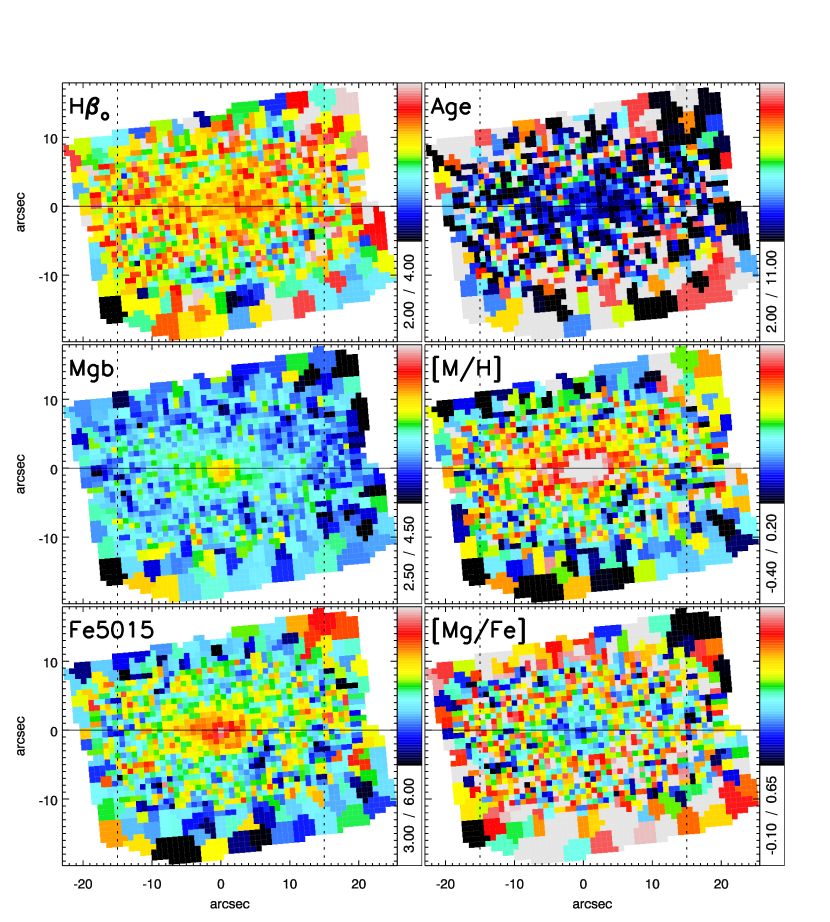
Figure 2 shows the line-strength indices and resulting stellar population parameters for NGC 5689, a representative barred galaxy with BP bulge in our sample. In the left column, panel (a) shows the H versus [MgFe50]’ for all Voronoi bins (grey filled circles) within the bulge analysis window of NGC5689. Coloured symbols indicate representative values of Voronoi bins at various heights from the major axis (see §3.2 for more details). Overlaid are the MILES SSP models for different ages and metallicities. Panel (b) presents the Mg versus Fe5015 diagram for this galaxy. The green and red grids correspond to the scaled-solar and [Mg/Fe]–enhanced SSP models, respectively. The middle column of the figure shows the H, Fe5015, and Mg index maps, while the right column presents the age, metallicity and [Mg/Fe] maps obtained with the procedure outlined above.
3.1 Comparison of the mean stellar population parameters of bulges of barred and unbarred galaxies
The majority of stellar population studies in bulges focus on the integrated properties inside a certain aperture, near the centre. These studies could therefore strongly depend on the presence (or not) of different subcomponents (e.g. a young stellar central disc, nuclear cluster; see Peletier et al., 2007). This effect is particularly important in highly-inclined galaxies, where the main disc contamination is a problematic issue. To avoid these difficulties, we limit our analysis of the bulge stellar populations to a window well beyond the disc plane. More specifically, the regions of interest in our bulges are limited to the clean (e.g. dust free) side of the galaxies, between and along the major axis and to along the minor axis of galaxies. The indicates the vertical extent of the region, close to disc plane that might be contaminated by dust and/or central components (evaluated by visual inspection of the velocity maps).
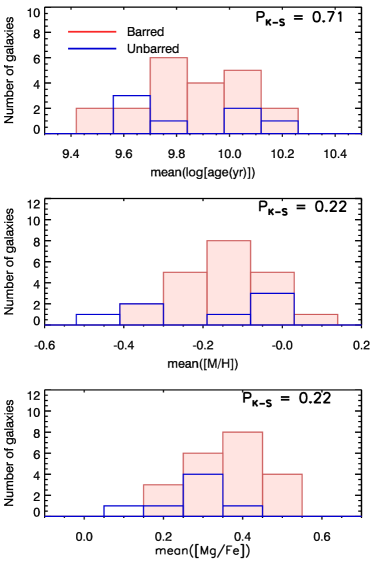
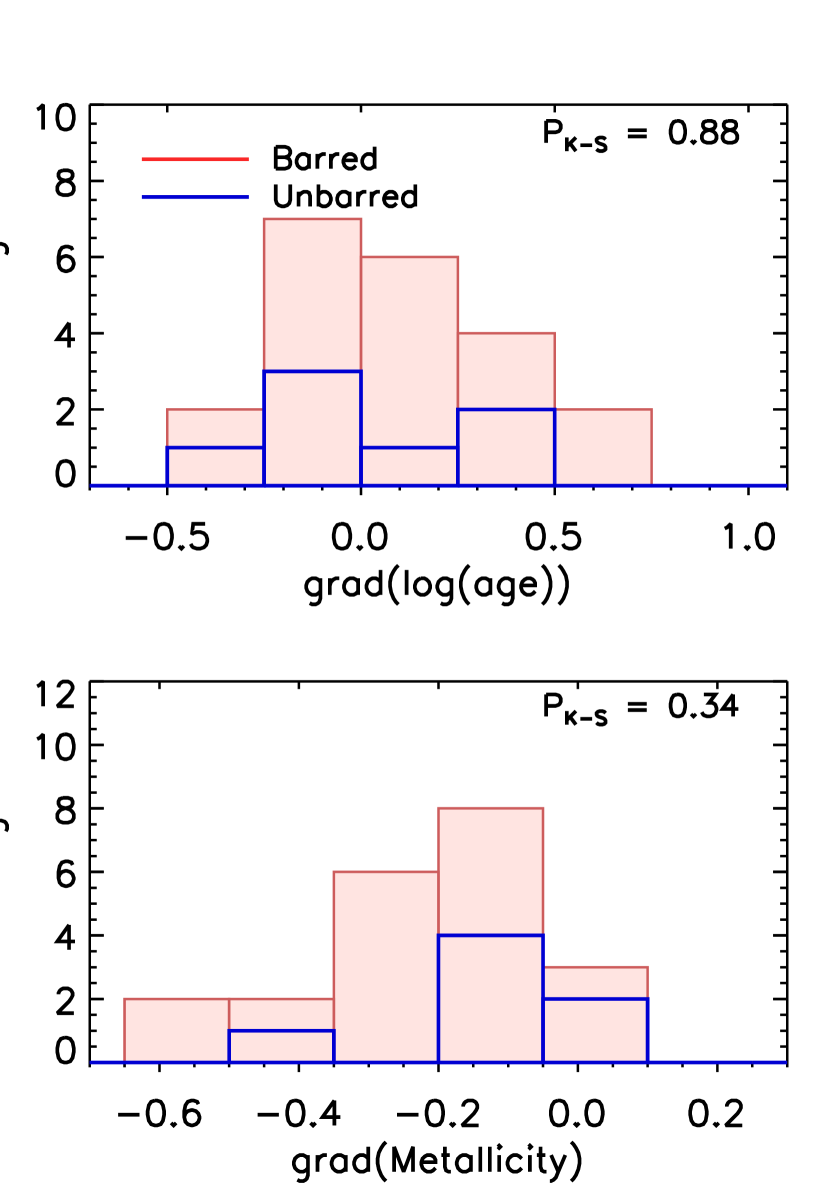
In order to investigate stellar populations of bars and the influence of bars on bulges of nearby galaxies, we compare the key stellar population parameters within the bulge analysis windows of our sample. Figure 3 shows the distributions of the mean SSP-equivalent age, metallicity and [Mg/Fe] for our two classes of bulges. A Kolmogorov–Smirnov test (hereafter K–S) indicates that the difference between the two populations of bulges is not significant. This is in agreement with results of Jablonka et al. (2007) who found no significant difference between the stellar populations of early type (S0–S(B)b) edge-on barred and unbarred galaxies.
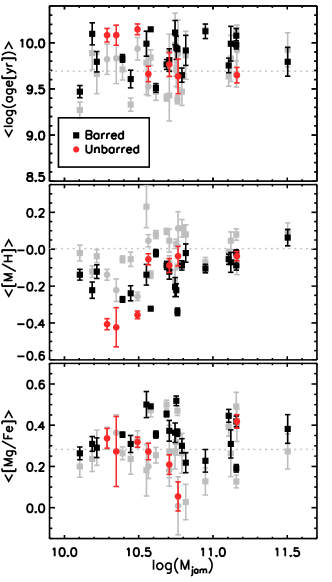
A key aspect to constrain bulge formation scenarios is the correlation of the stellar population properties of bulges, with the total mass of their parent galaxies. Figure 4 shows the distribution of the mean SSP-equivalent age, metallicity and [Mg/Fe] of the bulges (within the bulge analysis window) versus the dynamical mass (MJAM) estimates from (Cappellari et al., 2013), within one effective radius () of galaxies. The central stellar populations (within a circular aperture with a radius of ) are also shown (grey filled circles). As this figure shows, no significant correlations of the stellar population parameters with the dynamical mass are found, except for metallicity, where more massive galaxies harbour on average more metal rich bulges. In good agreement with the results by Jablonka et al. (2007), most of bulges in our sample, independent of the presence of the bar, are more metal rich, younger and less [Mg/Fe]–enhanced in the central regions. Jablonka et al. (2007) argued that the outer regions of bulges, which are generally older and more metal poor than central regions consist of the first stars to form, supporting those scenarios in which star formation proceeds from the outer parts inwards. Here, we provide a different explanation and interpret the observed stellar population properties in the central regions of bulges as due to higher (and possibly unsought) contamination level of main disc components in stellar population patterns of bulges.
3.2 Vertical gradients
Exploring the possible influence of bar on the formation and evolution of bulges is not possible without understanding the variations of stellar population parameters with radius. Here, we have taken advantage of the spatially resolved stellar population maps to study the vertical gradients of the SSP-equivalent age, metallicity and [Mg/Fe] in our sample.
For this purpose we have defined, on the clean (i.e. dust-free) side of our galaxies, a set of pseudo-slits (from to ), parallel to the major axis of the bulge, at various heights from the major axis. The slits cover the whole vertical extent of the bulge from to . The outer slits (with respect to the major axis) are wider to compensate for the small number of contributed data points (Voronoi bins), so that the number of bins within all slits is almost the same. The vertical profiles are constructed by finding the mean value of stellar population parameter in question in each slit at different heights from the disc plane, normalised to . The related errors are calculated as the standard error of the means in each pseudo–slit. In order to evaluate the vertical gradients in age, metallicity and [Mg/Fe] in our bulges, we fit an error-weighted straight line to the individual profiles excluding the regions close to disc plane (), which are most likely affected by contamination of dust and/or central components. The slope of the lines (vertical gradients) and the related errors for all galaxies in our sample are listed in Table 2.
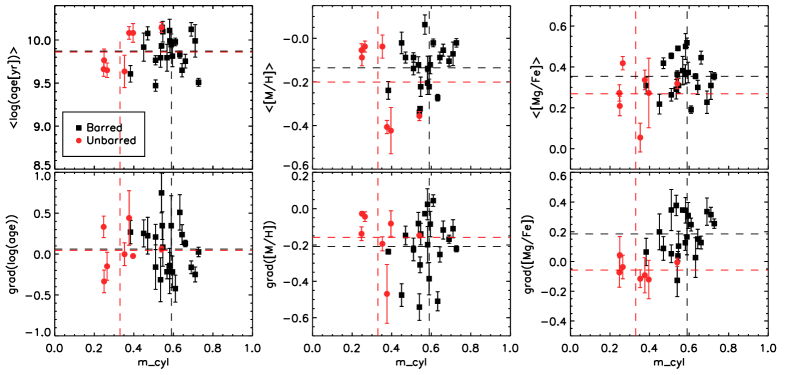
Figure 5 demonstrates the means and the vertical gradients of the SSP-age, metallicity and [Mg/Fe] of bulges as a function of level of cylindrical rotation () for all galaxies in our sample. These results reveal a trend towards steeper positive vertical gradients in [Mg/Fe] for bulges with higher level of cylindrical rotation, which are mostly barred systems (lower right panel). However, as noted earlier, cylindrical rotation cannot be considered a reliable kinematic property to identify the full population of barred galaxies, as this feature strongly depends on bar orientation and galaxy inclination.
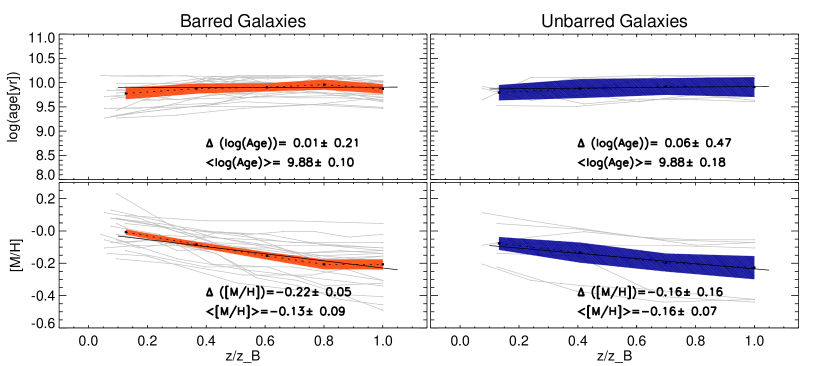
In the left panels of Fig. 6, we present the vertical profiles of the SSP equivalent metallicity and age for the 2 classes of bulges in our sample, together with the error-weighted averaged profiles. To derive the averaged profiles, the individual data points are binned so that each non-overlapping bin contains the same number of data points. The error weighted average and the corresponding error in each bin are determined using the maximum-likelihood method (see Taylor, 1982), so that data points with smaller uncertainties in each bin contributed more to the computed mean than those with larger error bars. The right panels show the distribution of average values in each class. The individual SSP-equivalent population profiles, along the minor axis for all bulges in our sample are presented in Appendix B. The figure shows that the mean age profiles for our sample are rather consistent, in mean values and slope, for both barred and unbarred galaxies. The metallicity gradient is negative in both cases too, although it appears to be somewhat flatter for unbarred systems. Mean values, though, are very similar for both types of bulges.
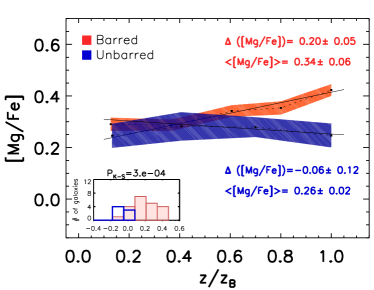
More interestingly, as shown in Fig. 7, the distribution
and gradients of [Mg/Fe] are remarkably different for barred and unbarred galaxies.
[Mg/Fe] gradients are mostly positive in barred galaxies, while for unbarred ones they are
mostly flat. A Kolmogorov-Smirnov (K-S) test gives a probability of
that vertical [Mg/Fe] gradients of the barred and unbarred bulges are drawn from
the same distribution.
A major concern, in this kind of studies is that our gradient measurements could be severely biased against the physical scale height of the bulges. To test this, we have computed the correlation between the [Mg/Fe] gradients scaled to the physical size of the bulge along the minor axis, in kpc units and normalised to , in arcsec. Our results, not shown here, are very consistent in both cases without major differences, except for few cases with relatively small bulges. We have also investigated whether the gradients measured in our galaxies depend on the potential level of contamination introduced by the projection of main disc behind the bulges in those galaxies with lowest inclinations in our sample. We have confirmed that the average and slope values obtained for the full sample are consistent with those for the least inclined galaxies alone.
These results leave us with a very intriguing picture with very similar average stellar population values for barred and unbarred galaxies, consistent mean age profiles, slightly steeper metallicity gradients in barred galaxies, but most notably a drastic different in the vertical [Mg/Fe] gradient between them. In the next section we will describe the implications of these results and outline possible scenarios that might explain them. We will also compare them with those from the closest barred galaxy known: the Milky Way.
4 Discussion
The results presented here pose a challenge to many theories about the formation and evolution of barred galaxies. A common approach to investigate their influence on the formation and evolution of bulges is to compare the stellar population properties of galaxies with and without bars. If bars follow a different evolutionary path, we would expect different abundance patterns in bulges of barred and unbarred galaxies.
Most bulges studies in the literature show similar and relatively broad distributions in mean SSP-equivalent ages and mostly no vertical gradients in age, independent of the bulge classification (e.g. Falcón-Barroso et al., 2002; Jablonka et al., 2007; Peletier et al., 2007; Morelli et al., 2008). This is in agreement with earlier findings for early-type galaxies (e.g. Mehlert et al., 2003; Sánchez-Blázquez et al., 2006). Furthermore, the flatness of the vertical age profiles in barred galaxies in our sample could in principle support those formation scenarios of bulges in which the bulge forms with very little influence from the disc (e.g. mergers or monolithic collapse), as expected in bulges of unbarred galaxies. It is worth noting that the fact that old stellar populations are observed in bulges of galaxies does not necessarily mean that bars are old structures, as bar might have formed recently out from old stars, coming from the disc (Sánchez-Blázquez et al., 2011). The fact that barred galaxies contain old stellar populations is, however, in marked contrast to the internal secular evolution scenario expected in these systems, in which the barred bulges are produced through radial and vertical transport of disc material (which is typically young), due to instabilities and resonances (see Martinez-Valpuesta & Shlosman, 2004; Moorthy & Holtzman, 2006; Kormendy & Kennicutt, 2004). Originally, it was thought that if bulges formed secularly, stars that have been scattered furthest from the disc are the oldest stars and therefore a positive age gradient is expected (Freeman, 2008). Considering the stellar age pattern of bulges in our sample, and more specifically barred galaxies, one could naïvely conclude that a pure secular evolution scenario via the bar buckling process, which is the widely acceptable mechanism to form bulges in barred galaxies, cannot explain the observed properties of bulges, because then the stars at large scale heights should be younger. The only solution we see that bars were formed long time ago, and were not destroyed later on. The disc itself was later rejuvenated with newly formed stars from infalling gas close to the midplane, as we are seeing in our own Milky Way. This leads to these bulges having old ages overall, except in the midplane, where in general younger stars are being seen.
Both sample of bulges show negative metallicity gradients along the minor axis, a behaviour that have been formerly interpreted as a direct evidence against the secular evolution scenario of bulges. However, more recent numerical models show that, the negative metallicity gradient in secularly formed bulges can be consistently reproduced, depending on the original disc radial gradients (Martinez-Valpuesta & Gerhard, 2013), vertical gradients of the composition of two-component disc (Bekki & Tsujimoto, 2011) or both (Di Matteo et al., 2014). Other bulge formation scenarios, mergers and monolithic collapse, also predict such metallicity gradients (Eggen et al., 1962; Larson, 1974; Arimoto & Yoshii, 1987). Therefore, the negative metallicity gradients along the minor axis of bulges of barred and unbarred galaxies do not allow us to single out the bulge formation and evolutionary scenarios.
The most striking feature found in our data is that bulges of barred galaxies are in general more [Mg/Fe]–enhanced at higher latitudes than similar regions of bulges in unbarred systems. This result appears to reveal that both kinds of bulges have different origins. Bulges of unbarred galaxies are often denoted as ’classical’ or ’elliptical-like’ bulges based on the remarkable resemblance they have in many properties (from morphology to stellar populations) to elliptical galaxies. If, as suggested in the literature, they have similar formation and evolution channels, then bulges of unbarred galaxies have been formed through merger of monolithically collapsed clouds at high redshifts (Baugh et al., 1996), similar to low-luminosity ellipticals (e.g. Moorthy & Holtzman, 2006). In that situation the material that forms those bulges comes typically from low-mass systems where the [Mg/Fe] is typically low. While there is some level of enrichment in this process (that is why the typical [Mg/Fe] values are higher than in disc material), the final mixture of all that material is lower than the one they could have if they were made of primordial stars (those that formed quickly at very early epochs).
For barred galaxies, the high [Mg/Fe] abundance ratio found at high latitudes implies that stars at higher z in barred galaxies formed much faster compared to those in the inner regions. The reason why this is not clearly seen in the age gradients, where one may expect a more positive gradient in barred, relative to unbarred systems, is that beyond 6 Gyr it is more and more difficult to distinguish formation events on time-scales of the order of less than 1Gyr. Our age diagnostic, the H index, will not give us that level of precision with the typical observational uncertainties we have in the H equivalent width (see Cervantes & Vazdekis, 2009, for details).
Since young populations are not observed at high z in barred galaxies, it is clear that the bar was made of stars that formed long time ago. The alternative is that the bar will selectively push old material vertically from a disc made of young and old stars (like the ones we observed in the nearby Universe), which is not easy to explain. The high [Mg/Fe] observed in those outer regions seem to imply that whatever process that formed these stars with such high [Mg/Fe] must have formed very quickly. We are thus saying that the bars we observed today (at least in our sample) were bars that formed long time ago. Numerical simulations of barred galaxies suggest they are made from disc instabilities and go through a particularly important buckling phase where a lot of material gets pumped-up to higher latitudes above the disc plane (see Martinez-Valpuesta & Shlosman, 2004; Athanassoula, 2005; Debattista et al., 2006; Martinez-Valpuesta et al., 2006; Saha et al., 2012). If true, our observations are setting an important constraint on the time that process occurred. The mean age values and especially the positive [Mg/Fe] gradients suggest this process took place very early on in the life of galaxies. These results go along the lines of recent works in the literature pointing at the early formation of bars (see e.g. Seidel et al., 2015, 2016) and those analysing the evolution of the bar fraction in disc galaxies as a function of redshift (see Sheth et al., 2008; Melvin et al., 2014).
The Milky Way (MW) is a particular case of a barred system where we can directly resolve the distribution of the different kinematic and chemical stellar populations. The bulge is known to consist of predominantly old stars ( 10 Gyr) with a very small fraction (up to 3.5%) of the stars younger than 5 Gyr (Clarkson et al., 2008, 2011). The origin of these intermediate-age stars is still under debate and different mechanisms have been suggested to interpret the observational results (see Gonzalez & Gadotti, 2016, for a detailed review of all arguments). The metallicity distribution function of starts in the Galactic bulge is broad, asymmetric (Rich, 1990; Ibata & Gilmore, 1995; Zoccali et al., 2003, 2008) with a clear vertical gradient of 0.6 dex/kpc decreasing towards high latitudes (e.g. Zoccali et al., 2008; Ness et al., 2013). The vertical metallicity gradient of the MW bulge is around -0.6 dex/kpc (Zoccali et al., 2008), -0.06 dex/deg=-0.43 dex/kpc (Gonzalez et al., 2013) and -0.45 dex/kpc (Ness et al., 2013). In any case, the three measurements are higher than the average value we measured in bulges of barred galaxies ([M/H]=-0.3 dex/kpc). In principle, it could seem that the MW is somehow different to the rest of the galaxies. This difference could be partially due to different method we use to measure the vertical gradients. In case of MW, we are always using the minor axis, but in external galaxies we are averaging over the entire extent of the bulge (including those bulge regions away from the minor axis). In order to understand the difference we have used the simulations by Martinez-Valpuesta & Gerhard (2013) to compute the gradients along the minor axis and also averaging within longitude . The vertical gradients decrease by 28%, from -0.46 dex/kpc to -0.33 dex/kpc respectively. Moreover, it is worth noting that, when looking at bulges of external galaxies we are integrating foreground and background light, and in the MW we always have a magnitude limit avoiding many background stars. These two explanations can explain the differences with the MW.
Finally, the -element abundances of the MW bulge show that stars with [Fe/H] are more -enhanced than metal-rich stars ([Fe/H]) (Cunha & Smith, 2006; Lecureur et al., 2007; Rich et al., 2007). While the measurements in the MW come from individual stars, they seem to be consistent with those from unresolved stellar populations in our galaxy sample. In this respect, as shown for the stellar kinematics in Paper I, the MW is no different from the typical barred galaxy in the nearby Universe.
On the theoretical side, there has been mounting evidence supporting the long-lasting nature of bars (e.g. Athanassoula, 2003; Martinez-Valpuesta et al., 2006; Debattista et al., 2006; Athanassoula et al., 2013). More recently Debattista et al. (2016, private communication) studied, in the context of the MW analysis, the influence of an evolving long lasting bar on the stellar populations in the bulge dominated region, offering a somewhat alternative scenario. By means of a pure N–body simulation, they show that the stellar populations of disc material that have different initial in-plane kinematics separate when a bar forms. The population that has hotter radial kinematics also has hotter vertical kinematics and becomes the vertically thick and box-shaped part of the bar, while the radially cooler populations is vertically thin. In this scenario, the declining metallicity profile towards higher latitudes and vertically rising abundance ratio in the Galactic bulge are interpreted as a result of this separation of initially nearly co-spatial populations. This is an interesting evolutionary scenario, but how the original superposition of differentiated discs could be formed is still unknown. While this scenario is also consistent with our observations of more distant galaxies, we are not yet in position to robustly disentangle the different chemo-kinematic components of our galaxies, as done in the MW. In fact, while we agree on the final set of observed properties in the galaxies we see today, we provide a different explanation to the way we get to those properties. Current attempts to do so are limited to very dramatic cases of large-scale counter-rotating disc components (e.g. Coccato et al., 2013; Johnston et al., 2013). Meanwhile, more chemo-dynamical simulations are also necessary to confirm this issue and explain possible segregation processes, induced by bars, to produce the vertical gradients in stellar population of secularly formed bulges.
5 Conclusions
This paper investigates the imprints of bars on the stellar population properties of bulges and more specifically, the vertical gradients of stellar populations. For this purpose, we have carried out a detailed analysis of the stellar age, metallicity and [Mg/Fe] of 28 highly-inclined () disc galaxies () , from S0 to S(B)c, observed with the SAURON integral field spectrograph. The choice of high-inclination galaxies ensures minimal contamination by the stellar disc. Following the approach, applied in Paper I, the sample is divided into two clean samples of barred (n=21) and unbarred galaxies (n=7). Comparing the stellar population properties and vertical gradients of bulges in these two classes, we find that while :
-
•
The distribution of the mean stellar age, metallicity and [Mg/Fe] in the bulges of barred and unbarred galaxies are not statistically distinct.
-
•
Galaxies in our sample span a wide range of vertical gradients in SSP-equivalent stellar ages and there is no significant difference between barred and unbarred galaxies.
-
•
Both classes of bulges present negative metallicity and the gradients are not statistically distinct for barred and unbarred galaxies. A similar pattern has been reported for the BP bulges of MW.
We see a strong difference in the vertical gradient in [Mg/Fe] in barred and unbarred galaxies. The vertical gradients in [Mg/Fe] for barred galaxies are mostly positive, while for unbarred galaxies the profile is almost flat. In other words, bulges of barred galaxies are in general more [Mg/Fe]–enhanced at higher latitudes than regions, close to disc plane and therefore demonstrate a positive [Mg/Fe] gradients along the minor axis.
Such high level of [Mg/Fe] ratio in barred bulges together with the relatively old population of bar material, as old as unbarred bulges in our sample, suggests that bars are long-lasting structures made of old material. The origin of such [Mg/Fe]–enhanced stars is not yet clear, but a simple interpretation would be that the buckling phase leading to the formation of the bar took place long time ago ( 10 Gyr). More detailed chemo-dynamical studies are still needed to shed more light on this issue. What it seems clear is that the positive vertical gradient in [Mg/Fe] is a characteristic feature of barred bulges and therefore different evolution mechanisms are required to interpret the stellar population differences observed between bulges of barred and unbarred galaxies.
Acknowledgments
A.M. wishes to thank the School of Astronomy, IPM and the Iranian National Observatory (INO) for providing support while working on this paper. A.M. also acknowledges the Isaac Newton Group of Telescopes (ING), the Instituto de Astrofísica de Canarias (IAC) and the Kapteyn Astronomical Institute for hospitality and support while this paper was in progress. The authors acknowledge support from the Spanish Ministry of Economy and Competitiveness (MINECO) through grants AYA2009-11137, AYA2016-77237-C3-1-P and AYA2014-58308-P. Funding for SDSS-III has been provided by the Alfred P. Sloan Foundation, the Participating Institutions, the National Science Foundation, and the U.S. Department of Energy Office of Science. The SDSS-III web site is http://www.sdss3.org/.
| Galaxy | Bar | age | [M/H] | [Mg/Fe] | log(age) | [M/H] | [Mg/Fe] | log(age) | [M/H] | [Mg/Fe] |
|---|---|---|---|---|---|---|---|---|---|---|
| (Gyr) | (dex) | (dex) | (dex/) | (dex/) | (dex/) | (dex/kpc) | (dex/kpc) | (dex/kpc) | ||
| (1) | (2) | (3) | (4) | (5) | (6) | (7) | (8) | (9) | (10) | (11) |
| NGC3098 | unbarred | |||||||||
| NGC4026 | BP | |||||||||
| NGC4036 | unbarred | |||||||||
| NGC4179 | BP | |||||||||
| NGC4251 | BP | |||||||||
| NGC4270 | Bar | |||||||||
| NGC4346 | Bar | |||||||||
| NGC4425 | BP | |||||||||
| NGC4435 | Bar | |||||||||
| NGC4461 | Bar | |||||||||
| NGC4474 | Bar | |||||||||
| NGC4521 | Bar | |||||||||
| NGC4710 | BP | |||||||||
| NGC4762 | Bar | |||||||||
| NGC5103 | unbarred | |||||||||
| NGC5326 | unbarred | |||||||||
| NGC5353 | BP | |||||||||
| NGC5422 | BP | |||||||||
| NGC5475 | unbarred | |||||||||
| NGC5574 | Bar | |||||||||
| NGC5611 | unbarred | |||||||||
| NGC5689 | BP | |||||||||
| NGC5707 | unbarred | |||||||||
| NGC5746 | BP | |||||||||
| NGC5838 | Bar | |||||||||
| NGC5854 | BP | |||||||||
| NGC5864 | BP | |||||||||
| NGC6010 | Bar |
NOTES: (1) Galaxy name. (2) Bar presence based on our kinematic analysis as in Paper I. (3), (4) and (5) Mean SSP-equivalent age, metallicity and [Mg/Fe] within the bulge analysis window, respectively. (6), (7) and (8) Vertical gradients in age, metallicity and [Mg/Fe]. Gradients calculated in the range , normalized by the vertical extent of the bulge () in arcsec. (9), (10) and (11) Vertical gradients in age, metallicity and [Mg/Fe], expressed in physical units (dex/kpc).
References
- Ahn et al. (2014) Ahn C. P., Alexandroff R., Allende Prieto C., Anders F., Anderson S. F., Anderton T., Andrews B. H., Aubourg É., Bailey S., Bastien F. A., et al. 2014, ApJS, 211, 17
- Arimoto & Yoshii (1987) Arimoto N., Yoshii Y., 1987, A&A, 173, 23
- Athanassoula (2003) Athanassoula E., 2003, MNRAS, 341, 1179
- Athanassoula (2005) Athanassoula E., 2005, MNRAS, 358, 1477
- Athanassoula (2013) Athanassoula E., 2013, Bars and secular evolution in disk galaxies: Theoretical input. p. 305
- Athanassoula (2016) Athanassoula E., 2016, Galactic Bulges, 418, 391
- Athanassoula et al. (2013) Athanassoula E., Machado R. E. G., Rodionov S. A., 2013, MNRAS, 429, 1949
- Bacon et al. (2001) Bacon R., Copin Y., Monnet G., Miller B. W., Allington-Smith J. R., Bureau M., Carollo C. M., Davies R. L., Emsellem E., Kuntschner H., Peletier R. F., Verolme E. K., de Zeeuw P. T., 2001, MNRAS, 326, 23
- Baugh et al. (1996) Baugh C. M., Cole S., Frenk C. S., 1996, MNRAS, 283, 1361
- Bekki & Tsujimoto (2011) Bekki K., Tsujimoto T., 2011, MNRAS, 416, L60
- Bureau & Athanassoula (2005) Bureau M., Athanassoula E., 2005, ApJ, 626, 159
- Bureau et al. (2004) Bureau M., Athanassoula E., Chung A., Aronica G., 2004, in Block D. L., Puerari I., Freeman K. C., Groess R., Block E. K., eds, Penetrating Bars Through Masks of Cosmic Dust Vol. 319 of Astrophysics and Space Science Library, Bar-Driven Evolution and 2D Spectroscopy of Bulges. p. 139
- Bureau & Freeman (1999) Bureau M., Freeman K. C., 1999, AJ, 118, 126
- Cappellari & Copin (2003) Cappellari M., Copin Y., 2003, MNRAS, 342, 345
- Cappellari et al. (2011) Cappellari M., Emsellem E., Krajnović D., McDermid R. M., Scott N., Verdoes Kleijn G. A., et al. 2011, MNRAS, 413, 813
- Cappellari et al. (2013) Cappellari M., Scott N., Alatalo K., Blitz L., Bois M., Bournaud F., Bureau M., Crocker A. F., 2013, MNRAS, 432, 1709
- Cappellari et al. (2013) Cappellari M., Scott N., Alatalo K., Blitz L., Bois M., Bournaud F., Bureau M., Crocker A. F., Davies R. L., Davis T. A., 2013, MNRAS, 432, 1709
- Cervantes & Vazdekis (2009) Cervantes J. L., Vazdekis A., 2009, MNRAS, 392, 691
- Chung & Bureau (2004) Chung A., Bureau M., 2004, AJ, 127, 3192
- Clarkson et al. (2008) Clarkson W., Sahu K., Anderson J., Smith T. E., Brown T. M., Rich R. M., Casertano S., Bond H. E., Livio M., Minniti D., Panagia N., Renzini A., Valenti J., Zoccali M., 2008, ApJ, 684, 1110
- Clarkson et al. (2011) Clarkson W. I., Sahu K. C., Anderson J., Rich R. M., Smith T. E., Brown T. M., Bond H. E., Livio M., Minniti D., Renzini A., Zoccali M., 2011, ApJ, 735, 37
- Coccato et al. (2013) Coccato L., Morelli L., Pizzella A., Corsini E. M., Buson L. M., Dalla Bontà E., 2013, A&A, 549, A3
- Coelho et al. (2005) Coelho P., Barbuy B., Meléndez J., Schiavon R. P., Castilho B. V., 2005, A&A, 443, 735
- Coelho et al. (2007) Coelho P., Bruzual G., Charlot S., Weiss A., Barbuy B., Ferguson J. W., 2007, MNRAS, 382, 498
- Coelho & Gadotti (2011) Coelho P., Gadotti D. A., 2011, ApJ, 743, L13
- Cunha & Smith (2006) Cunha K., Smith V. V., 2006, ApJ, 651, 491
- Debattista et al. (2006) Debattista V. P., Mayer L., Carollo C. M., Moore B., Wadsley J., Quinn T., 2006, ApJ, 645, 209
- Di Matteo et al. (2014) Di Matteo P., Haywood M., Gómez A., van Damme L., Combes F., Hallé A., Semelin B., Lehnert M. D., Katz D., 2014, A&A, 567, A122
- Eggen et al. (1962) Eggen O. J., Lynden-Bell D., Sandage A. R., 1962, ApJ, 136, 748
- Eskridge et al. (2000) Eskridge P. B., Frogel J. A., Pogge R. W., Quillen A. C., Davies R. L., DePoy D. L., Houdashelt M. L., Kuchinski L. E., Ramírez S. V., Sellgren K., Terndrup D. M., Tiede G. P., 2000, AJ, 119, 536
- Falcón-Barroso et al. (2006) Falcón-Barroso J., Bacon R., Bureau M., Cappellari M., Davies R. L., de Zeeuw P. T., Emsellem E., Fathi K., Krajnović D., Kuntschner H., McDermid R. M., Peletier R. F., Sarzi M., 2006, MNRAS, 369, 529
- Falcón-Barroso et al. (2002) Falcón-Barroso J., Peletier R. F., Balcells M., 2002, MNRAS, 335, 741
- Freeman (2008) Freeman K. C., 2008, in Bureau M., Athanassoula E., Barbuy B., eds, Formation and Evolution of Galaxy Bulges Vol. 245 of IAU Symposium, Galactic bulges: overview. pp 3–10
- Gonzalez & Gadotti (2016) Gonzalez O. A., Gadotti D., 2016, Galactic Bulges, 418, 199
- Gonzalez et al. (2013) Gonzalez O. A., Rejkuba M., Zoccali M., Valent E., Minniti D., Tobar R., 2013, A&A, 552, A110
- Grosbøl et al. (2004) Grosbøl P., Patsis P. A., Pompei E., 2004, A&A, 423, 849
- Iannuzzi & Athanassoula (2015) Iannuzzi F., Athanassoula E., 2015, MNRAS, 450, 2514
- Ibata & Gilmore (1995) Ibata R. A., Gilmore G. F., 1995, MNRAS, 275, 605
- Jablonka et al. (2007) Jablonka P., Gorgas J., Goudfrooij P., 2007, A&A, 474, 763
- Johnston et al. (2013) Johnston E. J., Merrifield M. R., Aragón-Salamanca A., Cappellari M., 2013, MNRAS, 428, 1296
- Knapen et al. (2000) Knapen J. H., Shlosman I., Peletier R. F., 2000, ApJ, 529, 93
- Kormendy (2013) Kormendy J., 2013, Secular Evolution in Disk Galaxies. p. 1
- Kormendy & Illingworth (1982) Kormendy J., Illingworth G., 1982, ApJ, 256, 460
- Kormendy & Kennicutt (2004) Kormendy J., Kennicutt Jr. R. C., 2004, ARA&A, 42, 603
- Krajnović et al. (2011) Krajnović D., Emsellem E., Cappellari M., Alatalo K., Blitz L., Bois M., Bournaud F., Bureau M., Davies R. L., Davis T. A., 2011, MNRAS, 414, 2923
- Kuijken & Merrifield (1995) Kuijken K., Merrifield M. R., 1995, ApJ, 443, L13
- Larson (1974) Larson R. B., 1974, MNRAS, 166, 585
- Lecureur et al. (2007) Lecureur A., Hill V., Zoccali M., Barbuy B., Gómez A., Minniti D., Ortolani S., Renzini A., 2007, A&A, 465, 799
- Marinova & Jogee (2007) Marinova I., Jogee S., 2007, ApJ, 659, 1176
- Martín-Navarro (2016) Martín-Navarro I., 2016, MNRAS, 456, L104
- Martinez-Valpuesta & Gerhard (2013) Martinez-Valpuesta I., Gerhard O., 2013, ApJ, 766, L3
- Martinez-Valpuesta & Shlosman (2004) Martinez-Valpuesta I., Shlosman I., 2004, ApJ, 613, L29
- Martinez-Valpuesta et al. (2006) Martinez-Valpuesta I., Shlosman I., Heller C., 2006, ApJ, 637, 214
- Mehlert et al. (2003) Mehlert D., Thomas D., Saglia R. P., Bender R., Wegner G., 2003, A&A, 407, 423
- Melvin et al. (2014) Melvin T., Masters K., Lintott C., Nichol R. C., Simmons B., Bamford S. P., Casteels K. R. V., Cheung E., Edmondson E. M., Fortson L., Schawinski K., Skibba R. A., Smith A. M., Willett K. W., 2014, MNRAS, 438, 2882
- Merrifield & Kuijken (1999) Merrifield M. R., Kuijken K., 1999, A&A, 345, L47
- Molaeinezhad et al. (2016) Molaeinezhad A., Falcón-Barroso J., Martínez-Valpuesta I., Khosroshahi H. G., Balcells M., Peletier R. F., 2016, MNRAS, 456, 692
- Moorthy & Holtzman (2006) Moorthy B. K., Holtzman J. A., 2006, MNRAS, 371, 583
- Morelli et al. (2008) Morelli L., Pompei E., Pizzella A., Méndez-Abreu J., Corsini E. M., Coccato L., Saglia R. P., Sarzi M., Bertola F., 2008, MNRAS, 389, 341
- Ness et al. (2013) Ness M., Freeman K., Athanassoula E., Wylie-de-Boer E., Bland-Hawthorn J., Asplund M., Lewis G. F., Yong D., Lane R. R., Kiss L. L., 2013, MNRAS, 430, 836
- Paturel et al. (2003) Paturel G., Petit C., Prugniel P., Theureau G., Rousseau J., Brouty M., Dubois P., Cambrésy L., 2003, A&A, 412, 45
- Peletier & Balcells (1997) Peletier R. F., Balcells M., 1997, New A, 1, 349
- Peletier et al. (2007) Peletier R. F., Falcón-Barroso J., Bacon R., Cappellari M., Davies R. L., de Zeeuw P. T., Emsellem E., Ganda K., Krajnović D., Kuntschner H., McDermid R. M., Sarzi M., van de Ven G., 2007, MNRAS, 379, 445
- Peng et al. (2002) Peng C. Y., Ho L. C., Impey C. D., Rix H.-W., 2002, AJ, 124, 266
- Pérez & Sánchez-Blázquez (2011) Pérez I., Sánchez-Blázquez P., 2011, A&A, 529, A64
- Pietrinferni et al. (2004) Pietrinferni A., Cassisi S., Salaris M., Castelli F., 2004, ApJ, 612, 168
- Pietrinferni et al. (2006) Pietrinferni A., Cassisi S., Salaris M., Castelli F., 2006, ApJ, 642, 797
- Rich (1990) Rich R. M., 1990, ApJ, 362, 604
- Rich et al. (2007) Rich R. M., Reitzel D. B., Howard C. D., Zhao H., 2007, ApJ, 658, L29
- Saha et al. (2012) Saha K., Martinez-Valpuesta I., Gerhard O., 2012, MNRAS, 421, 333
- Sánchez-Blázquez (2016) Sánchez-Blázquez P., 2016, Galactic Bulges, 418, 127
- Sánchez-Blázquez et al. (2006) Sánchez-Blázquez P., Gorgas J., Cardiel N., González J. J., 2006, A&A, 457, 809
- Sánchez-Blázquez et al. (2011) Sánchez-Blázquez P., Ocvirk P., Gibson B. K., Pérez I., Peletier R. F., 2011, MNRAS, 415, 709
- Seidel et al. (2015) Seidel M. K., Cacho R., Ruiz-Lara T., Falcón-Barroso J., Pérez I., Sánchez-Blázquez P., Vogt F. P. A., Ness M., Freeman K., Aniyan S., 2015, MNRAS, 446, 2837
- Seidel et al. (2016) Seidel M. K., Falcón-Barroso J., Martínez-Valpuesta I., Sánchez-Blázquez P., Pérez I., Peletier R., Vazdekis A., 2016, ArXiv e-prints
- Sheth et al. (2008) Sheth K., Elmegreen D. M., Elmegreen B. G., Capak P., Abraham R. G., Athanassoula E., Ellis R. S., Mobasher B., Salvato M., Schinnerer E., Scoville N. Z., Spalsbury L., Strubbe L., Carollo M., Rich M., West A. A., 2008, ApJ, 675, 1141
- Taylor (1982) Taylor J. R., 1982, Univ. Sci. Books, Mill Valley, CA, 270p
- Thomas et al. (2011) Thomas J., Saglia R. P., Bender R., Thomas D., Gebhardt K., Magorrian J., Corsini E. M., Wegner G., Seitz S., 2011, MNRAS, 415, 545
- Trager et al. (1998) Trager S. C., Worthey G., Faber S. M., Burstein D., González J. J., 1998, ApJS, 116, 1
- Vazdekis et al. (2015) Vazdekis A., Coelho P., Cassisi S., Ricciardelli E., Falcón-Barroso J., Sánchez-Blázquez P., Barbera F. L., Beasley M. A., Pietrinferni A., 2015, MNRAS, 449, 1177
- Vazdekis et al. (2010) Vazdekis A., Sánchez-Blázquez P., Falcón-Barroso J., Cenarro A. J., Beasley M. A., Cardiel N., Gorgas J., Peletier R. F., 2010, MNRAS, 404, 1639
- Whyte et al. (2002) Whyte L. F., Abraham R. G., Merrifield M. R., Eskridge P. B., Frogel J. A., Pogge R. W., 2002, MNRAS, 336, 1281
- Williams et al. (2012) Williams M. J., Bureau M., Kuntschner H., 2012, MNRAS, 427, L99
- Williams et al. (2011) Williams M. J., Zamojski M. A., Bureau M., Kuntschner H., Merrifield M. R., de Zeeuw P. T., Kuijken K., 2011, MNRAS, 414, 2163
- Zoccali et al. (2008) Zoccali M., Hill V., Lecureur A., Barbuy B., Renzini A., Minniti D., Gómez A., Ortolani S., 2008, A&A, 486, 177
- Zoccali et al. (2003) Zoccali M., Renzini A., Ortolani S., Greggio L., Saviane I., Cassisi S., Rejkuba M., Barbuy B., Rich R. M., Bica E., 2003, A&A, 399, 931
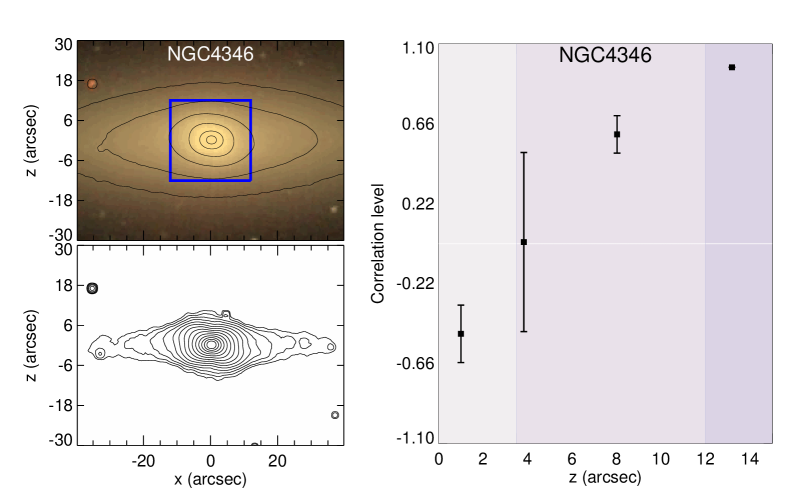
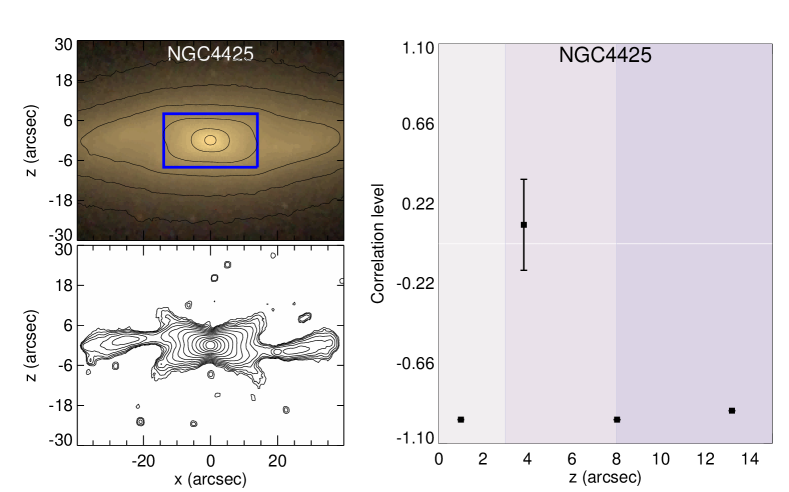
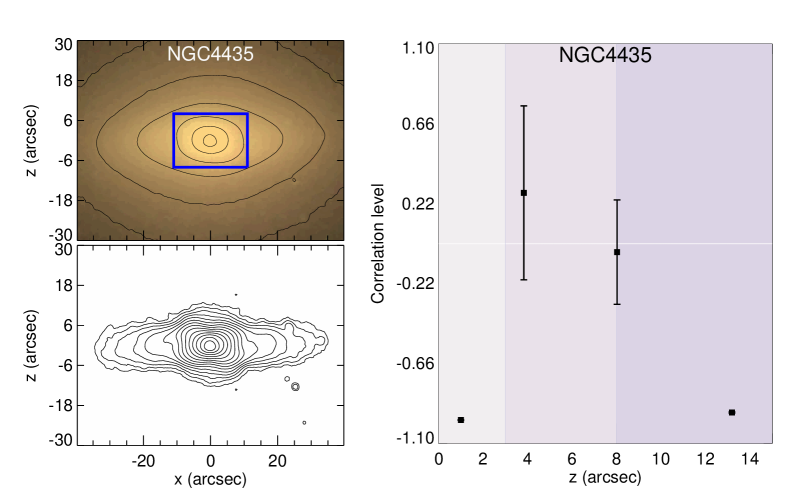
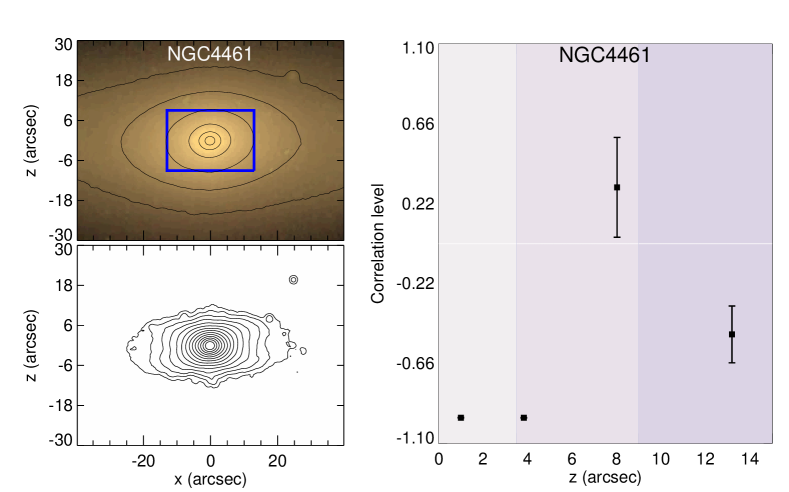
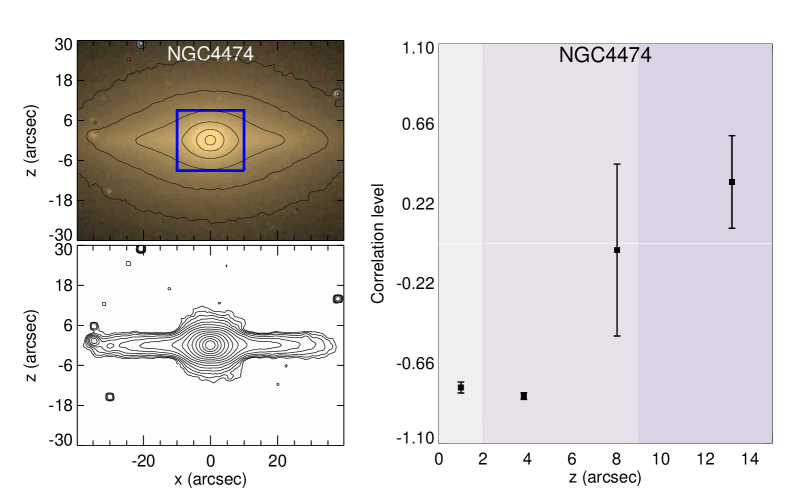
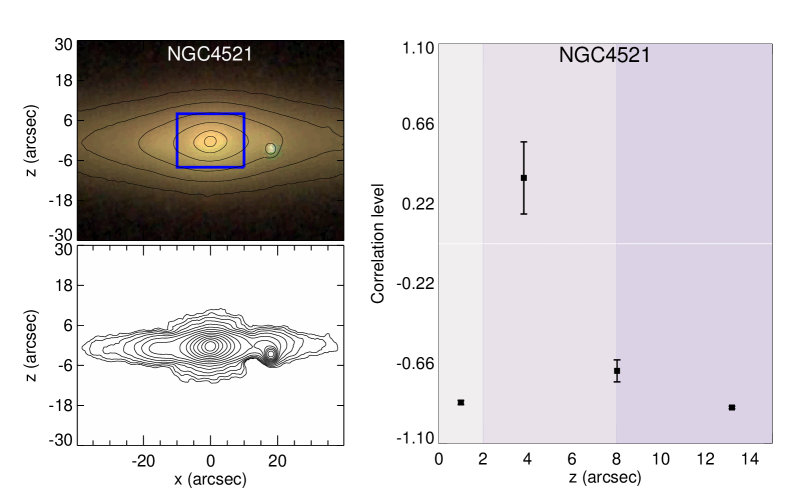
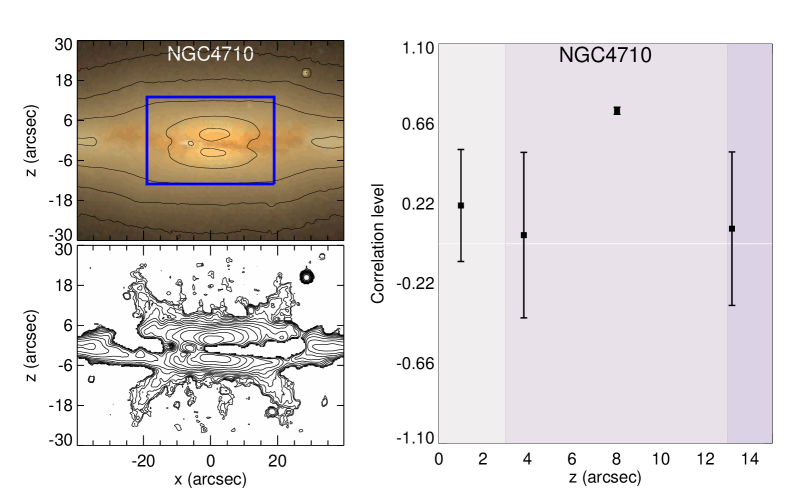
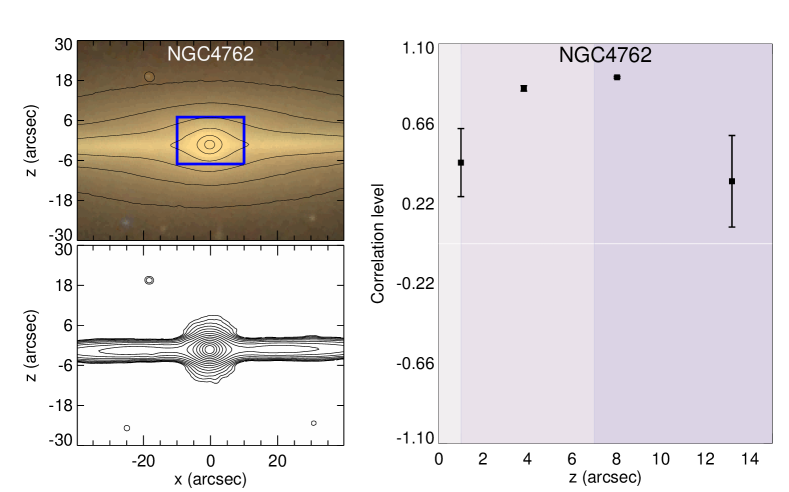
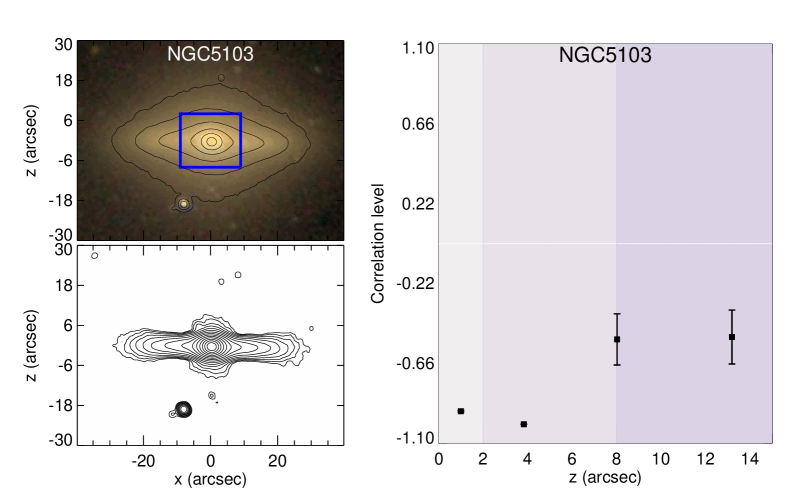
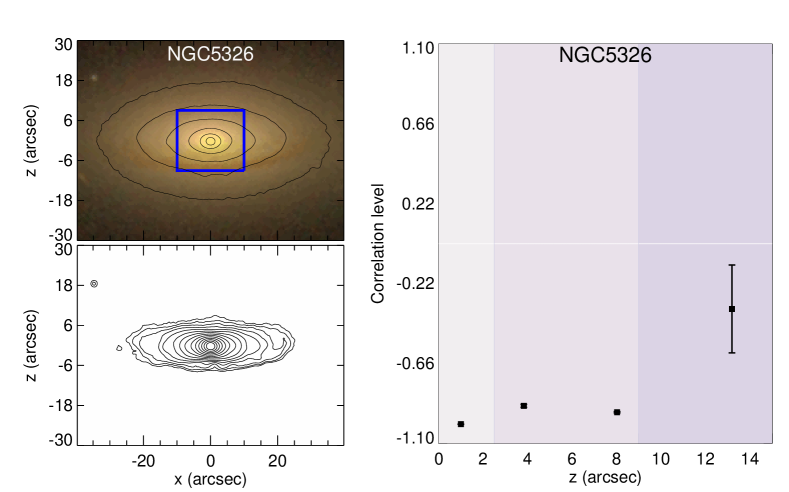
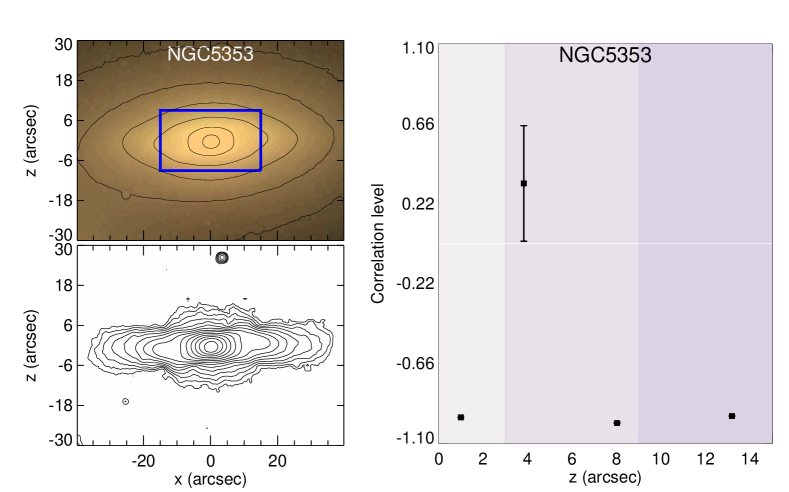
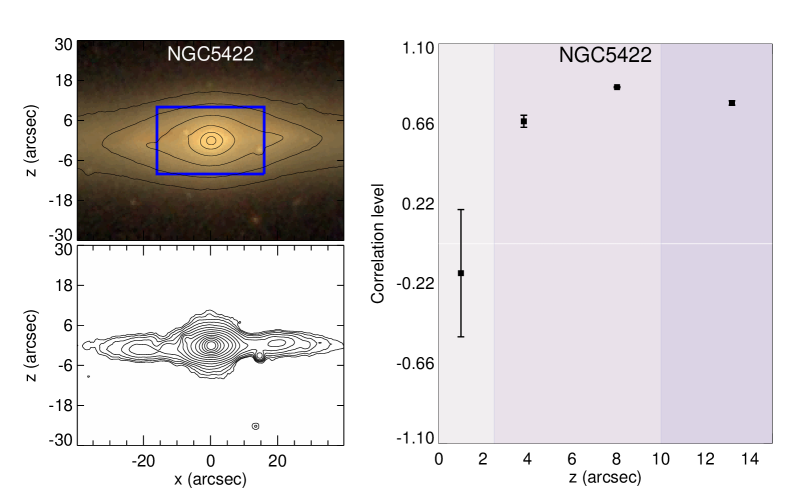
Appendix A Unsharp images for individual galaxies
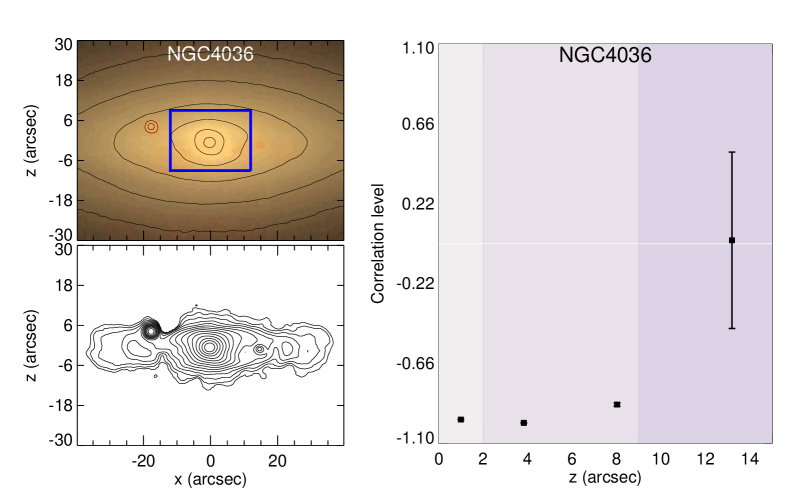
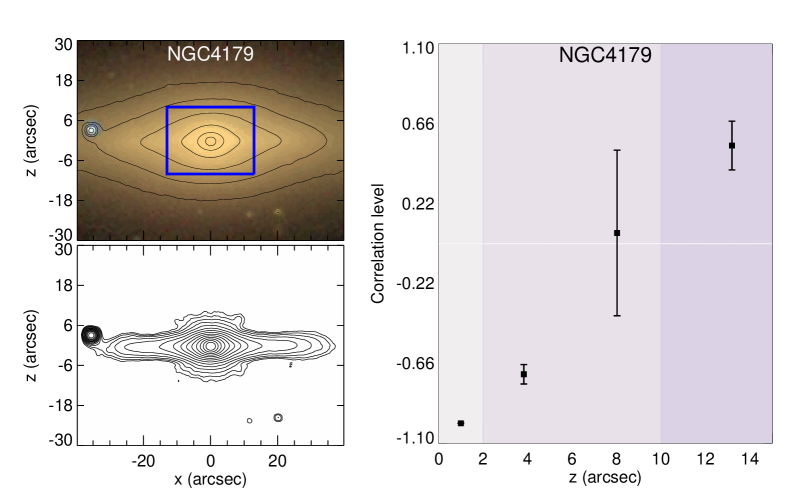
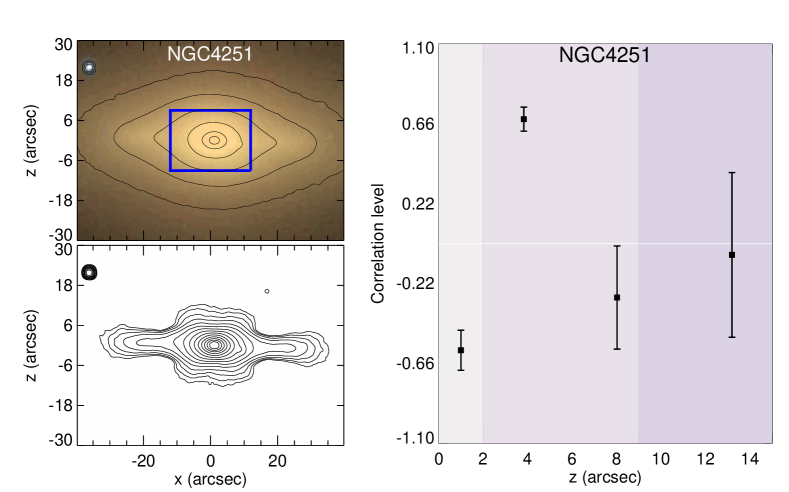
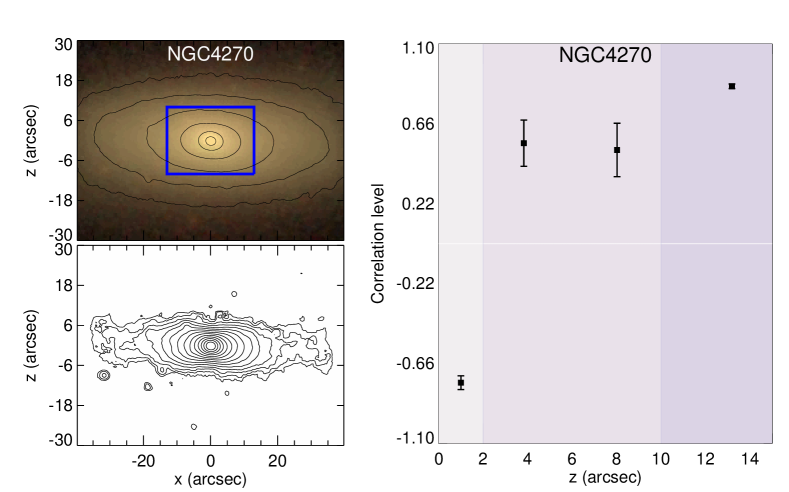
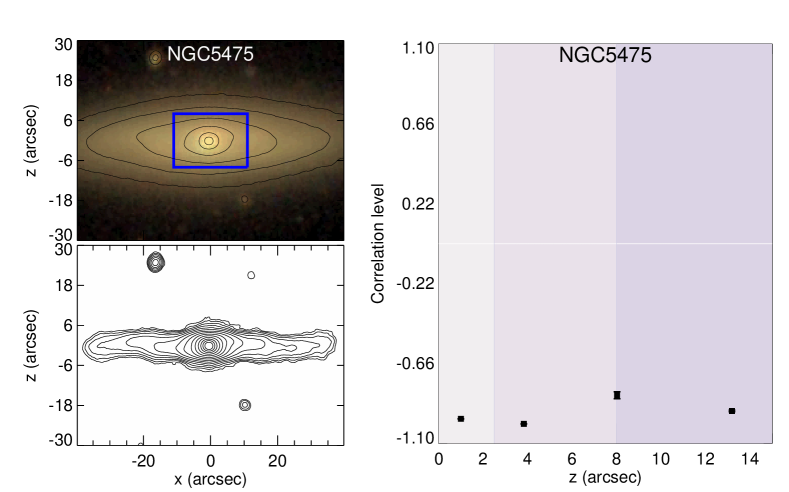
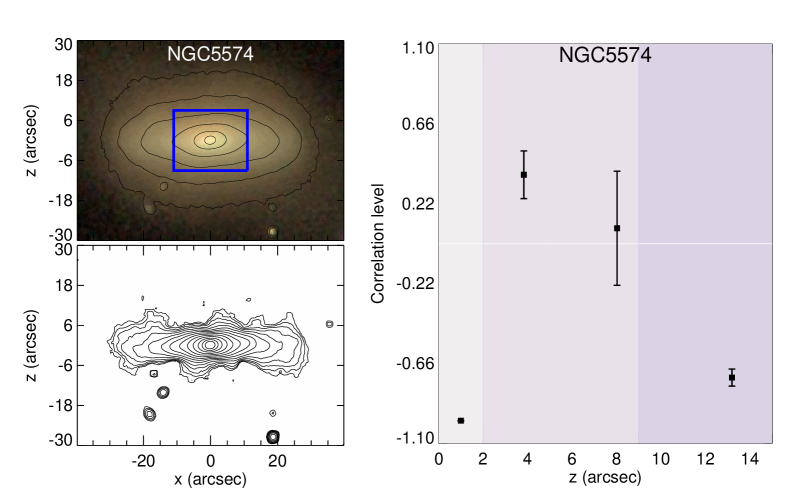
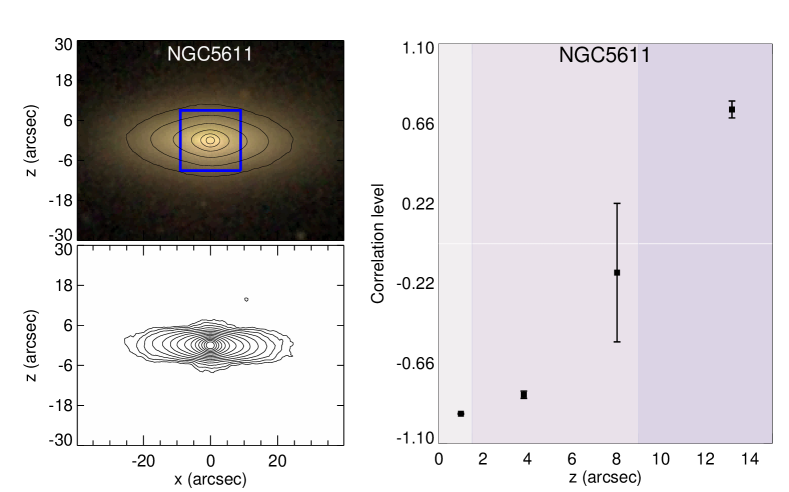
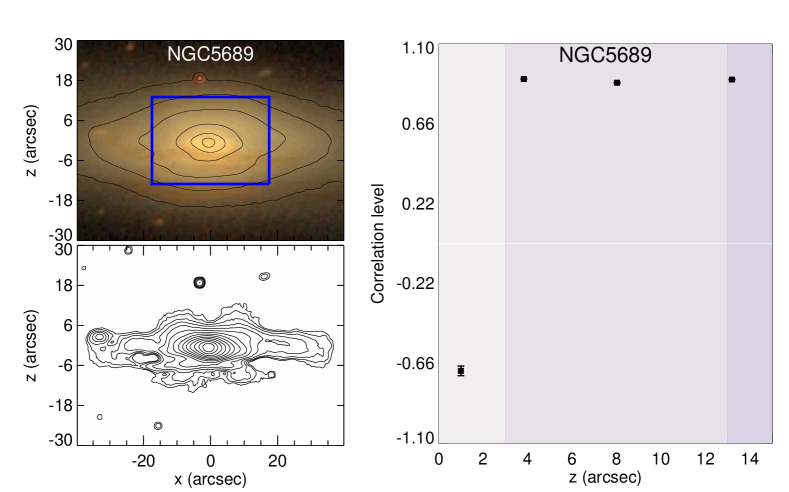
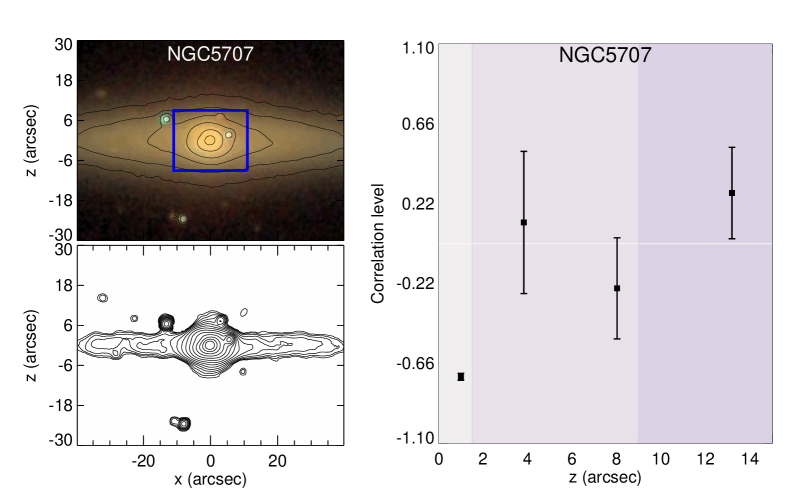
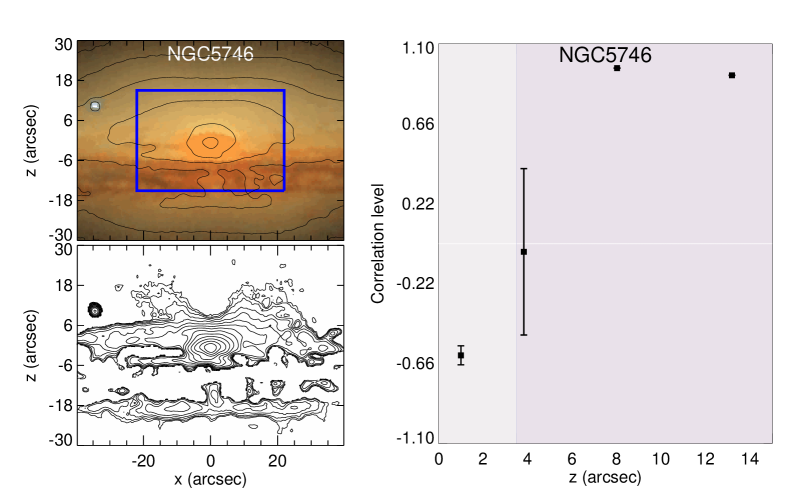
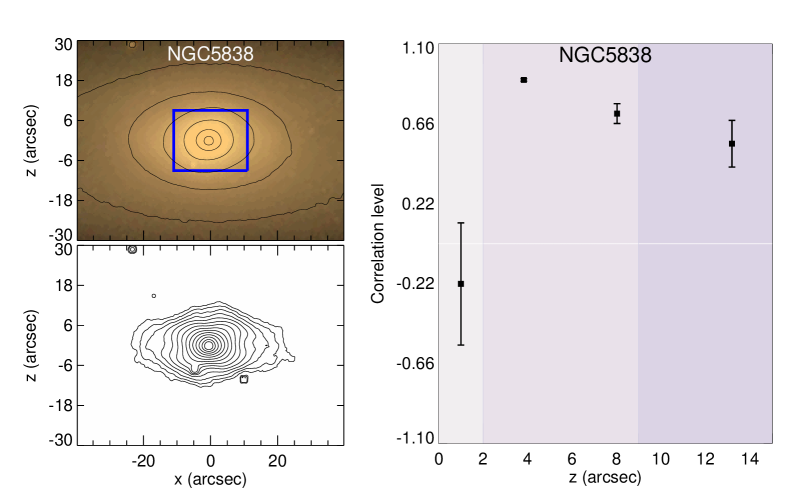
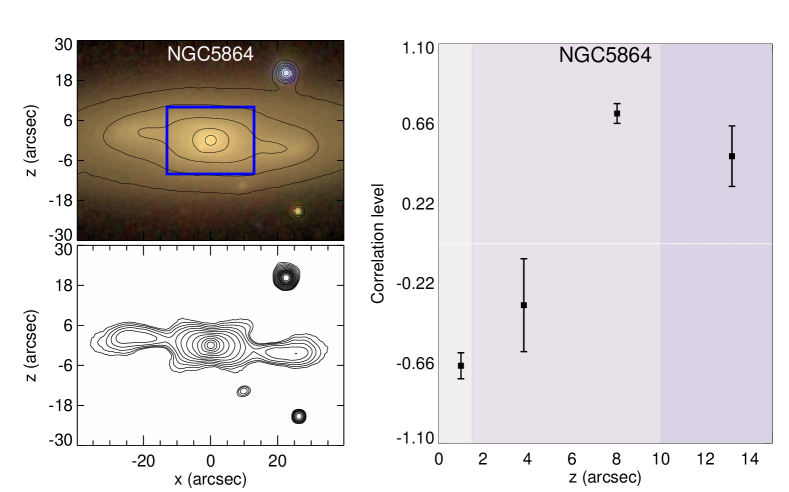
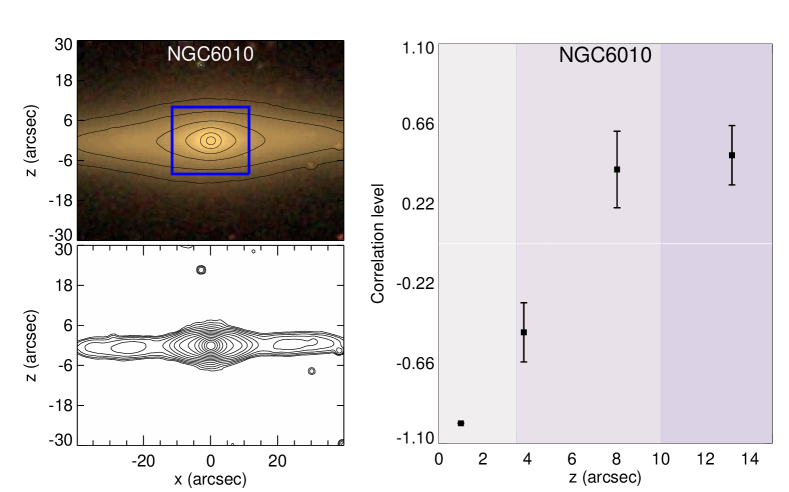
For each galaxy in our sample, we present here the SDSS colour image and an unsharp masked image in the -band, obtained from SDSS DR10 (Ahn et al., 2014). The bulge region, obtained from our Galfit analysis is shown as a blue rectangle on top of the colour image. We also present the –h3 correlation profiles for all galaxies in our sample. These profiles show the level of correlation of V and h3 within the bulge zone in pseudo-slits parallel to the major axis of the galaxies at different heights () from the disc plane. These measurements have been performed on the dust-free side of the galaxies. Negative values indicate negative correlation, while values closer to +1 mean stronger positive correlation. Different shaded regions mark the disc plane, the bulge/bar dominated parts and the regions beyond .

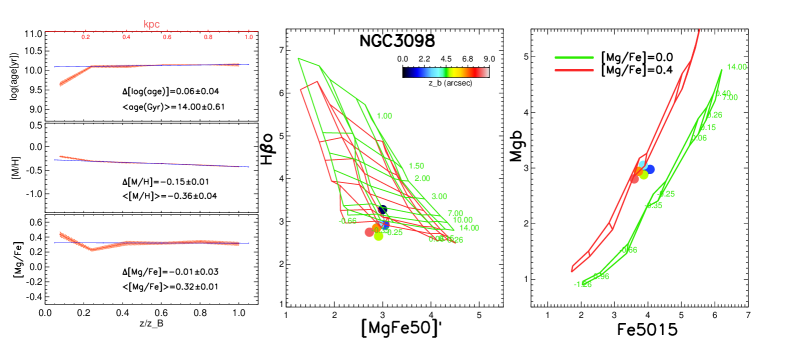
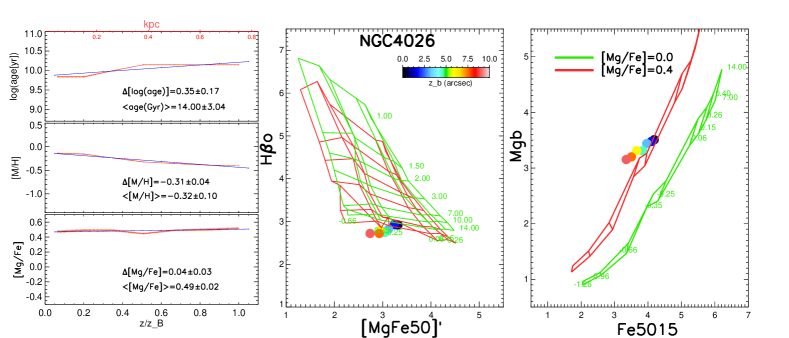
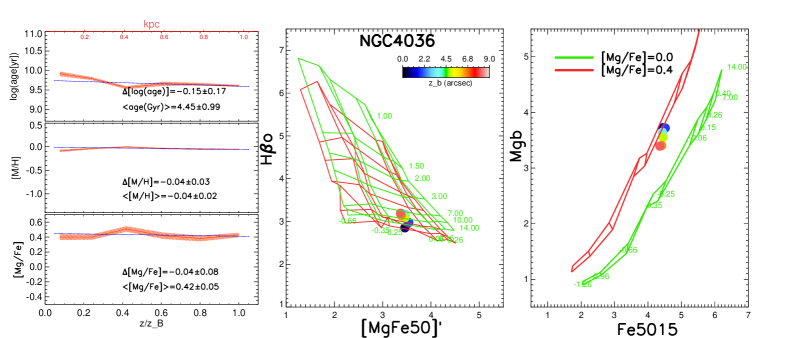
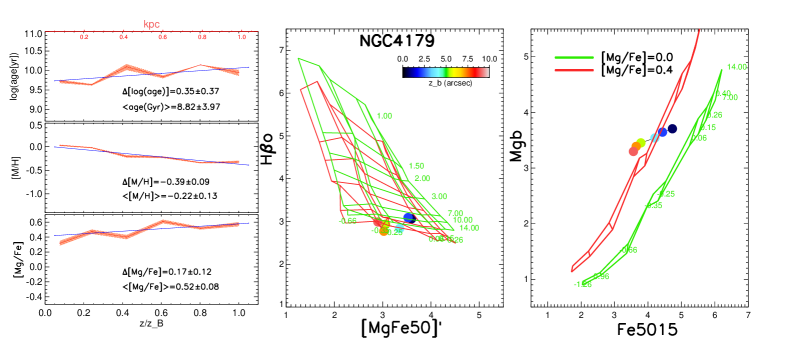
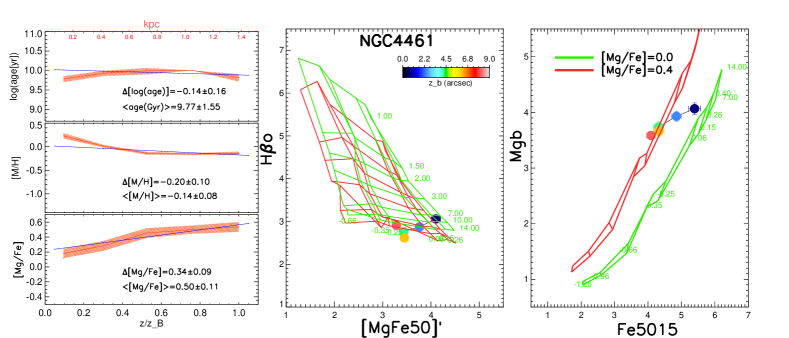
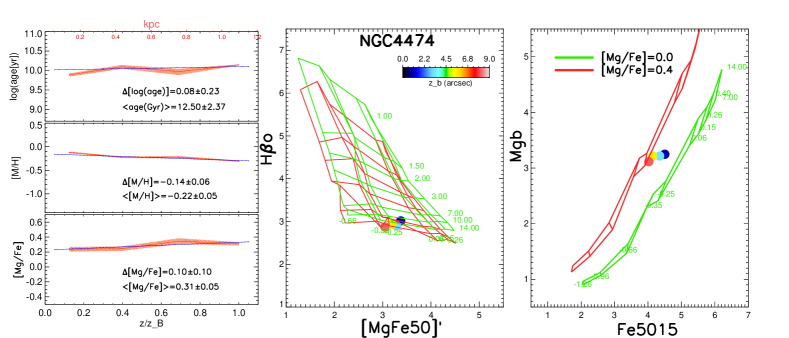
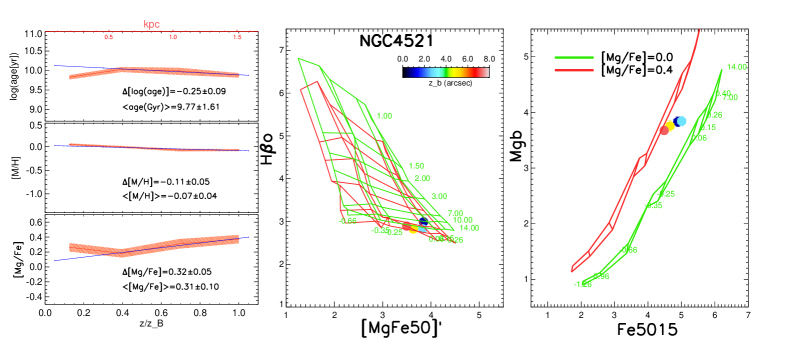
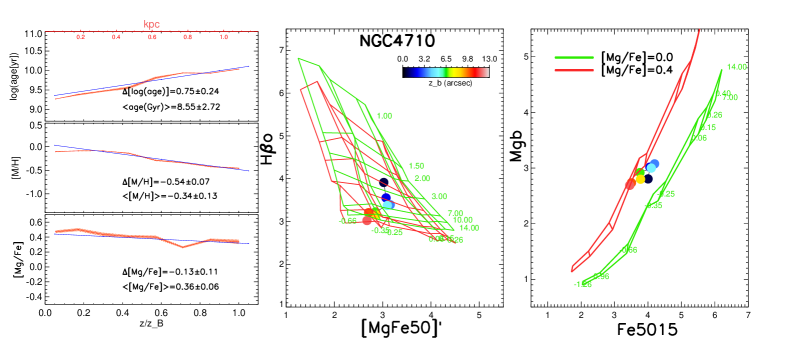
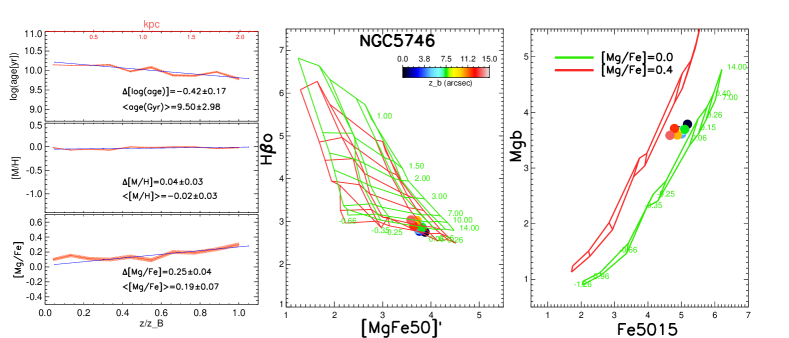
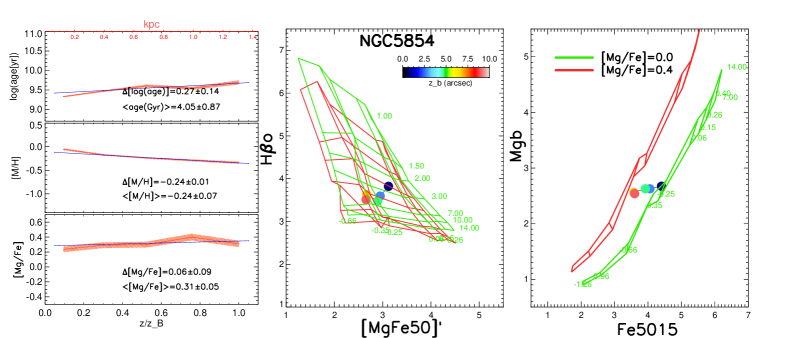
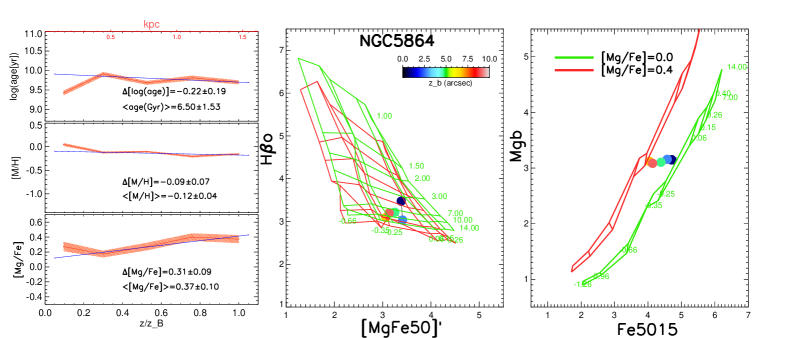
Appendix B SSP profiles for individual galaxies
Here, we present the individual SSP-equivalent stellar population profiles, along the minor axis for all bulges in our sample. The top axis is in physical units, showing the physical extent of the bulge in kpc, while the bottom axis is normalised to , in arcsec. The gradients have been calculated in dex/. We also present the index-index diagram of H versus [MgFe50]’ (and the Mg versus Fe5015) of the average Voronoi bin values at various heights from the disc plane. Overlaid are the MILES SSP models for different ages and metallicities. The green and red grids correspond to the scaled-solar and –enhanced SSP models, respectively. The points are colour-coded according to their distances from the disc plane.