The interstellar medium in high-redshift submillimeter galaxies as probed by infrared spectroscopy∗
Abstract
Submillimeter galaxies (SMGs) at are luminous in the far-infrared and have star-formation rates, SFR, of hundreds to thousands of solar masses per year. However, it is unclear whether they are true analogs of local ULIRGs or whether the mode of their star formation is more similar to that in local disk galaxies. We target these questions by using Herschel-PACS to examine the conditions in the interstellar medium (ISM) in far-infrared luminous SMGs at –4. We present 70–160 µm photometry and spectroscopy of the [O IV]26µm, [Fe II]26µm, [S III]33µm, [Si II]34µm, [O III]52µm, [N III]57µm, and [O I]63µm fine-structure lines and the S(0) and S(1) hydrogen rotational lines in 13 lensed SMGs identified by their brightness in early Herschel data. Most of the 13 targets are not individually spectroscopically detected and we instead focus on stacking these spectra with observations of an additional 32 SMGs from the Herschel archive – representing a complete compilation of PACS spectroscopy of SMGs. We detect [O I]63µm, [Si II]34µm, and [N III]57µm at in the stacked spectra, determining that the average strengths of these lines relative to the far-IR continuum are , , and , respectively. Using the [O III]52µm/[N III]57µm emission line ratio we show that SMGs have average gas-phase metallicities . By using PDR modelling and combining the new spectral measurements with integrated far-infrared fluxes and existing [C II]158µm data we show that SMGs have average gas densities, , of and FUV field strengths, (in Habing units: ), consistent with both local ULIRGs and lower luminosity star-forming galaxies.
Subject headings:
galaxies: star formation — galaxies: high-redshift — submillimeter: general — gravitational lensing: strong — galaxies: ISM1. Introduction
Submillimetre galaxies (SMGs), selected from their high flux densities at submillimetre wavelengths, are the highest luminosity dusty star-forming galaxies and have redshift distributions peaking at with a tail out to (e.g., Chapman et al., 2005; Wardlow et al., 2011; Riechers et al., 2013; Dowell et al., 2014; Simpson et al., 2014; Asboth et al., 2016). They have intrinsic far-infrared (IR) luminosities , equivalent to local ultraluminous infrared galaxies (ULIRGs), are typically dominated by star-formation rather than AGN emission (e.g., Alexander et al., 2005; Valiante et al., 2007; Pope et al., 2008; Menéndez-Delmestre et al., 2009; Laird et al., 2010; Wang et al., 2013), and SMGs with fluxes down to mJy at 850 µm contribute up to 20% of the cosmic star-formation rate density at (e.g., Wardlow et al., 2011; Swinbank et al., 2014). See Blain et al. (2002) and Casey et al. (2014) for reviews.
The extreme star-formation rates of SMGs (up to ) and their gas depletion times suggest that their star formation is episodic and that they are observed in a short-lived (timescales Myr) burst phase (e.g., Bothwell et al., 2013). Both mergers and secular processes have been invoked as the triggers of these starbursts (e.g., Elbaz et al., 2011; Alaghband-Zadeh et al., 2012; Menéndez-Delmestre et al., 2013; Hayward et al., 2013; Cowley et al., 2015; Narayanan et al., 2015) and with limited data the discourse is ongoing. A related issue is whether the star formation in SMGs proceeds like that in local ULIRGs (e.g., Daddi et al., 2010; Genzel et al., 2010), or whether the so-called ‘mode’ of star-formation proceeds more similarly to local sub-LIRGs or quiescently star-forming galaxies (e.g., Farrah et al., 2008; Pope et al., 2008; Elbaz et al., 2011; Krumholz et al., 2012), where it is typically extended over larger regions. The majority of local ULIRGs occur in interacting or merging systems (e.g., Sanders & Mirabel, 1996; Farrah et al., 2001; Veilleux et al., 2002) but hints are beginning to emerge that SMGs may have a lower merger fraction (e.g., Tacconi et al., 2008, 2010; Rodighiero et al., 2011). There is also some evidence that the star-forming regions in SMGs may be more spatially extended than in local ULIRGs, suggestive of star-formation proceeding in a sub-LIRG mode (e.g., Tacconi et al., 2006; Younger et al., 2008; Swinbank et al., 2010; Ivison et al., 2011; Riechers et al., 2011b; Ikarashi et al., 2015; Simpson et al., 2015), although recent lensing studies tend to measure smaller sizes than unlensed results. (e.g., Bussmann et al., 2013; Calanog et al., 2014).
Different star-formation triggers, modes, and AGN contributions impact the ISM of galaxies and consequently manifest in the relative strengths of fine structure emission lines. Thus, observations of fine structure lines are crucial to investigate these aspects of SMGs. However, the dust that drives their extreme far-IR luminosities also makes observations at optical and near-IR wavelengths challenging, and renders standard excitation tracers inaccesible. Indeed, mid- and far-IR spectroscopy is the only way to probe the ISM in the inner, most highly extincted regions (–10 mag). The limited wavelength coverage and sensitivity of previous mid-IR spectrographs (e.g. Spitzer/IRS, ISO/SWS, ISO/LWS) precluded observations of mid-IR fine structure lines for high-redshift galaxies prior to Herschel. Even with the enhanced sensitivity of Herschel, observations are limited to the brightest galaxies – primarily gravitationally lensed SMGs. Indeed, to date only a handful of observations of the [O IV]26µm, [S III]33µm, [Si II]34µm, [O III]52µm, [N III]57µm, or [O I]63µm IR fine-structure lines have been observed in high-redshift galaxies, the majority taken with Herschel (Ivison et al., 2010a; Sturm et al., 2010; Valtchanov et al., 2011; Coppin et al., 2012; Bothwell et al., 2013; Brisbin et al., 2015, see also Carilli & Walter 2013 for a review of gas tracers in high redshift galaxies).
In this paper we present Herschel/PACS (Pilbratt et al., 2010; Poglitsch et al., 2010) observations of the [O IV]26µm, [S III]33µm, [Si II]34µm, [O III]52µm, [N III]57µm, and [O I]63µm fine structure transitions, and the molecular hydrogen rotational lines H2 S(0) (28µm) and H2 S(1) (17µm), in 13 strongly gravitationally lensed SMGs at redshifts 1.03–3.27 targeted by our Herschel Open Time program. These emission lines were selected in order to probe a range of ISM conditions, in terms of ionization potential and critical density, and correspond to different excitation mechanisms in photo-dominated regions (PDRs), H II regions, shocks, and X-ray dominated regions (XDRs). We supplement these data with archival observations of the same IR emission lines from a further 32 SMGs (lensed and unlensed) at –4.2 from eight additional PACS observing programs. To complement the spectroscopy we also obtained Herschel-PACS 70 and 160 µm photometry of the 13 original targets, which supplements the existing far-IR photometry of these lensed SMGs and is used to improve the SED fits. Since the warm-up of Herschel such spectroscopy will not again be attainable at high redshifts until the launch of facilities such as SPICA, FIRSPEX, or the Far-Infrared Surveyor. Thus, this paper represents one of the few studies of rest-frame mid-IR spectroscopy at high-redshifts in the present era, and provides important data for the planning of the observing strategies for these future missions.
In Section 2 we describe the observations and data reduction. Section 3 contains the analysis and discussion, including SED fits, emission line measurements and ISM modelling. Finally, our conclusions are presented in Section 4. Throughout this paper we use CDM cosmology with , and .
| Target | Short Names | Magnificationa | Referencesb | OBSIDsc | ||
|---|---|---|---|---|---|---|
| H-ATLAS J142935.3002836 | G15v2.19, | 1.027 | 0.218 | a | C14, M14, N16 | 134225916[2,3], 134226146[8,9], |
| G15.DR1.14 | 1342248369 | |||||
| H-ATLAS J085358.9015537 | G09v1.40, | 2.089 | … | B13, C14, S16, Y16, | 134225565[2,3], 134225495[3–6], | |
| G09.DR1.35 | N16 | 1342254283 | ||||
| H-ATLAS J115820.2013753 | G12v2.257, | 2.191 | … | H12, N16 | 13422580[78–81], 134225725[1,2], | |
| G12.DR1.379 | 1342257277 | |||||
| H-ATLAS J133649.9291801 | NGP.NA.144 | 2.202 | … | O13, H12, B13, N16 | 134225932[4,5], 134225728[3–8] | |
| H-ATLAS J134429.4303036 | NGP.NA.56 | 2.302 | 0.672 | H12, B13, Y16, N16 | 134225932[8,9], 134225961[2–5], | |
| 134225779[7,8], 1342257289 | ||||||
| 1HerMES S250 J022016.5060143 | HXMM01 | 2.307 | 0.654 | B13, F13, W13, | 134226195[7,8], 1342262548, | |
| C14, B15 | 13422626[59,60], 1342262769, | |||||
| 1342263495 | ||||||
| H-ATLAS J084933.4021443 | G09v1.124, | 2.410 | 0.348 | H12, B13, C14, I14, | 134225473[5–8], 13422549[57–60] | |
| G09.DR1.131 | Y16, N16 | 1342254283 | ||||
| H-ATLAS J141351.9000026 | G15v2.235, | 2.479 | 0.547 | H12, B14, C14, N16 | 13422591[58–61], 134226147[1,2], | |
| G15.DR1.265 | 1342262532, 1342262041 | |||||
| H-ATLAS J091840.8023047 | G09v1.326, | 2.581 | … | H12, B13, C14, N16 | 134225564[6–9], 1342254933, | |
| G09.DR1.437 | 1342255740 | |||||
| H-ATLAS J133008.4245900 | NGP.NB.78 | 3.111 | 0.428 | O13, B13, C14, Y16, | 134225932[0–3], 134225728[0–2] | |
| N16, Rp | ||||||
| H-ATLAS J113526.3014605 | G12v2.43, | 3.128 | … | GY05, B13, C14, | 13422571[09–12], 134225724[5–7], | |
| G12.DR1.80 | Y16, N16 | 1342256482 | ||||
| H-ATLAS J114637.9001132 | G12v2.30, | 3.259 | 1.225 | O13, F12, H12, | 134225710[1–4], 13422572[48–50], | |
| G12.DR1.33 | B13, C14, N16 | 1342256949, 1342257276 | ||||
| 1HerMES S250 J143330.8345439 | HBoötes01 | 3.274 | 0.590 | B13, W13, C14, Rp | 134225952[1–4], 13422620[39,40], | |
| 1342257689 |
Note. — a The magnifications used are, with the exception of G15v2.19, for the far-IR continuum and measured from high resolution submillimetre data (mostly observed-frame 850 µm with the SMA or ALMA). Section 3.7.1 includes further discussion of the effects of differential magnification. For G15v2.19 we use the magnification of the CO(4-3) line, which is the data closest in wavelength to our observations with lens modelling. b B13: Bussmann et al. (2013), B15: Bussmann et al. (2015), C14: Calanog et al. (2014), F12: Fu et al. (2012), GY05: Gladders & Yee (2005), H12: Harris et al. (2012), I13: Ivison et al. (2013), O13: Omont et al. (2013), M14: Messias et al. (2014), N16: Negrello et al. (2016), Rp: Riechers et al. (in prep.), S16: Serjeant (2016), W13: Wardlow et al. (2013), Y16: Yang et al. (2016). c OBSID are the Herschel observation identification number(s) for the program OT2_jwardlow_1, used to identify the photometric and spectroscopic observation of each target in the Herschel archive.
2. Observations and data reduction
In this paper we first analyse PACS observations of sources targeted by our Herschel program OT2_jwardlow_1, which are described in Section 2.1. We later combine these with archival spectroscopy for additional SMGs, which are described in Section 2.4.
2.1. Targeted sample selection
The parent sample of the 13 galaxies targeted by OT2_jwardlow_1 for PACS photometry and spectroscopy are candidate strongly gravitationally lensed galaxies identified in the Herschel H-ATLAS (Eales et al., 2010) and HerMES (Oliver et al., 2012) surveys due to their brightness at 500 µm ( mJy; Negrello et al., 2010, 2016; Wardlow et al., 2013; Nayyeri et al., 2016, e.g.). Extensive follow-up programs, including CO spectroscopy (e.g., Frayer et al., 2011; Harris et al., 2012, Riechers et al. in prep.), high-resolution (sub)millimeter and radio interferometry (e.g., Bussmann et al., 2013), high-resolution near-IR imaging (e.g., Wardlow et al., 2013; Negrello et al., 2014a; Calanog et al., 2014), deep optical, near- and mid-IR photometry (e.g., Fu et al., 2013), and spectroscopy (e.g., Wardlow et al., 2013), are supplementing the ancillary data coverage of many of these systems.
The subset of gravitationally lensed Herschel-selected galaxies that are targeted here are presented in Table 1. The targeted galaxies were selected to have confirmed (multiple-line) CO spectroscopic redshifts as well as mJy and 70 µm fluxes predicted to be mJy based on fitting Arp 220 and M 82 SEDs (Silva et al., 1998) to the available long wavelength data. The latter two requirements were motivated by the sensitivity of PACS and the former is necessary to tune the spectroscopic observations (although note that many of the redshifts are from broadband instruments used for line searches, which can have up to spectral resolution). PACS spectroscopy of six additional Herschel H-ATLAS and HerMES gravitationally lensed galaxies, and other high-redshift galaxies were observed in a separate program and will be presented in Verma et al. (in prep.), though they are included here in our stacking analyses (see Section 2.4).
2.2. Herschel-PACS spectroscopy
The emission lines that were targeted vary from galaxy to galaxy, due to the redshift range of the sources and the PACS spectral coverage and sensitivity. In this section we discuss the observations of the targeted sample of Herschel lensed SMGs (the data processing is the same for the archival data; Section 2.4). All of the targeted galaxies (Section 2.1) had between three and eight lines observed, with a median of five, from the [O IV]26, [S III]33, [Si II]34, [O III]52, [N III]57, and [O I]63 fine-structure transitions, and the molecular hydrogen rotational lines H2 S(0) and H2 S(1). The [Fe II]26 transition is serendipitously included in the wavelength coverage of the [O IV]26 observations. The breakdown of the lines that were observed for each galaxy is shown in Table 3.2.
The data were taken in “range scan” mode with small chop/nod throws for background subtraction. With the exceptions of G12v2.30 and G12v2.43, the [O IV]26 lines were observed in the second order of the [O III]52 observations. For G12v2.30 and G12v2.43 the [O III]52 line is redshifted beyond the PACS wavelength range and in those cases [O IV]26 was observed separately.
The data were reduced using the Herschel Interactive Processing Environment (Ott 2010; hipe) v12.1.0 with version 65.0 of the PACS calibration tree.111We have verified that later versions of hipe do not affect the results by comparing a selection of data reduced with our hipe v12.1.0 script, with v14.0.1 pipeline processed versions of the same observations, and find no significant differences in the reduced spectra. Data processing is based on the hipe v12.1.0 ipipe Background Normalization data reduction script for “chop/nod range scan” data. This procedure is optimized for faint sources and uses the off-source positions to perform the background subtraction and calibrate the detector response. During flat fielding we set “upsample factor” to 1 (and use the default “oversample” of 2) to avoid introducing correlated noise, and mask the wavelength regions where spectral lines are expected. The final spectra are binned to be Nyquist sampled at the native PACS resolution and are shown in Appendix B. For the targets that are marginally resolved in the PACS photometry222Due to the enhanced spatial scales from gravitational magnification, approximately half of the targets are marginally resolved by PACS. (Section 2.3) we applied the hipe extended source correction (assuming sizes measured at 70 µm); otherwise we applied the standard point source correction during the extraction of the 1D spectra.
PACS always takes second order spectroscopy, which, with the exception of the [O IV]26 and [O III]52 observations described above, are not expected to include any additional transition lines. This is because no bright transitions of the background SMGs lie in the second-order wavelength ranges, and the foreground lensing galaxies are IR faint. Nevertheless the second-order data were reduced and extracted following the same procedure. As anticipated, no additional transitions were found. The continuum measurements (or limits) from these spectra are not deep enough to provide additional robust constraints on the SEDs and therefore the second-order data (with the exception of the paired [O III]52 and [O IV]26 observations) are excluded from further examination.
2.3. Herschel-PACS photometry
To supplement the spectroscopy we also obtained simultaneous 70 and 160 µm mini-scan maps of each of the target lensed SMGs. Observations were taken at the nominal scan speed of 20″/s, with 3′ scan legs, separated by 4″ cross-scan steps. For photometric fidelity at least two orthogonal scans of each source were made and for the fainter targets additional scan pairs were obtained to increase the observation depths.
The data were processed from level 0 using hipe v12.1.0 with version 65.0 of the PACS calibration tree. We employed standard Herschel data reduction procedures, utilizing the standard ipipe script for scan maps containing point or marginally extended sources. The cross scans were combined during reduction and we iteratively filtered using a signal-to-noise (SNR) threshold to mask the sources during filtering. The final maps are each in size with coverage of the maximum in the central area.
PACS photometry is measured in 18 apertures with radii from 2 to 50″ using the “annularSkyAperturePhotometry” task within hipe, with each measurement corrected for the encircled energy fractions using PACS responsivity version 7. The uncertainties in the flux density measurements are determined from the dispersion in 1000 samples of the total flux in the same number of randomly selected pixels as included in each aperture, with pixels containing sources or those with of maximum coverage excluded from selection. We then determine the “total” flux density and uncertainty for each target by fitting a curve of growth to the aperture fluxes and adding 5% calibration uncertainty.333http://herschel.esac.esa.int/twiki/bin/view/Public/PacsCalibrationWeb These total flux densities are presented in Table 2, where we also include PACS 100 µm data from George et al. (in prep.; Herschel program OT1_rivison_1; see also George 2015) and the publications presented in Table 1. George (2015) also includes 160 µm data from OT1_rivison_1, although their flux measurements can be 1–2 lower than those presented here, since point sources are assumed. For HXMM01, the PACS 70 and 160 µm photometry was independently reduced and measured in Fu et al. (2013). Our measurements are consistent with those results, and we include the Fu et al. (2013) 100-µm photometry in the SED fits (Section 3.1) and Table 2. HBoötes01 has PACS 100-µm data from HerMES GTO time, which are also included here.
| Name | a | b | FIRb | |
|---|---|---|---|---|
| (mJy) | (mJy) | () | () | |
| G15v2.19 | ||||
| G09v1.40 | ||||
| G12v2.257 | ||||
| GP.NA.144 | ||||
| NGP.NA.56 | ||||
| HXMM01 | ||||
| G09v1.124 | ||||
| G15v2.235 | ||||
| G09v1.326 | ||||
| NGP.NB.78 | ||||
| G12v2.43 | ||||
| G12v2.30 | ||||
| HBoötes01 |
Note. — All measurements are apparent values (i.e. no corrections have been made for the lensing amplification). a upper limits are presented for undetected sources. b and FIR, measured from the modified blackbody fits in Figure 1 are the far-IR luminosity (40–500 µm) and continuum flux (42.5–122.5 µm), respectively (Section 3.1).
2.4. Archival sample and data
To identify additional SMGs with IR spectroscopy we searched the successful Herschel proposals444www.cosmos.esa.int/web/herschel/observing-overview for those targeting high-redshift star-forming galaxies (i.e. excluding AGN and QSOs) for PACS spectroscopy. Having identified likely programs we next searched the Herschel Science Archive for those with SMGs as targets and retained the observations of IR emission lines that overlap with those studied by our own program (Section 2.2). This search resulted in spectroscopy for an additional 32 SMGs, at CO or optical spectroscopic redshifts of 1.1 to 4.2. Most of these additional SMGs are gravitationally lensed because the PACS sensitivity means that only the apparently brightest sources can be observed. These archival observations covered between one and seven emission lines per galaxy. The full list of archival targets and data included in our analyses are presented in Table 5. The archival sources are broadly consistent with the main SMG population and the individually targeted galaxies, in terms of the IR-luminosity and redshift distributions, and with IR emission being dominated by star-formation. This archival sample includes LESS SMGs (Coppin et al., 2012), lensed HerMES and H-ATLAS sources from a similar followup program to this (OT1_averma_1; Verma et al. in prep.), lensed SPT sources (Vieira et al., 2013), and other SMGs.
The PACS spectroscopy of the archival targets is reduced in the same way as the targeted data (Section 2.2). For those spectra that have been published elsewhere we have verified that our reduction produces measurements consistent with the published data. PACS photometry is not available for most of the archival targets, so those are not considered here; we instead use the published IR luminosity of each source, where necessary scaling to the wavelength ranges for and FIR (Section 3.1) by using the SED fits of the targeted sources (Section 3.1). For sources with multiple published IR luminosities we use the one constrained by the most photometric data points.
3. Analysis and Discussion
3.1. Far-infrared SED fits
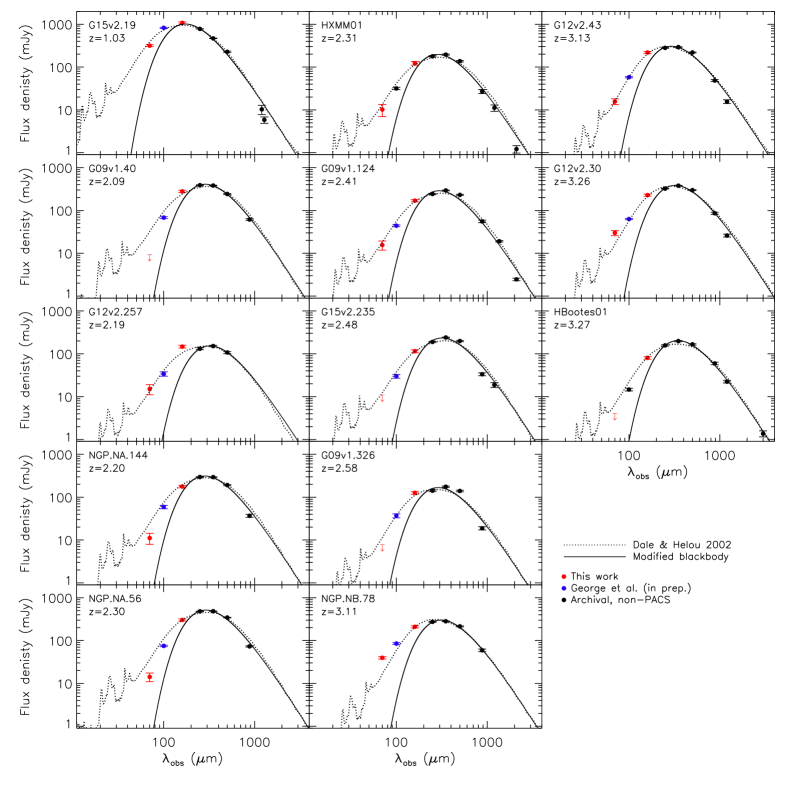
The PACS photometry, decsribed in Section 2.3, is supplemented with the SPIRE (Griffin et al., 2010) 250-, 350-, and 500-µm data from HerMES (Roseboom et al., 2012; Wang et al., 2014) and H-ATLAS (Valiante et al., 2016), and, where available, longer wavelength follow-up photometry (see references in Table 1). We show the far-IR SEDs derived from this compilation of data in Figure 1.
For each galaxy we fit the observed far-infared SED with an optically thin modified blackbody spectrum of the form
| (1) |
where is the flux density, is frequency and is the power law emissivitity index. is the Planck function, defined as
| (2) |
for a dust temperature, , and where and denote the Planck and Boltzmann constants, respectively. We fix , which is consistent with observed values in a range of galaxies (e.g., Hildebrand, 1983; Dunne & Eales, 2001), and allow and the normalization to vary. The best-fit modified blackbody curve for each galaxy is shown in Figure 1.
Using these modified blackbody fits we next calculate both far-IR luminosity () and far-IR continuum flux (FIR) for each SMG. For consistency with existing studies we follow the definitions of Graciá-Carpio et al. (2011) and Coppin et al. (2012) for these quantities, whereby:
-
•
is the luminosity of the rest-frame SED integrated between 40 and 500 µm, and;
-
•
FIR is the luminosity integrated between 42.5 and 122.5 µm in the rest-frame, and converted to flux by dividing by , where is the luminosity distance.
The apparent (i.e., without correction for lensing amplification) values of and FIR calculated from the modified blackbody SED fits are listed in Table 3.1 and are used in the analysis in the rest of this paper.
However, since the single temperature modified blackbody can underpredict the emission on the Wien side of the far-IR dust peak, it is possible that the and FIR values that we calculate from the modified blackbody fits are systematically underestimated. To test the magnitude of this effect we also fit each galaxy with SEDs from the Dale & Helou (2002) template library; these fits are also shown in Figure 1.
There is no significant systematic offset between from the two fitting methods, with the median ratio of the Dale & Helou (2002) to modified blackbody values being 0.99. There are only three galaxies with from the Dale & Helou (2002) SED fits that are significantly different to the values from the modified blackbody fits. These are G15v2.19, G12v2.43 and HBoötes01, which are 15% higher and 10% and 10% lower for the Dale & Helou (2002) fits, respectively. Only one galaxy has significantly higher FIR from the Dale & Helou (2002) SEDs than the modified blackbody fits, which is G12v2.257 with 30% difference in FIR. However, five systems – G15v2.19, G09v1.40, NGP.NA.144, HXMM01 and NGP.NB.78 – have lower FIR for the Dale & Helou (2002) SEDs than the modified blackbody fits. For these six galaxies the FIR for the Dale & Helou (2002) fits are 70–95% of the modified blackbody values. These galaxies would thus be offset upwards by in Figures 3 and 4 if we were to use FIR from the Dale & Helou (2002) SED fits instead of from the modified blackbody fits. The typically small differences between and FIR from the Dale & Helou (2002) and modified blackbody fits are because and FIR are most sensitive to the peak and long wavelength part of the SED, where the modified blackbody does a good job of fitting the data. Note that due to the narrow wavelength ranges considered for FIR and and the slightly lower normalization of some of the Dale & Helou (2002) fits, having lower for the Dale & Helou (2002) fits compared with the modified blackbody in some cases is not unexpected.
3.2. Individual emission line measurements
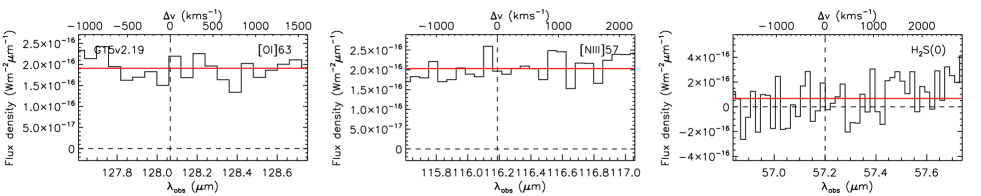
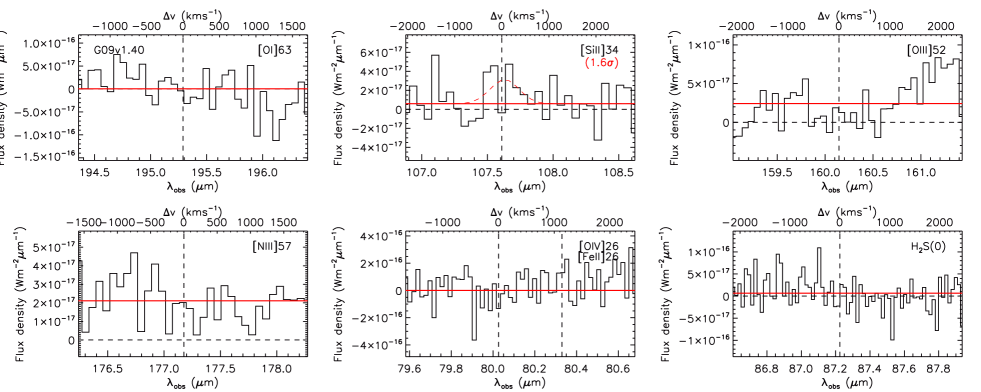
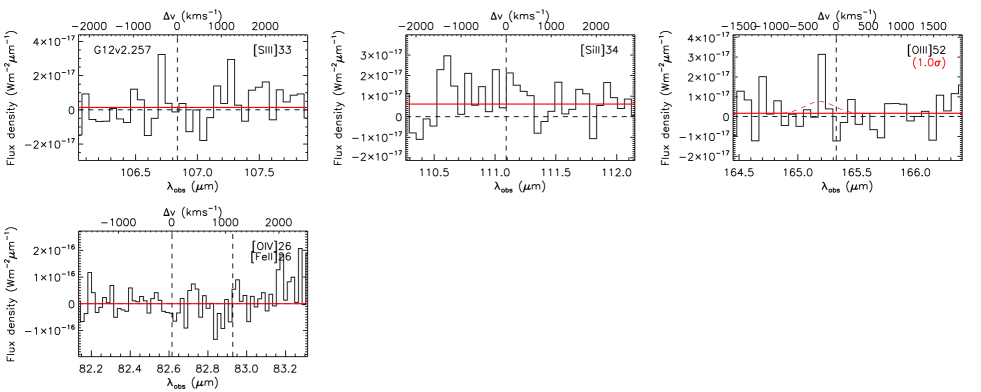
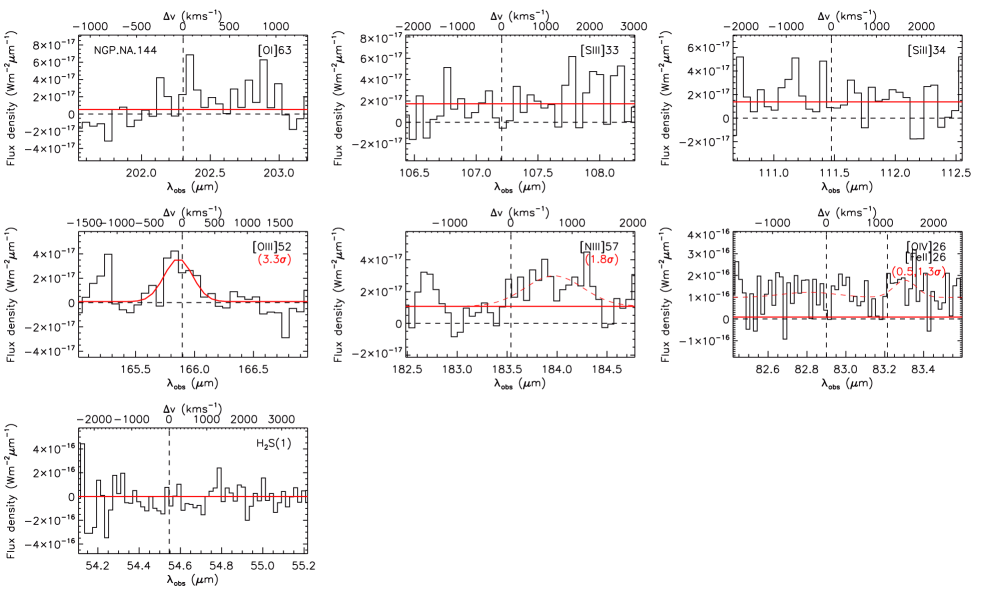
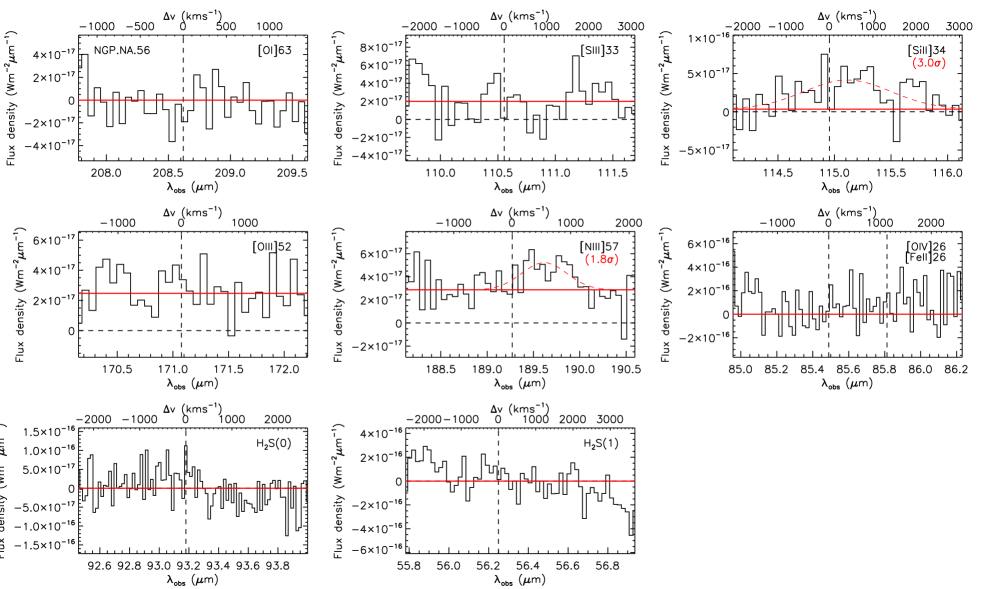
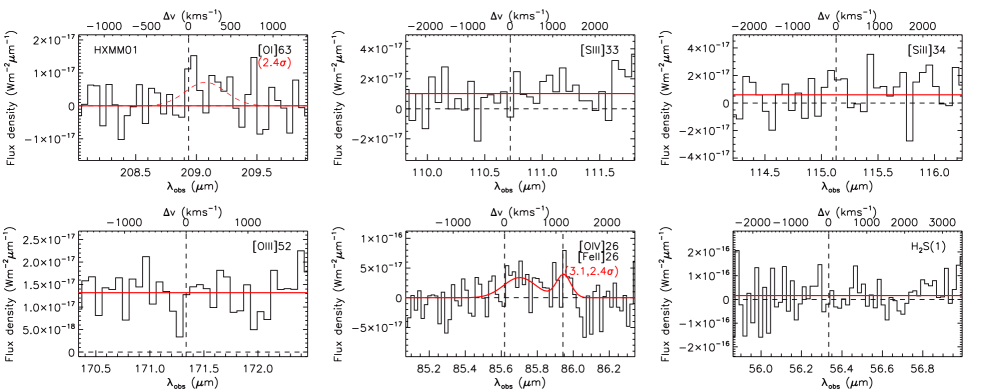
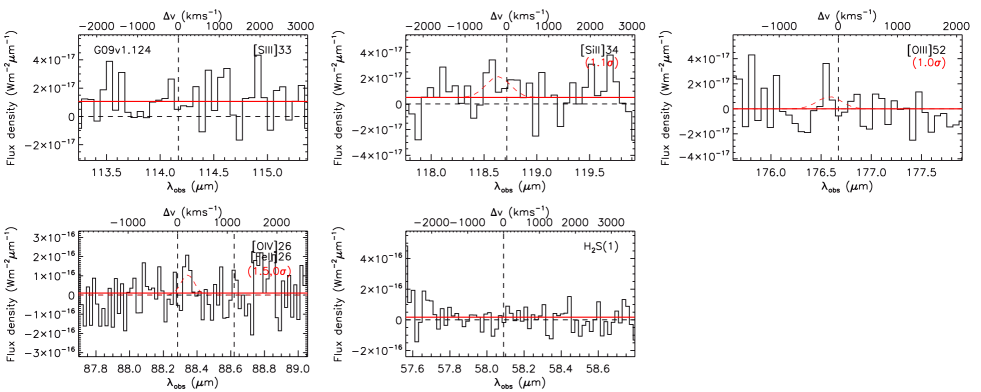
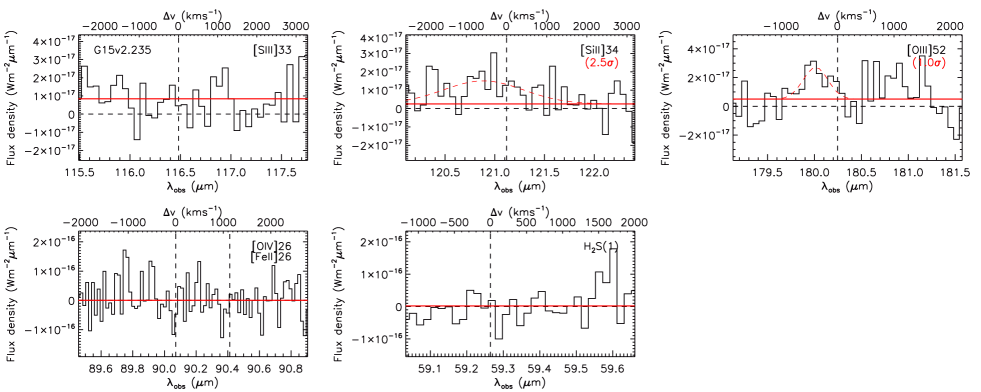
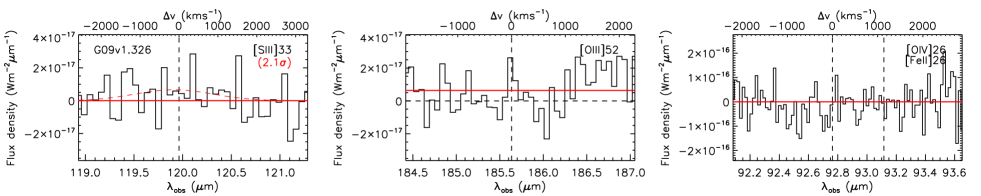
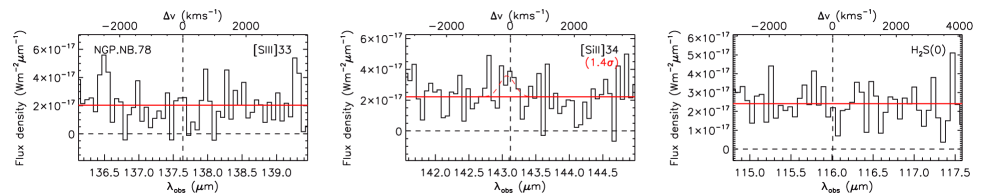
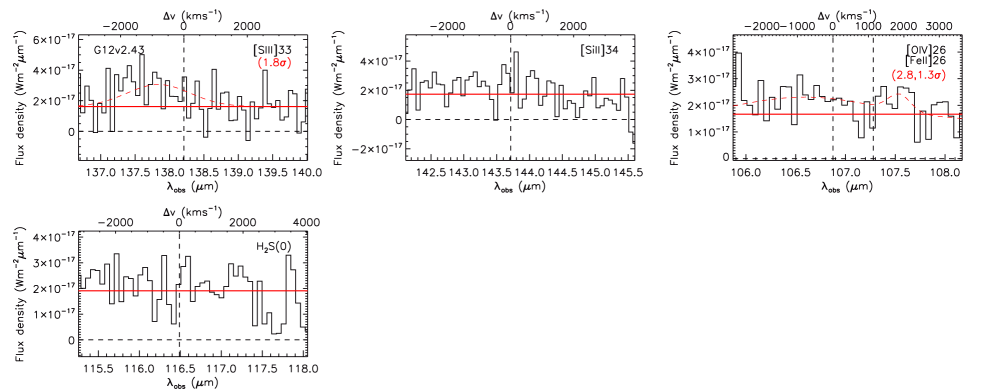
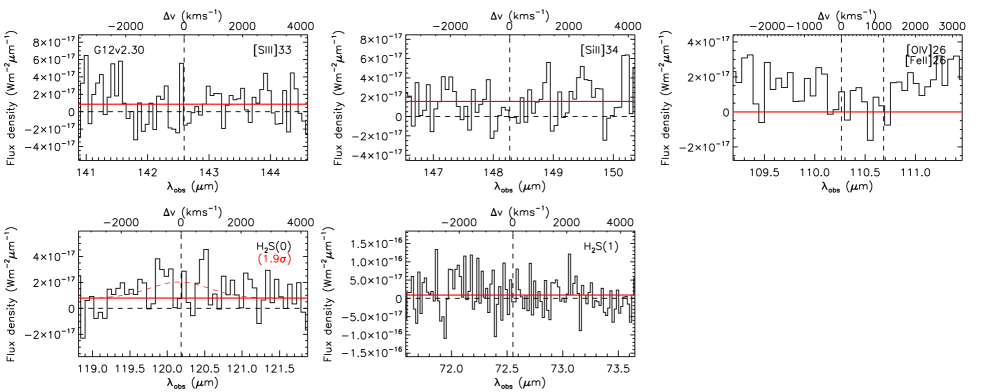
We measure the line fluxes (and upper limits) from the 1D spectra of the individual galaxies, reduced and extracted as described in Section 2.2, and with the noisy regions at the edges of the spectra (typically 5–10 wavelength bins) removed. Then, with the exception of the [O IV]26 observations, each spectrum is fit with a single Gaussian line profile and flat continuum component using the mpfit function in IDL (Markwardt, 2009), which uses non-linear Levenberg-Marquardt least-squares minimization. We constrain the fits to have non-negative continua and the velocity offsets of the lines are required to be from their expected locations based on the CO redshifts. The wavelength range of the [O IV]26 observations includes the [Fe II]26 line, and therefore, those data are fitted with double Gaussians, using the same mpfit IDL function. In all cases the velocity-integrated flux in each line is calculated from the continuum-subtracted best-fit Gaussian.
The pipeline-derived uncertainties on the PACS spectra are known to be unreliable555PACS Data Reduction Guide for Spectroscopy, §7.7: http://herschel.esac.esa.int/twiki/pub/Public/PacsCalibrationWeb/PDRGspec_HIPE14p2.pdf, and therefore we weigh each wavelength bin equally for fitting purposes. The uncertainty on the line fluxes are determined from 1000 trials for each line, wherein we add random noise with the same rms as measured from the line-free portions of the spectra and refit the line. The detection limit for each line is calculated from a Gaussian profile with a peak height three times the rms noise in the spectra, centered at the expected position of the emission line from the CO redshift. For the purposes of this calculation we assume a linewidth of 300 km s-1 FWHM, which is consistent with observations of high-redshift star-forming galaxies (e.g., Sturm et al., 2010; Coppin et al., 2012) and similar to the PACS instrumental resolution.
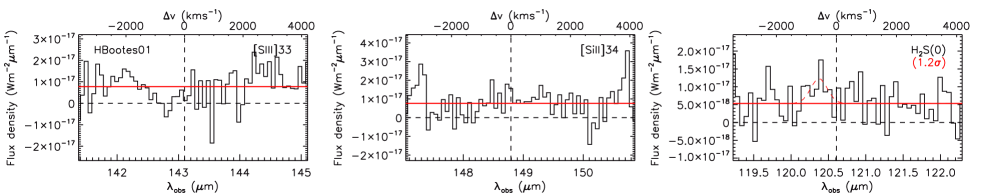
The spectra and line fits for the 13 targets of OT2_jwardlow_1 are presented in Appendix B and the measurements given in Table 3.2.
| [O I]63µm | [S III]33µm | [Si II]34µm | |||||||
| Name | Line flux | Line a | Continuumb | Line flux | Line a | Continuumb | Line flux | Line a | Continuumb |
| (10-18Wm-2) | (µm) | (mJy) | (10-18Wm-2) | (µm) | (mJy) | (10-18Wm-2) | (µm) | (mJy) | |
| G15v2.19 | 128.07 | ||||||||
| G09v1.40 | 195.29 | 107.61 | |||||||
| G12v2.257 | 106.84 | 111.09 | |||||||
| NGP.NA.144 | 202.30 | 107.21 | 111.47 | ||||||
| NGP.NA.56 | 208.62 | 110.55 | 114.96 | ||||||
| HXMM01 | 208.94 | 110.72 | 115.13 | ||||||
| G09v1.124 | 114.17 | 118.72 | |||||||
| G15v2.235 | 116.48 | 121.12 | |||||||
| G09v1.326 | 119.96 | ||||||||
| NGP.NB.78 | 137.64 | 143.12 | |||||||
| G12v2.43 | 138.21 | 143.71 | |||||||
| G12v2.30 | 142.60 | 148.27 | |||||||
| HBootes01 | 143.10 | 148.80 | |||||||
| Mean Stackc | … | … | … | ||||||
| [O III]52µm | [N III]57µm | ||||||||
| Name | Line flux | Line a | Continuumb | Line flux | Line a | Continuumb | |||
| (10-18Wm-2) | (µm) | (mJy) | (10-18Wm-2) | (µm) | (mJy) | ||||
| G15v2.19 | 116.19 | ||||||||
| G09v1.40 | 160.14 | 177.18 | |||||||
| G12v2.257 | 165.33 | ||||||||
| NGP.NA.144 | 165.86 | 183.54 | |||||||
| NGP.NA.56 | 171.08 | 189.27 | |||||||
| HXMM01 | 171.34 | ||||||||
| G09v1.124 | 176.67 | ||||||||
| G15v2.235 | 180.25 | ||||||||
| G09v1.326 | 185.64 | ||||||||
| NGP.NB.78 | |||||||||
| G12v2.43 | |||||||||
| G12v2.30 | |||||||||
| HBootes01 | |||||||||
| Mean Stackc | … | … | |||||||
| [O IV]26µmd and [Fe II]26µmd | |||||||||
| Name | [O iv] flux | [O iv] a | Continuumb | [Fe ii] flux | [Fe ii] a | ||||
| (10-18Wm-2) | (µm) | (mJy) | (10-18Wm-2) | (µm) | |||||
| G15v2.19 | |||||||||
| G09v1.40 | 80.03 | 80.33 | |||||||
| G12v2.257 | 82.61 | 82.93 | |||||||
| NGP.NA.144 | 82.90 | 83.21 | |||||||
| NGP.NA.56 | 85.49 | 85.81 | |||||||
| HXMM01 | 85.70 | 85.94 | |||||||
| G09v1.124 | 88.28 | 88.62 | |||||||
| G15v2.235 | 90.07 | 90.41 | |||||||
| G09v1.326 | 92.76 | 93.12 | |||||||
| NGP.NB.78 | |||||||||
| G12v2.43 | 106.87 | 107.28 | |||||||
| G12v2.30 | 110.27 | 110.68 | |||||||
| HBootes01 | |||||||||
| Mean Stackc | |||||||||
| H2 S(0) | H2 S(1) | ||||||||
| Name | Line flux | Line a | Continuumb | Line flux | Line a | Continuumb | |||
| (10-18Wm-2) | (µm) | (mJy) | (10-18Wm-2) | (µm) | (mJy) | ||||
| G15v2.19 | 57.20 | ||||||||
| G09v1.40 | 87.22 | ||||||||
| G12v2.257 | |||||||||
| NGP.NA.144 | 54.55 | ||||||||
| NGP.NA.56 | 93.18 | 56.25 | |||||||
| HXMM01 | 56.33 | ||||||||
| G09v1.124 | 58.09 | ||||||||
| G15v2.235 | 59.26 | ||||||||
| G09v1.326 | |||||||||
| NGP.NB.78 | 116.01 | ||||||||
| G12v2.43 | 116.49 | ||||||||
| G12v2.30 | 120.18 | 72.55 | |||||||
| HBootes01 | 120.61 | ||||||||
| Mean Stackc | |||||||||
Note. — upper limits are given for lines that are not detected above the significance level. Parameters for lines without observations are left blank. a For detected lines the wavelength corresponds to the measured (observed frame) position of the line, otherwise the expected (observed frame) wavelength is given, based on the nominal redshifts in Table 1. b The continuum flux measured adjacent to the emission line. c The stack values are discussed in Section 3.3 d The [O IV]26 and [Fe II]26 lines occur close together in a single spectrum and are therefore fit simultaneously.
3.3. Stacked spectra
We next investigate the average properties of the spectra by stacking the observations of each transition for all the galaxies, which reduces the background noise by a factor of for a stack of galaxies with the same background. To trace to fainter noise limits we include both the 13 targeted galaxies, and the 32 archival sources in the stacks. We have verified that the measured line fluxes (or limits) are consistent whether or not the archival data are included. For each line the stacked spectra contains 8–37 galaxies and we therefore expect improvements of factors of –6 in the average sensitivity of individual spectra by stacking.
To perform the stacking we first shift each spectrum to the rest frame and subtract the continuum. We generate a base rest-frame wavelength grid with spacing equal to the average rest-frame native PACS resolution for each line targeted. The individual spectra are then rebinned to the new rest-frame wavelength grid and three different stacks are generated:
-
•
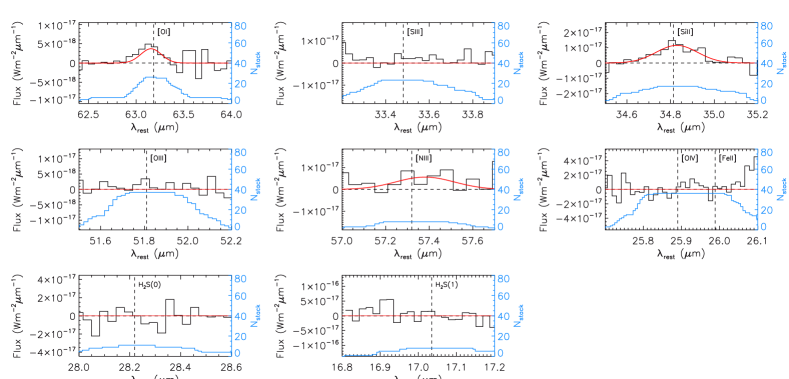
Our fiducial method is a mean stack, derived by calculating the mean value in each wavelength bin. These mean spectra for each targeted emission line are shown in Figure 2 and the measurements are presented in Table 3.2. For the line flux/FIR ratios examined in Sections 3.4 and 3.7 we use the mean FIR (42.5–122.5 µm) of the sources included in the stack, such that the ratio is equivalent to mean(line flux)/mean(FIR).
-
•
We also generate median stacks, consisting of the median value in each wavelength bin, which are used to investigate whether a few bright outliers dominate the fiducial mean stacks.
-
•
To investigate the presence of trends with infrared emission weighted mean stacks are also produced, where each source is weighted by (42.5–122.5 µm), In this case measurements from the weighted mean stacks are equivalent to mean(line flux/FIR).
The rest-frame wavelength coverage from different observing programs varies, so the number of galaxies contributing to each wavelength bin varies, as is shown in Figure 2. In each case the stacked spectra are fit using the methodology described in Section 3.2 for the individual observations. Since the number of data points stacked in each wavelength bin varies, the noise level is weighted across the spectra according to . This is valid since the observations for each line have similar depths. For the fiducial mean stacks the measured average fluxes (or limits) are reported in Table 3.2 and the line/FIR (42.5–122.5 µm) ratios in Table 4.
The measured linewidths for the [O I]63, [Si II]34, and [N III]57 (those with detections) in the fiducial mean stacks are , , and , respectively (Figure 2). We caution that these apparent linewidths are not physically meaningful, since they include a contribution from for potential offsets between the literature spectroscopic redshifts (due to broadband CO searches or optical data; Sections 2.1 and 2.4) and the targeted IR transitions, which will artificially broaden the lines.
The line fluxes and upper limits are consistent between the median and (fiducial) mean stacks, which demonstrates that the mean stacks are not dominated by a few bright outliers. With the exception of the [O I]63 line, the weighted stack measurements are also consistent with the mean stacks, showing that for most of the lines there is no evidence of correlations with infrared emission for SMGs. For [O I]63 there is no detection in the weighted stack, with a detection limit of [O I]/FIR (compared with [O I]/FIR for the fiducial mean stack). This suggests that for SMGs there may be a inverse correlation between infrared luminosity and [O I]63 emission. The rest of this paper focuses on the fiducial mean stacked fluxes, but where relevant we discuss how the conclusions would change if we instead considered the [O I]63 weighted stack measurement.
3.4. Individual line strengths
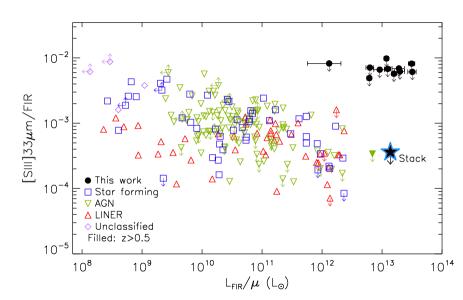
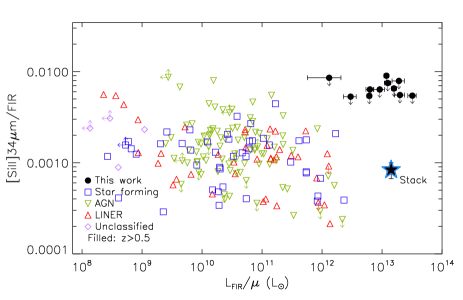
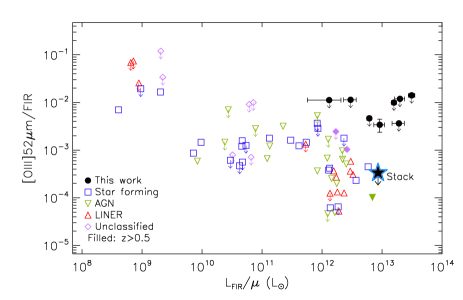
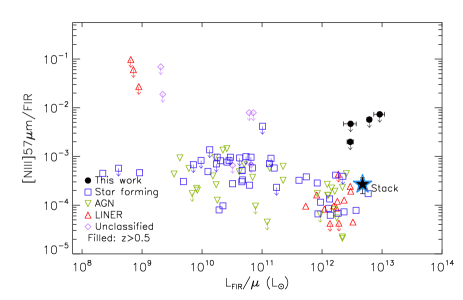
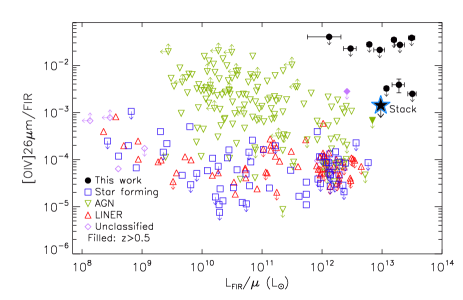
One way to characterize the strength of IR emission lines is via the line to FIR (42.5–122.5 µm) ratio (e.g., Fischer et al., 2010; Sturm et al., 2010; Graciá-Carpio et al., 2011; Coppin et al., 2012; Magdis et al., 2014). These are presented in Figures 3 and 4 for the fine structure lines and H2 lines, respectively, and discussed here. Measurements of the mean stacked spectroscopy for our lensed SMGs are presented, with the relevant and FIR calculated as the mean of the galaxies included in the stack. These derived average line flux to FIR ratios for SMGs are given in Table 4. Published measurements for other galaxies (mostly at low redshift) are also shown in Figures 3 and 4, colour coded by whether they are star-forming galaxies, AGN, LINERs or unclassified (Colbert et al., 1999; Malhotra et al., 2001; Negishi et al., 2001; Sturm et al., 2002, 2006, 2010; Lutz et al., 2003; Verma et al., 2003; Dale et al., 2004; Farrah et al., 2007, 2013; Brauher et al., 2008; O’Halloran et al., 2008; Tommasin et al., 2008, 2010; Bernard-Salas et al., 2009; Hao et al., 2009; Veilleux et al., 2009; Hunt et al., 2010; Ivison et al., 2010a; Graciá-Carpio et al., 2011; Valtchanov et al., 2011; Coppin et al., 2012; Stierwalt et al., 2014). Note that most of the targeted emission lines ([O I]63, [S III]33, [O III]52 and [N III]57) predominantly trace PDRs and H II regions, and any weak AGN contribution will decrease the relative line to FIR ratio, as the continuum emission is preferentially enhanced. Whilst energetically dominent or very powerful AGN can sometimes contribute to the line flux, such AGN are exceptionally rare in SMGs (e.g. Sections 3.4.6 and 3.5; Alexander et al. 2005; Valiante et al. 2007; Pope et al. 2008; Menéndez-Delmestre et al. 2009; Laird et al. 2010; Wang et al. 2013) and are unlikely to affect our measurements.
Locally, the relative strength of many PDR cooling lines, including [O I]63, [S III]33, [N II]122 and [C II]158, are suppressed with respect to the far-IR emission in the most luminous systems, particularly those with ‘warmer’ infrared colours (e.g., Malhotra et al., 2001; Graciá-Carpio et al., 2011; Farrah et al., 2013). Various explanations for the emission line deficits in high luminosity galaxies have been proposed, including their being dustier and having higher ionization parameters in the ISM, resulting in a higher fraction of the UV photons being absorbed by dust and re-emitted in the far-IR, enhancing the far-IR brightness, and thus decreasing the line/FIR ratios (e.g., Luhman et al., 2003; González-Alfonso et al., 2008; Abel et al., 2009; Graciá-Carpio et al., 2011; Farrah et al., 2013; Fischer et al., 2014). Alternative explanations include non-PDR flux in the far-IR, such as from AGN, which would also serve to dilute the PDR line emission (e.g., Malhotra et al., 2001; Luhman et al., 2003; Farrah et al., 2013), or the primary gas coolant not being the typical [C II]158 or [O I]63 lines but instead via other mechanisms (e.g., Farrah et al., 2013). It is therefore probable that PDR line deficits may be indicative of a different ‘mode’ of star formation in local ULIRGs compared with sub-LIRGs, with the ULIRGs’ star-formation being more concentrated, as is typical in merger-induced activity. We next probe whether SMGs exhibit similar deficits on a transition-by-transition basis.
|
 |
|---|---|
|
 |
|
 |
3.4.1 [O I]63µm
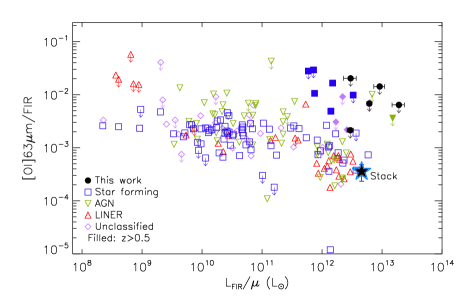
[O I]63 has a critical density of , traces dense molecular gas with K, and is one of the dominant cooling lines in dense PDRs. As can be seen in Figure 3, local LIRGs and ULIRGs have an [O I]63 deficit compared with lower luminosity systems, which typically have [O I]/FIR (e.g., Luhman et al., 2003; Graciá-Carpio et al., 2011; Farrah et al., 2013).
Initial observations and publications hinted that [O I]/FIR may be enhanced in SMGs, with [O I]/FIR similar to local sub-LIRGs (Sturm et al., 2010; Coppin et al., 2012), implying that they may have both large reservoirs of dense gas (to fuel the far-IR luminosities, and probed with CO) like local ULIRGs, but with star-formation efficiencies comparable to late-type galaxies. However, the additional data from our observations (Figure 3) now show that the picture is more complicated, with only four of all 15 SMGs ever observed in [O I]63 (MIPS J142824.0352619; Sturm et al. 2010, and unlensed examples from Coppin et al. 2012) detected (although mostly at low significance). The flux limits available for the majority of the remainder of individual galaxies are not deep enough to provide robust constraints, leaving interpretation of those results open to discussion.
Our mean stacked data are significantly more constraining, providing a detection, with [O I]/FIR. Thus, the mean stack result indicates that, on average, high redshift SMGs behave like local ULIRGs, having a deficit in their [O I]63 emission relative to FIR, although there are exceptions. The non-detection of [O I]63 in the FIR-weighted stack also suggests that there may be a trend in the strength of [O I]63 emission with FIR for SMGs. The difference between the [O I]/FIR in the few individually detected SMGs (from Sturm et al. 2010 and Coppin et al. 2012) and the mean stack is significant, suggesting there may be physical differences between them, perhaps including a range of possible [O I]63 and FIR emission mechanisms for the SMGs. The two galaxies with the most compelling detections in Coppin et al. (2012) both potentially contain AGN (see their discussion), which may be an explanation, as weak AGN can strengthen the relative line flux (notice that the local sources with the highest [O I]/FIR are AGN and LINERs). We further investigate the [O I]63 emission in Section 3.7, where we use PDR models to probe the state of the ISM in high-redshift SMGs.
3.4.2 [S III]33µm
[S III]33 has a lower critical density than [O I]63 and is a key coolant of H II regions. Figure 3 shows that locally the [S III]/FIR ratio is anti-correlated with (40–500 µm) for star-forming galaxies and AGN. This may be an effect of continuum dilution of the line, as is observed in other fine-structure lines (e.g. [C II]158; Dale et al., 2006). None of our individual SMGs or the stack have detections in [S III]33. The upper limits for the undetected individual SMGs are consistent with luminous local galaxies. The limit on the average [S III]/FIR of SMGs from the stacked data is lower than many local systems, but consistent with expectations if the local trend is extrapolated to the higher luminosity of the stack. Our stacked data are also consistent with the one other observation of [S III]33 in a high redshift source (IRASF10214+4724; Sturm et al. 2010).
3.4.3 [Si II]34µm
[Si II]34 is an important cooling line in PDRs. It has a higher ionization energy than [O I]63, but a similar critical density; thus higher intensity radiation fields are required to excite [Si II]34 compared to [O I]63, and it can also be emitted from XDRs. Observations of [Si II]34 have so far been limited to the local Universe, where [Si II]/FIR for AGN, star-forming galaxies and LINERs. Locally, there is hint of a trend of lower [Si II]/FIR in the highest luminosity systems, but not as convincingly as for [O I]63 or [C II]158 (for example). There are also indications that the highest [Si II]/FIR values () are only present in LINERs and AGN, i.e. high ionization environments (Section 3.5). None of the 11 individual SMGs targeted here are detected at the level. However, the [Si II]34 stack is our strongest detection of all the data (7.5), and shows that on average SMGs have [Si II]/FIR. This average value of [Si II]/FIR for SMGs is marginally lower than the local average for all galaxies, but substantially higher than may be expected if the weak trend of [Si II]34/FIR dropping for high luminosity local galaxies continues into the ULIRG regime.
3.4.4 [O III]52µm
[O III]52 is an efficient tracer of H II regions and local ULIRGs show the same suppression in [O III]/FIR as for many of the other fine-structure lines. In our [O III]52 observations one SMG is detected at (NGP.NA.144); the remaining seven individually targeted SMGs and the stack are undetected. In all cases our constraints on [O III]/FIR are consistent with the local LIRG and sub-LIRG population, although in most cases we cannot rule out lower ratios for SMGs (e.g. as is observed in F10214 at ; Sturm et al. 2010). The detected SMG, NGP.NA.144, has [O III]/FIR , which is significantly higher then local ULIRGs, but is somewhat consistent with local LIRGs and sub-LIRGs. In contrast, the stack has [O III]/FIR , consistent with local ULIRGs and lower than most detected local star forming galaxies. Similarly to the [O I]63 data (Section 3.4.1), the dichotomy between the individual NGP.NA.144 detection and the stacked [O III]52 measurement is suggestive of a range of conditions in the [O III]52 emitting region of SMGs.
3.4.5 [N III]57µm
[N III]57 has similar ionization energy and critical density as [O III]52 and is also a strong tracer of H II regions. Local ULIRGs have a similar [N III]57 deficit to [O III]52 and other fine structure lines. We targeted [N III]57 in four lensed SMGs, and none were individually detected above , although the [N III]57 line is detected in the stack of eight SMGs at . The stack, as well as the four individual targets, have [N III]/FIR values that are broadly consistent with local sub-LIRGs, although still within the upper range of values of local ULIRGs. Overall, the [N III]57 emission regions in SMGs likely have similar conditions to local star-forming galaxies and some local ULIRGs.
3.4.6 [O IV]26µm
[O IV]26 is a high excitation line, and as such is a reliable tracer of AGN activity (e.g., Meléndez et al., 2008; Rigby et al., 2009). As can be seen in Figure 3 all local sources with [O IV]/FIR are AGN. Other galaxy types can have some [O IV]26 emission, but it is always fainter (relative to FIR) than this limit, since the [O IV]26 contribution is enhanced in AGN environments.
Of our 10 [O IV]26 targets, nine are undetected and one is detected at (HXMM01). All of the undetected systems have upper limits of [O IV]/FIR, and therefore we cannot rule out some AGN contribution to these galaxies. For HXMM01 we measure [O IV]/FIR, which is significantly above the observed ratios in local star-forming galaxies, and an indication of a hidden AGN in this system. HXMM01 was previously studied by Fu et al. (2013), who found no evidence of an AGN in the mid-IR (IRAC) or far-IR colours, or in (shallow) X-ray observations. They did observe a broad H line in HXMM01, but concluded that it was likely driven by starburst outflows. Thus, our [O IV]26 observation is currently the only distinct evidence of an AGN in HXMM01.
[O IV]26 is not detected in the stacked spectrum, placing an upper limit on [O IV]/FIR of in average SMGs – within the region inhabited by local AGN, star-forming galaxies and LINERs. Thus, there is no evidence from the [O IV]26 that typical SMGs contain strong AGN, but we cannot rule out lower luminosity AGN with the current data. This is consistent with previous analyses of SMGs using other AGN tracers (e.g., Alexander et al., 2005; Pope et al., 2008; Wang et al., 2013), and broadly consistent with the results from [Si II]34 and [S III]33 (Section 3.5), hinting at some AGN emission if the AGN in SMGs are weak and therefore not picked up by our relatively shallow [O IV]26 data.
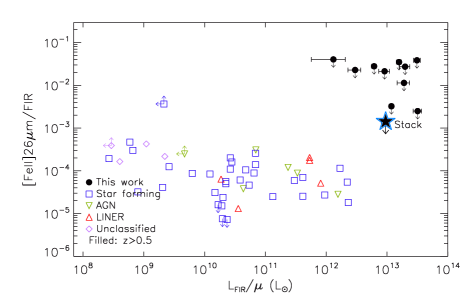
3.4.7 [Fe II]26µm
[Fe II]26 was not specifically targeted by this program, as it is rarely detectable, even locally. However, it occurs only µm (rest-frame) away from [O IV]26 and is therefore included in the spectral coverage of the 10 SMGs for which we targeted the [O IV]26 transition. [Fe II]26 is predominantly emitted from PDRs and it has a low ionization energy and high critical density, similar to [Si II]34. Also similarly to [Si II]34, [Fe II]/FIR is weakly anti-correlated with (40–500 µm) locally (Figure 3), although [Fe II]26 has been measured in fewer galaxies for comparison (e.g., Verma et al., 2003; Farrah et al., 2007; O’Halloran et al., 2008; Bernard-Salas et al., 2009). As our [Fe II]26 data were also obtained serendipitously, they are shallower than required to probe the local observed range of [Fe II]/FIR. All the individual targets as well as the stack are undetected, with limits consistent with local observations.
 |
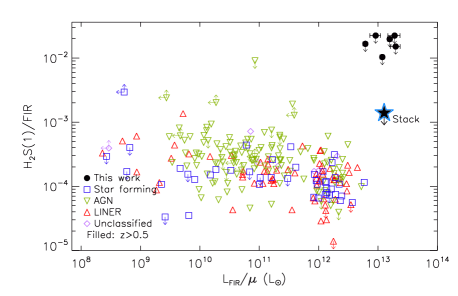 |
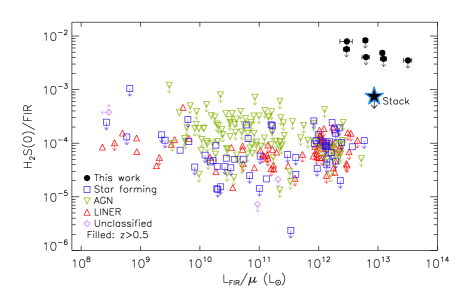
3.4.8 H2 S(0) and H2 S(1)
The H2 S(0) and H2 S(1) rotational transitions trace warm ( K) gas reservoirs (e.g., Rigopoulou et al., 2002; Roussel et al., 2007; Nesvadba et al., 2010; Higdon et al., 2014), winds (e.g., Beirão et al., 2015), and likely shocked gas in extreme systems with enhanced H2 emission (e.g., Appleton et al., 2006). Thus, with detections of H2 S(0) and H2 S(1) we would be able to directly measure the warm H2 gas mass (rather than purely relying on CO), and use the prevalence of shocks to identify violent merger activity. However, the data are not as deep as expected (Figure 4), and none of the individual SMGs nor the stack have emission detectable at the level.
| Ratio | Value |
|---|---|
| Measurementsa | |
| [O I]63/FIR | |
| [S III]33/FIR | |
| [Si II]34/FIR | |
| [O III]52/FIR | |
| [N III]57/FIR | |
| [O IV]26/FIR | |
| [Fe II]26/FIR | |
| S(0)/FIR | |
| S(1)/FIR | |
| [C II]158/FIR | |
| [O I]63/[C II]158 | |
| Predictions from the PDR modelb | |
| [C I]609/FIR | (0.01–20) |
| [C I]370/FIR | (0.01–60) |
| [O I]145/FIR | (0.01–20) |
| [Fe II]26/FIR, | (0.3–50) |
| [Fe II]26/FIR, | (0.9–800) |
Note. — Upper limits are limits. FIR refers to the 42.5–122.5 µm continuum flux (Section 3.1). aFrom the mean stack measurements (Section 3.3). bAs discussed in Section 3.7.2, we use the best-fit parameters of the PDR model to predict the average strengths of other transitions from the PDRs of the SMGs.
3.5. AGN contribution traced by [Si II]34µm and [S III]33µm emission
Previous studies have shown that the ratio of [Si II]34 to [S III]33 flux is an effective discriminator between AGN, LINERs and H II regions (Dale et al., 2006, 2009). Typically the [Si II]34/[S III]33 ratio is used in conjunction with a second discriminator such as the ratios of [Ne III] 16µm to [Ne II] 13µm (Dale et al., 2006) or [Fe II] 26µm to [Ne II] 13µm (Dale et al., 2009). Observations of these additional lines are not available for SMGs, but the [Si II]34/[S III]33 ratio alone is still useful.
Five of our individual targets and the stack have data for both the [Si II]34 and [S III]33 transitions. However, none have detections in one or both of these lines, and therefore the AGN contribution cannot be traced on a individual target basis from our [Si II]34 and [S III]33 data. For the stacked data, the [Si II]34 detection and the [S III]33 limit give [Si II]34/[S III]33 (), placing the average SMG in region I and II of Dale et al. (2006), corresponding to AGN and LINER emission. Thus, the [Si II]34 and [S III]33 measurements suggest that SMGs on average contain AGN, although the absence of other AGN tracers in most cases (e.g., Alexander et al., 2005; Pope et al., 2008; Laird et al., 2010; Wang et al., 2013) indicate that these are unlikely to dominate the energetics.
3.6. Metallicity from the [O III]52µm and [N III]57µm emission
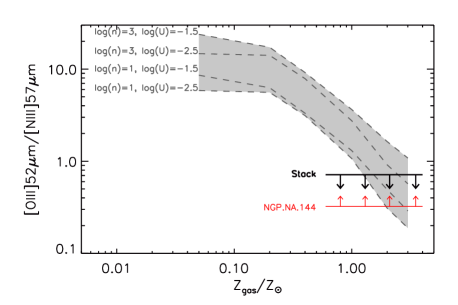
As shown by Nagao et al. (2011) the [O III]52/[N III]57 flux ratio can be a tracer of gas-phase metallicity (see also Pereira-Santaella et al. in prep.). In Figure 5 we compare the measured [O III]52/[N III]57 ratio for the stack and for NGP.NA.144, which is the only individual SMG with a detection in at least one of the relevant transitions.
The models in Figure 5 are from Nagao et al. (2011) and show the variation of [O III]52/[N III]57 with metallicity for different ionization parameters ( to ; dimensionless) and gas densities ( to 3), compared with the measurements for SMGs. These models are generated with cloudy (Ferland et al., 1998) and include PDRs and H II regions, although Nagao et al. (2011) show that the [O III]52 and [N III]57 emission is mostly from the H II regions. The range of densities investigated by Nagao et al. (2011) is consistent with the values that we find for the PDRs in average SMGs (Section 3.7). The ionization parameter () used by Nagao et al. (2011) to trace the strength of the ionizing source is defined as the ratio of hydrogen-ionizing photons to total hydrogen density. They consider values of that are typical of H II regions – the main sources of [O III]52 and [N III]57 emission – and are therefore valid for our SMGs. These model cannot be directly compared with the from our PDR results (Section 3.7) because is dependant on total hydrogen density, whereas the hydrogen in PDRs is primarily atomic.666It is pertinent to note that PDR analyses are usually most sensitive to , which similarly to is a ratio of photon to gas density, although and trace different phases of material.
Metallicity measurements from [O III]/[N III] are not expected to be significantly affected by different optical thickness of the [O III]52 and [N III]57 lines, because the wavelength difference is small. [O III]52 and [N III]57 also have similar filling factors and the ratio is not affected by differential magnification since the two lines have similar ionization parameters and critical densities to each other, and are therefore emitted from approximately the same region of the galaxies. There is unlikely to be a major effect from any weak AGN component, since neither line is significantly boosted by AGN emission. However, the presence of AGN could enhance the ionization parameter, which, as can be seen from Figure 5 would serve to increase the metallicity for a given observed [O III]52/[N III]57. However, if AGN emission is dominant (unlikely for SMGs; e.g. Section 3.5), the [O III]/[N III] ratio is no longer a good metallicity tracer, since the models are for H II regions and not XDRs.
The results from the stacked data (Figure 5) show that the average [O III]52/[N III]57 ratio of SMGs is indicative of them containing enriched gas, with average metallicities, . The [O III]52 and [N III]57 data are insufficient to constrain the metallicity of NGP.NA.144. Previous measurements of the metallicities of SMGs are hard to come by and have large uncertainties. There have been indications that they typically have approximately sub-solar to a few times solar metallicities – including from the [N II]Å/H (Swinbank et al., 2004), extrapolations from the mass-metallicity (or mass-metallicity-SFR) relation, and [N II]205µm/[C II]158µm for one SMG at (Nagao et al., 2012) – although these measurements were plagued with uncertainties and systematic effects.
3.7. ISM density and FUV radiation field
Rather than considering each line observation in isolation, more can be learned by examining the emission line ratios in concert with PDR modelling. However, the low signal-to-noise ratios of the individual observations means that this is only possible for the stacked data – i.e. we can only examine the properties of the average SMG.
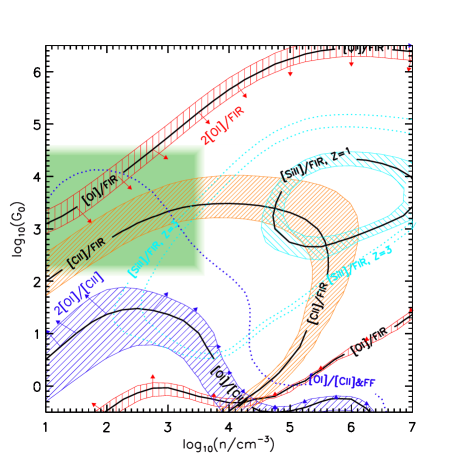
We use the PDR models of Kaufman et al. (1999, 2006), accessed via PDR Toolbox777http://dustem.astro.umd.edu/pdrt (Pound & Wolfire, 2008). The model is characterized using a varying gas density (, in units of the density of hydrogen nuclei), and the strength of the FUV (energies –13 eV) radiation field (, in units of the Habing Field, ). Figure 6 highlights where the model and produce [O I]/FIR and [Si II]/FIR consistent with the SMG average values measured from the fiducial mean stacks (Section 3.3 and Table 4). [Fe II]26 is also available in the Kaufman et al. (2006) PDR model, but our non-detection is too shallow to be useful in constraining and , and so it is not included in Figure 6 and the following discussions.
The [O I]63 and [Si II]34 data alone cannot constrain the conditions of the PDRs in SMGs, so we also include archival [C II]158 measurements from Gullberg et al. (2015) and George (2015) for gravitationally lensed SMGs. Many of the sources in these papers were included in our PACS stacks. The mean [C II]/FIR and [O I]/[C II] are shown in Figure 6, where both the [C II]158 and [O I]63 fluxes are scaled by the FIR (42.5-122.5 µm) of the sources measured, so as to remove any luminosity effects.
To interpret ISM conditions via spectroscopy and PDR models it is typical to identify the regions of and space where the constraints from different line measurements overlap (e.g., Kaufman et al., 1999, 2006; Pound & Wolfire, 2008). It is important to note that the PDR models assume that all the measured fluxes are being emitted from the same spatial region. However, for our SMGs PACS cannot resolve different regions and thus each line measurement is an aggregate over the whole galaxy. Since different PDRs within a galaxy may have different properties, the different line observations may, therefore, be differently weighted towards different regions. Furthermore, we are investigating stacked data – i.e. average line strengths over many SMGs – and therefore emission from several galaxies, which may also have intrinsic spread in their properties (Section 3.4). Therefore, our conclusions are averages, with some natural weighting towards more line-luminous regions and galaxies. In Section 3.7.1 we discuss further considerations; our final interpretation of the PDR parameters are discussed in Section 3.7.2.
3.7.1 Additional considerations
There are several factors that affect the interpretation of Figure 6, which we now discuss. Firstly, a small fraction of local galaxies exhibit self-absorption in the [O I]63 line (e.g., Fischer et al., 1997, 1999; Genzel & Cesarsky, 2000; Farrah et al., 2013; Rosenberg et al., 2015), and it is possible that the [O I]63 emission of SMGs may be self-absorbed since our data are too shallow to directly measure this via the shape of the line. Therefore, in Figure 6 we demonstrate that a factor of two increase in the [O I]63 flux from the measured value would have only a minor effect on the positioning of the [O I]/FIR and [O I]/[C II] contours, with both being within of the directly measured values. The factor of two shown demonstrates the approximate maximum change in Figure 6 likely from [O I]63 self-absorption.
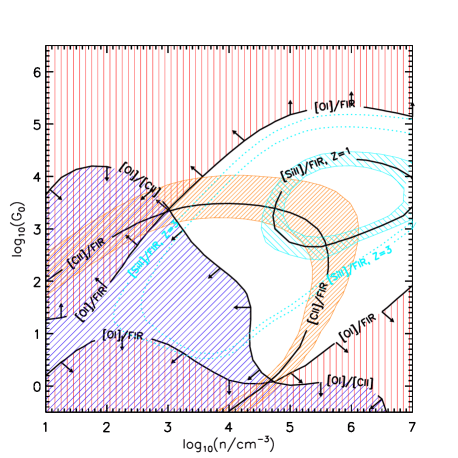
Secondly, as discussed in Section 3.3 there is a difference in the [O I]63 emission as measured from the (fiducial) mean stack, and the FIR-weighted mean stack. If we use the limit on [O I]63 from the weighted mean stack (instead of the fiducial mean stack; Figure 6) the acceptable [O I]/FIR and [O I]/[C II] regions would both be substantially larger than the fiducial result, as shown in Figure 7. Overall, considering the weighted stacked fluxes expands the acceptable range (before accounting for size arguments; Section 3.7.2), but has minimal effect on the inferred PDR density.
In addition, the Kaufman et al. (2006) model includes two sets of [Si II]34 data, for two different metallicities – labelled (where the gas phase metallicities are those in the solar neighbourhood) and (where all elements are three times more abundant) in Figure 6. As discussed in Section 3.6 SMGs are likely to have , although we cannot distinguish between and with current data. Due to the uncertainties we include the constraints for both model metallicities in Figure 6.
For the main contours on Figure 6 the relative filling factors of the various line species in the PACS beams are considered to be equal, i.e. we have not applied any corrections for filling factors. Such corrections are expected to have the biggest effect on the [O I]/[C II] ratio. To make corrections due to the relative [O I]63 and [C II]158 filling factors we would need to know the relative sizes of the regions that dominate those emission lines. The large PACS (for [O I]63) and APEX or SPIRE (for [C II]158) beam sizes preclude directly measuring the extent of the emission. Instead, to gain some insight into the possible size of this effect, we consider the local starburst M82, where the extents of the [O I]63 and [C II]158 emission regions can be directly measured, leading to a required correction factor of 0.112 on the [C II]158 flux, i.e. the [O I]/[C II] is increased by a factor of (e.g., Stacey et al., 1991; Lord et al., 1996; Kaufman et al., 1999; Contursi et al., 2013). Under these circumstances the low density () end of the [O I]/[C II] contour on Figure 6 would be shifted to higher (demonstrated with the dotted line on Figure 6), with the uncertainty region encompassing , and for , respectively. The M82 filling factor correction is substantial, and thus the correction to the [O I]/[C II] ratio for the average SMG is likely to be lower than this; thus the correction explored here demonstrates an approximate upper boundary to the size of the effect.
Another related consideration is that some of the line emission may originate from H II regions (or other gas) rather than PDRs. This is most likely to affect the [C II]158 flux due to the critical densities and ionization parameters of the different transitions studied here, and therefore the non-PDR [C II]158 emission should be subtracted from the observed [C II]158 intensity prior to using it to analyse the PDR conditions. This is typically done by using multi-phase modelling (e.g. cloudy; Ferland et al. 1998), or using other transitions (such as [N II]122µm) to determine the contribution from H II regions. However, there are few observations of [N II]122 in SMGs (Ferkinhoff et al., 2011; Combes et al., 2012; Decarli et al., 2012; Nagao et al., 2012), and the complexity of cloudy modelling coupled with the limitations in our data means that cloudy analysis will not improve the uncertainties in our analysis. We instead investigate the effect of some of the [C II]158 emission coming from non-PDR gas qualitatively, noting that if some of the observed [C II]158 flux is not from the PDRs, then the correct values of [C II]/FIR and [O I]/[C II] to use in Figure 6 would be decreased and increased, respectively. The effect of a factor of two increase in [O I]/[C II] is shown on Figure 6 and is minor. Note that due to the critical density and ionization potential of [C II]158 it is unlikely to be dominated by non-PDR emission, i.e., the factor of two considered is the approximately the upper limit of any non-PDR correction required. A decrease of [C II]/FIR also has a small effect on Figure 6, shifting the contours to slightly higher and but remaining within the current uncertainty area, although the updated error region marginally overlaps with the [O I]/FIR uncertainties. Thus different non-PDR emission is unlikely to have a substantial effect on the interpretation of the [C II]158 and [O I]63 fluxes in Figure 6.
In some cases [Si II]34 can be boosted by AGN emission (e.g., Dale et al., 2006, 2009). If some of the observed [Si II]34 flux is from AGN then removing this contribution would move the [Si II]/FIR contours on Figure 6 outwards, i.e. similarly to increasing metallicity. As discussed in Section 3.5 there is evidence from the [Si II]/[S III] ratio that there is some AGN contribution in the stacked [Si II]34 data, which may explain why the contours for and for our observed [Si II]/FIR (particularly for ) are offset from those derived from [O I]/FIR and [O I]/[C II].
It is possible that the different transitions studied may have different optical depths. Although all the lines in Figure 6 are in the IR they cover a significant range in rest-frame wavelength (34µm for [Si II], to 158µm for [C II]) and we are examining some of the dustiest galaxies in the Universe. Similarly to the filling factors, this effect is most likely to affect the positioning of the [O I]/[C II] contours, and will shift them in a similar manner (i.e. towards higher for a given ), due to the shorter wavelength [O I]63 being more strongly affected.
Finally, of the galaxies included in the stacks are known to be gravitationally lensed, and we have so far assumed that the lensing amplification is equal in all components of emission. In fact, since these are composed of galaxy-galaxy lenses, differential magnification, caused by different regions of the background galaxy being amplified by different amounts is possible. If differential magnification is a random effect then it is more likely to affect analyses of individual galaxies (e.g. in Figure 3) than the average values examined in Figure 6 and for the PDR modelling, where the effects will be minimized due to averaging many sources. However, there may be systematic effects in regions emitting the majority of the different line species, resulting in them being differentially amplified. This is likely to be an important effect, due to biases in the identification of lensed SMGs – a crucial step in the selection of many of the PACS targets.
The spatial resolution of the spectroscopy is insufficient to resolve and model the lensing for each transition individually, so even if we had attained detections for several galaxies individually we would be unable to determine the differential magnification on a case by case basis. Instead we consider the simulations of Serjeant (2012) who investigated systematic effects in the differential magnification of a simple dusty galaxy model with a variety of foreground galaxy lenses and alignments. Serjeant (2012) found no systematic differential magnification effects in [C II]/FIR for lensed SMGs and claimed that that there are similarly unlikely to be systematic effects in [O I]/FIR because [O I]63 and [C II]158 are observed to be co-spatial in M82 on small scales (Sturm et al., 2010). In that scenario we would also not expect differential amplification effects in [O I]/[C II], or [Si II]/FIR, which traces the same environments. However, we consider how the contours on Figure 6 would change if half the [C II]158 emission is instead from a more extended region (e.g. an H II region) than the PDRs. In this case the [C II]158 flux from the smaller PDR will typically be more highly magnified than the extended [C II]158 and thus the overall effect will be to minimize the fraction of detected [C II]158 from non-PDR regions, somewhat canceling out the effect of non-PDR [C II]158 emission on the line ratios. In this case the [Si II]34 and [O I]63 emitting gas will be situated in the PDRs along with the [C II]158, and thus be co-spatial on all but the smallest scales, making them unlikely to be strongly systematically affected by differential magnification. We reiterate that this discussion of the systematic effects of differential amplification is applicable only to the average (i.e. stacked) values of the sample, and that individual galaxies may have quite substantial differential magnification effects.
3.7.2 Inferred PDR parameters
Based on the data shown in Figure 6 and the discussion in Section 3.7.1 we determine that the average SMG has and . In Table 4 we use these values and PDR Toolbox to predict the average strength of the [C I]370µm, [C I]609µm, [O I]145µm, and [Fe II]26µm lines from the PDRs in SMGs.
The and solution where the [O I]/FIR, [C II]/FIR, and [O I]/[C II] contours are coincident (Figure 6) is excluded because such a low in SMGs with (intrinsic) would require source sizes of hundreds of kpc, which is clearly unphysical.888 Wolfire et al. (1990) showed that , where is a characteristic size of the emission region. The proportionality constant includes the contribution from the ionizing photon field (i.e., dependant on the IMF and star-formation history); we use the values from Stacey et al. (2010) to estimate the sizes described here and shown in Figure 6 (see also Danielson et al., 2011). For and the source sizes are expected to be –10 kpc; lower values are excluded as they would require excessively large sources. Measurements show that SMGs have typical total sizes of –10 kpc (Tacconi et al., 2006; Younger et al., 2008; Swinbank et al., 2010; Ivison et al., 2011; Riechers et al., 2011b; Bussmann et al., 2013; Calanog et al., 2014; Ikarashi et al., 2015), usually smaller in the far-IR continuum (dust) than the rest-frame optical (stars) or radio emission (e.g., Simpson et al., 2015). Higher values are acceptable if the weighted stack for the [O I]63 line is used, although for the inferred source sizes would be smaller than typically observed for SMGs and are thus unlikely.
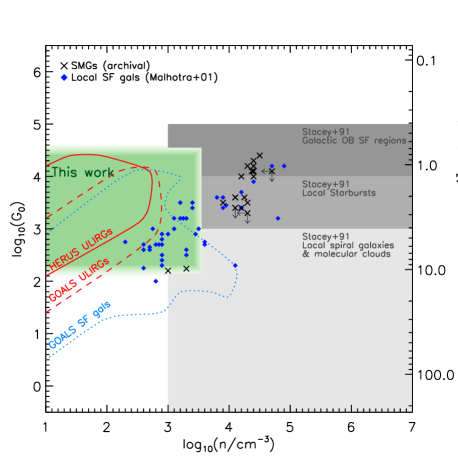
In the right-hand panel of Figure 6 the values of and that we infer for average SMGs are compared with the regions of – space typically populated by local ULIRGs and star-forming galaxies, as determined by similar PDR modeling from HERUS (Farrah et al., 2013) and GOALS (Díaz-Santos et al. in prep.). The HERUS and GOALS ULIRGs include galaxies with (with star-formation rather than AGN dominated); the GOALS star-forming sample are the galaxies with contribution to the bolometric luminosity from star-formation of which are LIRGs and the remainder ULIRGs. Also highlighted in Figure 6 are the regions found to be preferentially occupied by local starbursts, spiral galaxies, molecular clouds and galactic OB star-forming regions, as determined by [C II]158/CO(=10) ratios (Stacey et al., 1991). In addition, we also show measurements of local star-forming galaxies (Malhotra et al., 2001) and individual SMGs with existing measurements of and , typically from CO and [C II]158 lines (Sturm et al., 2010; Cox et al., 2011; Danielson et al., 2011; Valtchanov et al., 2011; Alaghband-Zadeh et al., 2013; Huynh et al., 2014; Rawle et al., 2014).
It can be seen in Figure 6 that full PDR modeling (from the HERUS and GOALS results; Farrah et al., 2013, Díaz-Santos et al. in prep.) results in correlated and . The local samples also show that local ULIRGs typically have higher than the mostly LIRG and sub-LIRG star-forming galaxies (although there is substantial overlap between the two populations). This is in contrast with the [C II]158/CO(=10) measurements from Stacey et al. (1991) that suggested that can efficiently distinguish between starburst and spiral galaxy star-formation. The observations of individual local, mostly (sub-)LIRG, star-forming galaxies (primarily based on [C II]158 and [O I]63 data; Malhotra et al., 2001) extend to higher and than the GOALS results, although they broadly follow the same trend. The PDR density and FUV field strength from our stacked line measurements of SMGs align with the regions for both local ULIRGs and local star-forming galaxies (Figure 6). However, the current data are unable to distinguish between probable merger triggering and secular evolution of SMGs.
Figure 6 also shows that the values derived from our fine-structure line spectroscopy are lower than most archival measurements of individual SMGs (both lensed and unlensed). It is possible that the apparent difference between our stacking results and individual archival SMG studies are due to bias in the selection of individually analysed SMGs or uncertainties in our analysis, such as if [O I]63 self absorption is significantly greater than the factor of two that we have investigated. However, it could also be due to systematic uncertainties in the archival analyses, since most of the archival measurements are inferred from only two spectral features, CO and [C II]158, and thus is primarily constrained by CO. These existing SMG studies typically use high- CO observations, which are converted to CO(=10) fluxes using standard ratios, but in SMGs CO(=10) and high- emission regions are often not co-located, with higher- lines tracing warmer, more compact dust than CO(=10) (e.g., Ivison et al., 2011; Riechers et al., 2011a; Spilker et al., 2015). This means that for SMGs CO(=10) fluxes estimated from higher- measurements may not trace the same region or spatial scales as the [C II]158 and PDR models, which could bias the derived . Bisbas et al. (2014), for example, demonstrate a similar effect, showing that different CO transitions probe to different cloud depths in the PDRs in NGC 4030.
4. Conclusions
We have presented Herschel-PACS spectroscopy and photometry of a sample of 13 gravitationally lensed SMGs at –3.27, targeting the [O IV]26, [Fe II]26, [S III]33, [Si II]34, [O III]52, [N III]57, and [O I]63 fine-structure lines, and the H2 S(0) and H2 S(1) hydrogen rotational lines. We detected only two lines at significance ([O III]52 in NGP.NA.144, and [O IV]26 in HXMM01).
To supplement our data we identified 32 additional SMGs that also have Herschel-PACS spectroscopy of the targeted lines, and we stacked these archival spectra with those from our 13 originally targeted sources. The stacked spectra include eight (for the two hydrogen lines) to 37 (for [O III]52) SMGs, resulting in average spectra of SMGs with improvements of up to a factor of in the nominal noise level. We detected [O I]63, [Si II]34, and [N III]57 in the stacks, with line strengths relative to the far-IR continuum of , , and , respectively.
Based on the [O III]52/[N III]57 line ratios we determined that SMGs are typically enriched galaxies, with gas-phase metallicities . The stacked [Si II]34/[S III]33 ratio indicates that there is some LINER and/or AGN contribution to the IR spectra, although the absence of strong [O IV]26 emission and other AGN tracers suggests that these are unlikely to dominate the energetics of typical SMGs.
The ratio of the [O I]63 flux to the far-IR continuum flux in the stacked data is , significantly lower than the roughly observed in local sub-LIRGs, but consistent with local ULIRGs. We used PDR Toolbox to model the stacked [O I]63 and [Si II]34 data and also included average [C II]158 measurements from Gullberg et al. (2015) and George (2015). The model indicates that on average the PDRs in SMGs have gas densities, , of and FUV field strengths, . These values are consistent with both measurements of local ULIRGs and mostly LIRG and sub-LIRG star-forming galaxies. Additional IR data are required to further constrain the PDR models and determine whether the star-formation in high-redshift SMGs is more similar to local sub-LIRGs than local ULIRGs. The derived is lower than most measurements of individual SMGs from [C II]158 and CO data, which may be due to the previous widespread use of high- CO transitions and the uncertainties converting these to CO(=10) luminosities.
References
- Abel et al. (2009) Abel, N. P., Dudley, C., Fischer, J., Satyapal, S., & van Hoof, P. A. M. 2009, ApJ, 701, 1147
- Alaghband-Zadeh et al. (2012) Alaghband-Zadeh, S., et al. 2012, MNRAS, 424, 2232
- Alaghband-Zadeh et al. (2013) —. 2013, MNRAS, 435, 1493
- Alexander et al. (2005) Alexander, D. M., Bauer, F. E., Chapman, S. C., Smail, I., Blain, A. W., Brandt, W. N., & Ivison, R. J. 2005, ApJ, 632, 736
- Appleton et al. (2006) Appleton, P. N., et al. 2006, ApJ, 639, L51
- Aravena et al. (2016) Aravena, M., et al. 2016, MNRAS, 457, 4406
- Asboth et al. (2016) Asboth, V., et al. 2016, MNRAS, 462, 1989
- Beirão et al. (2015) Beirão, P., et al. 2015, MNRAS, 451, 2640
- Bernard-Salas et al. (2009) Bernard-Salas, J., et al. 2009, ApJS, 184, 230
- Bisbas et al. (2014) Bisbas, T. G., Bell, T. A., Viti, S., Barlow, M. J., Yates, J., & Vasta, M. 2014, MNRAS, 443, 111
- Blain et al. (2002) Blain, A. W., Smail, I., Ivison, R. J., Kneib, J., & Frayer, D. T. 2002, Phys. Rep., 369, 111
- Bothwell et al. (2013) Bothwell, M. S., et al. 2013, ApJ, 779, 67
- Brauher et al. (2008) Brauher, J. R., Dale, D. A., & Helou, G. 2008, ApJS, 178, 280
- Brisbin et al. (2015) Brisbin, D., Ferkinhoff, C., Nikola, T., Parshley, S., Stacey, G. J., Spoon, H., Hailey-Dunsheath, S., & Verma, A. 2015, ApJ, 799, 13
- Bussmann et al. (2012) Bussmann, R. S., et al. 2012, ApJ, 756, 134
- Bussmann et al. (2013) —. 2013, ApJ, 779, 25
- Bussmann et al. (2015) —. 2015, ApJ, 812, 43
- Calanog et al. (2014) Calanog, J. A., et al. 2014, ApJ, 797, 138
- Carilli & Walter (2013) Carilli, C. L., & Walter, F. 2013, ARA&A, 51, 105
- Casey et al. (2014) Casey, C. M., Narayanan, D., & Cooray, A. 2014, Phys. Rep., 541, 45
- Chapman et al. (2005) Chapman, S. C., Blain, A. W., Smail, I., & Ivison, R. J. 2005, ApJ, 622, 772
- Chen et al. (2013) Chen, C.-C., Cowie, L. L., Barger, A. J., Casey, C. M., Lee, N., Sanders, D. B., Wang, W.-H., & Williams, J. P. 2013, ApJ, 762, 81
- Chen et al. (2011) Chen, C.-C., Cowie, L. L., Wang, W.-H., Barger, A. J., & Williams, J. P. 2011, ApJ, 733, 64
- Colbert et al. (1999) Colbert, J. W., et al. 1999, ApJ, 511, 721
- Combes et al. (2012) Combes, F., et al. 2012, A&A, 538, L4
- Conley et al. (2011) Conley, A., et al. 2011, ApJ, 732, L35+
- Contursi et al. (2013) Contursi, A., et al. 2013, A&A, 549, A118
- Coppin et al. (2012) Coppin, K. E. K., et al. 2012, MNRAS, 427, 520
- Cowley et al. (2015) Cowley, W. I., Lacey, C. G., Baugh, C. M., & Cole, S. 2015, MNRAS, 446, 1784
- Cox et al. (2011) Cox, P., et al. 2011, ApJ, 740, 63
- Daddi et al. (2010) Daddi, E., et al. 2010, ApJ, 714, L118
- Dale & Helou (2002) Dale, D. A., & Helou, G. 2002, ApJ, 576, 159
- Dale et al. (2004) Dale, D. A., Helou, G., Brauher, J. R., Cutri, R. M., Malhotra, S., & Beichman, C. A. 2004, ApJ, 604, 565
- Dale et al. (2006) Dale, D. A., et al. 2006, ApJ, 646, 161
- Dale et al. (2009) —. 2009, ApJ, 693, 1821
- Danielson et al. (2011) Danielson, A. L. R., et al. 2011, MNRAS, 410, 1687
- Decarli et al. (2012) Decarli, R., et al. 2012, ApJ, 752, 2
- Dowell et al. (2014) Dowell, C. D., et al. 2014, ApJ, 780, 75
- Dunne & Eales (2001) Dunne, L., & Eales, S. A. 2001, MNRAS, 327, 697
- Eales et al. (2010) Eales, S., et al. 2010, PASP, 122, 499
- Elbaz et al. (2011) Elbaz, D., et al. 2011, A&A, 533, A119
- Farrah et al. (2001) Farrah, D., et al. 2001, MNRAS, 326, 1333
- Farrah et al. (2007) —. 2007, ApJ, 667, 149
- Farrah et al. (2008) —. 2008, ApJ, 677, 957
- Farrah et al. (2013) —. 2013, ApJ, 776, 38
- Ferkinhoff et al. (2011) Ferkinhoff, C., et al. 2011, ApJ, 740, L29
- Ferland et al. (1998) Ferland, G. J., Korista, K. T., Verner, D. A., Ferguson, J. W., Kingdon, J. B., & Verner, E. M. 1998, PASP, 110, 761
- Fischer et al. (2014) Fischer, J., Abel, N. P., González-Alfonso, E., Dudley, C. C., Satyapal, S., & van Hoof, P. A. M. 2014, ApJ, 795, 117
- Fischer et al. (1997) Fischer, J., et al. 1997, in ESA Special Publication, Vol. 419, The first ISO workshop on Analytical Spectroscopy, ed. A. M. Heras, K. Leech, N. R. Trams, & M. Perry, 149
- Fischer et al. (1999) Fischer, J., et al. 1999, Ap&SS, 266, 91
- Fischer et al. (2010) —. 2010, A&A, 518, L41
- Frayer et al. (2011) Frayer, D. T., et al. 2011, ApJ, 726, L22
- Fu et al. (2012) Fu, H., et al. 2012, ApJ, 753, 134
- Fu et al. (2013) —. 2013, Nature, 498, 338
- Genzel & Cesarsky (2000) Genzel, R., & Cesarsky, C. J. 2000, ARA&A, 38, 761
- Genzel et al. (2010) Genzel, R., et al. 2010, MNRAS, 407, 2091
- George (2015) George, R. D. 2015, PhD thesis, The University of Edinburgh
- Gladders & Yee (2005) Gladders, M. D., & Yee, H. K. C. 2005, ApJS, 157, 1
- González-Alfonso et al. (2008) González-Alfonso, E., Smith, H. A., Ashby, M. L. N., Fischer, J., Spinoglio, L., & Grundy, T. W. 2008, ApJ, 675, 303
- Graciá-Carpio et al. (2011) Graciá-Carpio, J., et al. 2011, ApJ, 728, L7
- Greve et al. (2005) Greve, T. R., et al. 2005, MNRAS, 359, 1165
- Griffin et al. (2010) Griffin, M. J., et al. 2010, A&A, 518, L3
- Gullberg et al. (2015) Gullberg, B., et al. 2015, MNRAS, 449, 2883
- Hailey-Dunsheath et al. (2010) Hailey-Dunsheath, S., Nikola, T., Stacey, G. J., Oberst, T. E., Parshley, S. C., Benford, D. J., Staguhn, J. G., & Tucker, C. E. 2010, ApJ, 714, L162
- Hao et al. (2009) Hao, L., Wu, Y., Charmandaris, V., Spoon, H. W. W., Bernard-Salas, J., Devost, D., Lebouteiller, V., & Houck, J. R. 2009, ApJ, 704, 1159
- Harris et al. (2012) Harris, A. I., et al. 2012, ApJ, 752, 152
- Hayward et al. (2013) Hayward, C. C., Narayanan, D., Kereš, D., Jonsson, P., Hopkins, P. F., Cox, T. J., & Hernquist, L. 2013, MNRAS, 428, 2529
- Higdon et al. (2014) Higdon, S. J. U., Higdon, J. L., Smith, B. J., & Hancock, M. 2014, ApJ, 787, 103
- Hildebrand (1983) Hildebrand, R. H. 1983, QJRAS, 24, 267
- Hunt et al. (2010) Hunt, L. K., Thuan, T. X., Izotov, Y. I., & Sauvage, M. 2010, ApJ, 712, 164
- Huynh et al. (2014) Huynh, M. T., et al. 2014, MNRAS, 443, L54
- Ikarashi et al. (2015) Ikarashi, S., et al. 2015, ApJ, 810, 133
- Ivison et al. (2011) Ivison, R. J., Papadopoulos, P. P., Smail, I., Greve, T. R., Thomson, A. P., Xilouris, E. M., & Chapman, S. C. 2011, MNRAS, 412, 1913
- Ivison et al. (2010a) Ivison, R. J., Smail, I., Papadopoulos, P. P., Wold, I., Richard, J., Swinbank, A. M., Kneib, J., & Owen, F. N. 2010a, MNRAS, 404, 198
- Ivison et al. (2010b) Ivison, R. J., et al. 2010b, A&A, 518, L35+
- Ivison et al. (2013) —. 2013, ApJ, 772, 137
- Kaufman et al. (2006) Kaufman, M. J., Wolfire, M. G., & Hollenbach, D. J. 2006, ApJ, 644, 283
- Kaufman et al. (1999) Kaufman, M. J., Wolfire, M. G., Hollenbach, D. J., & Luhman, M. L. 1999, ApJ, 527, 795
- Krumholz et al. (2012) Krumholz, M. R., Dekel, A., & McKee, C. F. 2012, ApJ, 745, 69
- Laird et al. (2010) Laird, E. S., Nandra, K., Pope, A., & Scott, D. 2010, MNRAS, 401, 2763
- Lord et al. (1996) Lord, S. D., Hollenbach, D. J., Haas, M. R., Rubin, R. H., Colgan, S. W. J., & Erickson, E. F. 1996, ApJ, 465, 703
- Luhman et al. (2003) Luhman, M. L., Satyapal, S., Fischer, J., Wolfire, M. G., Sturm, E., Dudley, C. C., Lutz, D., & Genzel, R. 2003, ApJ, 594, 758
- Lutz et al. (2003) Lutz, D., Sturm, E., Genzel, R., Spoon, H. W. W., Moorwood, A. F. M., Netzer, H., & Sternberg, A. 2003, A&A, 409, 867
- Magdis et al. (2014) Magdis, G. E., et al. 2014, ApJ, 796, 63
- Malhotra et al. (2001) Malhotra, S., et al. 2001, ApJ, 561, 766
- Markwardt (2009) Markwardt, C. B. 2009, in Astronomical Society of the Pacific Conference Series, Vol. 411, Astronomical Data Analysis Software and Systems XVIII, ed. D. A. Bohlender, D. Durand, & P. Dowler, 251
- Meléndez et al. (2008) Meléndez, M., et al. 2008, ApJ, 682, 94
- Menéndez-Delmestre et al. (2013) Menéndez-Delmestre, K., Blain, A. W., Swinbank, M., Smail, I., Ivison, R. J., Chapman, S. C., & Gonçalves, T. S. 2013, ApJ, 767, 151
- Menéndez-Delmestre et al. (2009) Menéndez-Delmestre, K., et al. 2009, ApJ, 699, 667
- Messias et al. (2014) Messias, H., et al. 2014, A&A, 568, A92
- Nagao et al. (2012) Nagao, T., Maiolino, R., De Breuck, C., Caselli, P., Hatsukade, B., & Saigo, K. 2012, A&A, 542, L34
- Nagao et al. (2011) Nagao, T., Maiolino, R., Marconi, A., & Matsuhara, H. 2011, A&A, 526, A149
- Narayanan et al. (2015) Narayanan, D., et al. 2015, Nature, 525, 496
- Nayyeri et al. (2016) Nayyeri, H., et al. 2016, ApJ, 823, 17
- Negishi et al. (2001) Negishi, T., Onaka, T., Chan, K.-W., & Roellig, T. L. 2001, A&A, 375, 566
- Negrello et al. (2010) Negrello, M., et al. 2010, Science, 330, 800
- Negrello et al. (2014a) —. 2014a, MNRAS, 440, 1999
- Negrello et al. (2014b) —. 2014b, MNRAS, 440, 1999
- Negrello et al. (2016) —. 2016, ArXiv e-prints
- Nesvadba et al. (2010) Nesvadba, N. P. H., et al. 2010, A&A, 521, A65
- O’Halloran et al. (2008) O’Halloran, B., Madden, S. C., & Abel, N. P. 2008, ApJ, 681, 1205
- Oliver et al. (2012) Oliver, S. J., et al. 2012, MNRAS, 424, 1614
- Omont et al. (2013) Omont, A., et al. 2013, A&A, 551, A115
- Ott (2010) Ott, S. 2010, in Astronomical Society of the Pacific Conference Series, Vol. 434, Astronomical Data Analysis Software and Systems XIX, ed. Y. Mizumoto, K.-I. Morita, & M. Ohishi, 139
- Pilbratt et al. (2010) Pilbratt, G. L., et al. 2010, A&A, 518, L1
- Poglitsch et al. (2010) Poglitsch, A., et al. 2010, A&A, 518, L2
- Pope et al. (2008) Pope, A., et al. 2008, ApJ, 675, 1171
- Pound & Wolfire (2008) Pound, M. W., & Wolfire, M. G. 2008, in Astronomical Society of the Pacific Conference Series, Vol. 394, Astronomical Data Analysis Software and Systems XVII, ed. R. W. Argyle, P. S. Bunclark, & J. R. Lewis, 654
- Rawle et al. (2014) Rawle, T. D., et al. 2014, ApJ, 783, 59
- Riechers et al. (2011a) Riechers, D. A., Hodge, J., Walter, F., Carilli, C. L., & Bertoldi, F. 2011a, ApJ, 739, L31
- Riechers et al. (2011b) Riechers, D. A., et al. 2011b, ApJ, 733, L12+
- Riechers et al. (2013) —. 2013, Nature, 496, 329
- Rigby et al. (2009) Rigby, J. R., Diamond-Stanic, A. M., & Aniano, G. 2009, ApJ, 700, 1878
- Rigopoulou et al. (2002) Rigopoulou, D., Kunze, D., Lutz, D., Genzel, R., & Moorwood, A. F. M. 2002, A&A, 389, 374
- Rodighiero et al. (2011) Rodighiero, G., et al. 2011, ApJ, 739, L40
- Roseboom et al. (2012) Roseboom, I. G., et al. 2012, MNRAS, 419, 2758
- Rosenberg et al. (2015) Rosenberg, M. J. F., et al. 2015, ApJ, 801, 72
- Roussel et al. (2007) Roussel, H., et al. 2007, ApJ, 669, 959
- Sanders & Mirabel (1996) Sanders, D. B., & Mirabel, I. F. 1996, ARA&A, 34, 749
- Scott et al. (2011) Scott, K. S., et al. 2011, ApJ, 733, 29
- Serjeant (2012) Serjeant, S. 2012, MNRAS, 424, 2429
- Serjeant (2016) —. 2016, ArXiv e-prints
- Sharon et al. (2013) Sharon, C. E., Baker, A. J., Harris, A. I., & Thomson, A. P. 2013, ApJ, 765, 6
- Silva et al. (1998) Silva, L., Granato, G. L., Bressan, A., & Danese, L. 1998, ApJ, 509, 103
- Simpson et al. (2014) Simpson, J. M., et al. 2014, ApJ, 788, 125
- Simpson et al. (2015) —. 2015, ApJ, 799, 81
- Smail et al. (2005) Smail, I., Smith, G. P., & Ivison, R. J. 2005, ApJ, 631, 121
- Spilker et al. (2015) Spilker, J. S., et al. 2015, ApJ, 811, 124
- Spilker et al. (2016) —. 2016, ApJ, 826, 112
- Stacey et al. (1991) Stacey, G. J., Geis, N., Genzel, R., Lugten, J. B., Poglitsch, A., Sternberg, A., & Townes, C. H. 1991, ApJ, 373, 423
- Stacey et al. (2010) Stacey, G. J., Hailey-Dunsheath, S., Ferkinhoff, C., Nikola, T., Parshley, S. C., Benford, D. J., Staguhn, J. G., & Fiolet, N. 2010, ApJ, 724, 957
- Stierwalt et al. (2014) Stierwalt, S., et al. 2014, ApJ, 790, 124
- Sturm et al. (2002) Sturm, E., Lutz, D., Verma, A., Netzer, H., Sternberg, A., Moorwood, A. F. M., Oliva, E., & Genzel, R. 2002, A&A, 393, 821
- Sturm et al. (2006) Sturm, E., et al. 2006, ApJ, 653, L13
- Sturm et al. (2010) —. 2010, A&A, 518, L36
- Swinbank et al. (2004) Swinbank, A. M., Smail, I., Chapman, S. C., Blain, A. W., Ivison, R. J., & Keel, W. C. 2004, ApJ, 617, 64
- Swinbank et al. (2010) Swinbank, A. M., et al. 2010, Nature, 464, 733
- Swinbank et al. (2014) —. 2014, MNRAS, 438, 1267
- Tacconi et al. (2006) Tacconi, L. J., et al. 2006, ApJ, 640, 228
- Tacconi et al. (2008) —. 2008, ApJ, 680, 246
- Tacconi et al. (2010) —. 2010, Nature, 463, 781
- Tommasin et al. (2010) Tommasin, S., Spinoglio, L., Malkan, M. A., & Fazio, G. 2010, ApJ, 709, 1257
- Tommasin et al. (2008) Tommasin, S., Spinoglio, L., Malkan, M. A., Smith, H., González-Alfonso, E., & Charmandaris, V. 2008, ApJ, 676, 836
- Valiante et al. (2007) Valiante, E., Lutz, D., Sturm, E., Genzel, R., Tacconi, L. J., Lehnert, M. D., & Baker, A. J. 2007, ApJ, 660, 1060
- Valiante et al. (2016) Valiante, E., et al. 2016, MNRAS, 462, 3146
- Valtchanov et al. (2011) Valtchanov, I., et al. 2011, MNRAS, 415, 3473
- Veilleux et al. (2002) Veilleux, S., Kim, D.-C., & Sanders, D. B. 2002, ApJS, 143, 315
- Veilleux et al. (2009) Veilleux, S., et al. 2009, ApJS, 182, 628
- Verma et al. (2003) Verma, A., Lutz, D., Sturm, E., Sternberg, A., Genzel, R., & Vacca, W. 2003, A&A, 403, 829
- Vieira et al. (2013) Vieira, J. D., et al. 2013, Nature, 495, 344
- Wang et al. (2014) Wang, L., et al. 2014, MNRAS, 444, 2870
- Wang et al. (2013) Wang, S. X., et al. 2013, ApJ, 778, 179
- Wardlow et al. (2011) Wardlow, J. L., et al. 2011, MNRAS, 415, 1479
- Wardlow et al. (2013) —. 2013, ApJ, 762, 59
- Weiß et al. (2013) Weiß, A., et al. 2013, ApJ, 767, 88
- Wolfire et al. (1990) Wolfire, M. G., Tielens, A. G. G. M., & Hollenbach, D. 1990, ApJ, 358, 116
- Yang et al. (2016) Yang, C., et al. 2016, A&A, 595, A80
- Younger et al. (2008) Younger, J. D., et al. 2008, ApJ, 688, 59
Appendix A Archival data included in these analyses
The archival sources and PACS observations that are included in the stacking analyses are listed in Table 5.
| Name | RA | Dec | a | FIRa | Magnification | Referencesb | Program ID | OBSIDsc | |
|---|---|---|---|---|---|---|---|---|---|
| () | () | ||||||||
| ID9 | 00°42′01″ | 1.577 | 4.4 | 8.2 | N14 | OT1_averma_1 | 134223228[5–7], 134224524[0–2] | ||
| ID11 | 00°03′24″ | 1.786 | 5.7 | 7.7 | N14 | OT1_averma_1 | 134223129[1–4] | ||
| ID17 | 01°41′27″ | 2.305 | 6.8 | 5.0 | N14 | OT1_averma_1 | 134223131[3,4] | ||
| HLock01 | +57°30′28″ | 2.958 | 11 | 4.3 | Co11, R11, S11 | OT1_averma_1 | 1342232311, 134224564[4–6], | ||
| 1342256251, 1342256261 | |||||||||
| G15v2.779d | +02°23′05″ | 4.243 | 7.6 | 1.2 | B12, B13 | OT1_averma_1 | 1342238160, 1342261470 | ||
| SMM J2135e | +01°02′52″ | 2.326 | 4.3 | 3.6 | I10 | OT1_averma_1 | 1342231704, 1342244443, 1342245235, | ||
| 1342245393, 134225694[0–1], 1342257256 | |||||||||
| NC.v1.143 | +23°36′27″ | 3.565 | 8.9 | 2.2 | B13, Rp | OT1_averma_1 | 1342257[799,800] | ||
| NA.v1.177 | +29°23′27″ | 2.778 | 6.0 | 2.7 | … | B13 | OT1_averma_1 | 134225956[0,1] | |
| SWIRE 3-9 | +57°13′23″ | 1.735 | 0.47 | 0.73 | 1 | B15 | OT2_dbrisbin_1 | 1342253586, 1342253776 | |
| SWIRE 3-14 | +57°57′09″ | 1.780 | 0.28 | 0.29 | 1 | B15 | OT2_dbrisbin_1 | 1342247014, 1342247131 | |
| SWIRE 4-5 | +58°43′10″ | 1.756 | 0.10 | 0.09 | 1 | B15 | OT2_dbrisbin_1 | 134224663[8,9] | |
| SWIRE 4-15 | +59°02′36″ | 1.854 | 0.30 | 0.37 | 1 | B15 | OT2_dbrisbin_1 | 1342253587, 1342253775 | |
| SDSS J1206 | +51°42′28″ | 1.999 | 0.42 | 0.46 | B15 | OT2_dbrisbin_1 | 1342246801 | ||
| SMM J0302 | +00°06′52″ | 1.408 | 0.46 | 1.2 | 1 | B15 | OT2_dbrisbin_1 | 134224778[4,5] | |
| MIPS 22530 | +59°16′00″ | 1.950 | 0.62 | 0.69 | 1 | B15 | OT2_dbrisbin_1 | 1342249495, 1342256260 | |
| LESS21 | 27°34′44″ | 1.235 | 0.07 | 0.13 | 1 | C12 | OT1_kcoppin_1 | 1342239701 | |
| LESS34 | 27°52′28″ | 1.098 | 0.06 | 0.14 | 1 | C12 | OT1_kcoppin_1 | 1342239703 | |
| LESS66 | 27°54′10″ | 1.315 | 0.14 | 0.41 | 1 | C12 | OT1_kcoppin_1 | 1342239369 | |
| LESS88 | 27°53′41″ | 1.269 | 0.08 | 0.17 | 1 | C12 | OT1_kcoppin_1 | 1342239705 | |
| LESS106 | 27°56′22″ | 1.617 | 0.15 | 0.23 | 1 | C12 | OT1_kcoppin_1 | 1342239753 | |
| LESS114 | 27°44′36″ | 1.606 | 0.33 | 0.57 | 1 | C12 | OT1_kcoppin_1 | 1342239702 | |
| SPT 0538-50 | 50°30′50″ | 2.782 | 5.1 | 2.3 | Bo13 | OT2_dmarrone_2 | 1342270691 | ||
| SPT 0125-47 | 47°23′57″ | 2.515 | 8.7 | 4.9 | A16, V13, We13 | OT2_dmarrone_2 | 1342270768 | ||
| SPT 0103-45 | 45°38′54″ | 3.092 | 3.4 | 1.2 | G15, V13, We13, S16 | OT2_dmarrone_2 | 1342271050 | ||
| F10214 | +47°09′09″ | 2.286 | 8.4 | 6.0 | S10 | SDP_kmeisenh_3 | 1342186812, 1342187021 | ||
| SMM J14011 | +02°52′24″ | 2.565 | 1.4 | 0.76 | S05, S13 | KPGT_kmeisenh_1 | 134221331[1–4], 1342213677 | ||
| SMM J22471 | 02°05′53″ | 1.158 | 2.7 | 10 | S10 | OT1_gstacey_3 | 1342211842, 1342212211 | ||
| SWIRE J104738 | +59°10′10″ | 1.958 | 0.40 | 0.42 | 1 | S10 | OT1_gstacey_3 | 134223226[8,9] | |
| SWIRE J104704 | +59°23′33″ | 1.954 | 1.0 | 1.1 | 1 | S10 | OT1_gstacey_3 | 134223227[0,1] | |
| SMM J123634 | +62°12′41″ | 1.222 | 0.54 | 1.8 | 1 | S10 | OT1_gstacey_3 | 1342232[599,601] | |
| MIPS J142824 | +35°26′18″ | 1.325 | 1.3 | 3.6 | HD10, S10 | SDP_esturm_3 | 1342187779 | ||
| SMM J02396 | 01°34′24″ | 1.062 | 0.17 | 0.84 | G05, C11, C13 | KPGT_esturm_1 | 1342214674 |
Note. — a and FIR are the apparent (i.e. not corrected for lensing) far-IR luminosity (40–500 µm) and continuum flux (42.5–122.5 µm), respectively (Section 3.1). Where unavailable from published SED fits these are estimated by scaling published infrared luminosities to the required rest-frame wavelength ranges using the average fitted SED of the targeted SMGs. b References are not the complete list of published papers on each source, but rather the source of data used in this paper: A16: Aravena et al. (2016), Bo13: Bothwell et al. (2013), B12: Bussmann et al. (2012), B13: Bussmann et al. (2013), B15: Brisbin et al. (2015), C11: Chen et al. (2011), Co11: Conley et al. (2011), C12: Coppin et al. (2012), C13: Chen et al. (2013), G05: Greve et al. (2005), G15: Gullberg et al. (2015), HD10: Hailey-Dunsheath et al. (2010), I10: Ivison et al. (2010b), N14: Negrello et al. (2014b), R11: Riechers et al. (2011b), Rp: Riechers et al. (in prep.), S05: Smail et al. (2005), S10: Stacey et al. (2010), S11: Scott et al. (2011), S13: Sharon et al. (2013), S16: Spilker et al. (2016), V13: Vieira et al. (2013), We13: Weiß et al. (2013). c OBSIDs are the Herschel observation identification number(s) for this program, used to identify the the photometric and spectroscopic observation of each target in the Herschel archive. d Also known as ID15.141 or ID141.
Appendix B 1D spectra
In Figure 8 (fig 8.1–8.13) we show the individual spectral observations for each lensed SMG observed in OT2_jwardlow_1.