A counter-image to the gravitational arc in Abell 1201: Evidence for IMF variations, or a 1010 M⊙ black hole?††thanks: Based on observations collected at the European Southern Observatory, Chile (ESO Programme 077.A-0806(A)).††thanks: Based on observations made with the NASA/ESA Hubble Space Telescope, obtained from the Data Archive at the Space Telescope Science Institute, which is operated by the Association of Universities for Research in Astronomy, Inc., under NASA contract NAS 5-26555. These observations are associated with program 08719.
Abstract
Abell 1201 is a massive galaxy cluster at z=0.169 with a brightest cluster galaxy (BCG) that acts as a gravitational lens to a background source at z=0.451. The lensing configuration is unusual, with a single bright arc formed at small radius (2 arcsec), where stars and dark matter are both expected to contribute substantially to the total lensing mass. Here, we present deep spectroscopic observations of the Abell 1201 BCG with MUSE, which reveal emission lines from a faint counter-image, opposite to the main arc, at a radius of 0.6 arcsec. We explore models in which the lensing mass is described by a combination of stellar mass and a standard dark-matter halo. The counter-image is not predicted in such models, unless the dark-matter component is negligible, which would imply an extremely heavy stellar initial mass function (IMF) in this galaxy. We consider two modifications to the model which can produce the observed configuration without resorting to extreme IMFs. Imposing a radial gradient in the stellar mass-to-light ratio, , can generate a counter-image close to the observed position if increases by 60 per cent within the inner 1 arcsec (e.g. variation from a Milky-Way-like to a Salpeter-like IMF). Alternatively, the counter-image can be produced by introducing a central super-massive black hole. The required mass is = (1.30.6)1010 M⊙, which is comparable to the largest black holes known to date, several of which are also hosted by BCGs. We comment on future observations which promise to distinguish between these alternatives.
keywords:
gravitational lensing: strong – galaxies: elliptical and lenticular, cD – galaxies: clusters: individual: Abell 12011 Introduction
Rich galaxy clusters are extreme locations: they occupy the largest dark-matter haloes in the universe, and harbour the most massive galaxies at their centres. In turn, the central galaxies of massive clusters host some of the most extreme black holes known to date.
Clusters are dominated by dark matter (DM) at all but the smallest radii, so they provide important constraints on the structures of DM haloes. At large radii, weak-lensing and X-ray data largely support the Navarro, Frenk & White (1995) (NFW) functional form e.g. Kneib et al. 2003; Schmidt & Allen 2007. The slope of the DM profile towards the cluster centre is sensitive to the micro-physics of the DM particle (Spergel & Steinhardt, 2000), as well as to interactions between baryonic and dark components e.g. Blumenthal et al. 1986. Determining the inner halo profile slope is, however, hampered by the presence of the brightest cluster galaxy (BCG), located at or near the halo centre. Within a radius of a few kpc, the stellar mass density of the BCG is comparable to, or exceeds, the DM density. Hence the observational challenge of studying the central structure of the DM halo is coupled to that of understanding the stellar component (Sand et al., 2004).
The BCG stellar mass contribution is also a matter of interest in its own right, since massive elliptical galaxies are widely suspected to harbour stars formed according to an initial mass function (IMF) different from that pertaining to the Milky Way (MW) e.g. Treu et al. 2010; Conroy & van Dokkum 2012b; Cappellari et al. 2012. If the IMF variations are associated with the physical conditions in violent starburst events at early epochs e.g. Chabrier, Hennebelle & Charlot 2014, then the centres of BCGs are a likely site to habour the affected populations. In a recent study using a combination of stellar dynamics and gravitational lensing constraints on the mass profile of BCGs, Newman et al. (2013b) found a preference for both shallower-than-NFW DM profiles and heavier-than-MW IMFs, on average.
Finally, the most massive galaxies, in the most massive haloes, are also likely hosts for the largest central black holes (BH) in the universe (McConnell et al., 2011; Hlavacek-Larrondo et al., 2012). In distant lensing clusters, kinematic data do not resolve the dynamical effects of BHs, and the relative contribution of the BH to the lensing mass is usually negligible. However, for clusters at lower redshift, sufficiently massive BHs may have measurable effects on the stellar kinematics at small radius. For certain configurations, massive BHs can also affect the lensing caustic structure, altering the number of images observable (Mao, Witt & Koopmans, 2001).
In this paper, we present the first results from new wide-field integral-field spectroscopic observations of the = 0.169 cluster Abell 1201. Edge et al. (2003) (hereafter E03) identified a bright tangential arc around the BCG using shallow Hubble Space Telescope imaging with WFPC2 (Wide Field and Planetary Camera 2), obtained as part of a systematic search for lensing clusters (Sand et al., 2004). The lensing configuration of Abell 1201 is unusual, in that the arc is located at a radius of only 2 arcsec (6 kpc), well within the effective radius of the BCG, rather than at the 10 arcsec scales typical for cluster lenses. E03 also presented Keck spectroscopy from which they measured a redshift of = 0.451 for the arc. X-ray observations of Abell 1201 (Owers et al., 2009; Ma et al., 2012) indicate a post-merger morphology for Abell 1201, with the merger direction aligned with the BCG major axis, and the BCG itself offset from the X-ray peak by 11 kpc along the same axis. From the radial velocities of 165 member galaxies, Rines et al. (2013) measure a cluster velocity dispersion = km s-1, and derive a virial mass = (3.90.1) M⊙ (for = 0.678) from the infall caustic fitting method. Based on Sloan Digital Sky Survey (SDSS) photometry, the BCG has a luminosity of 41011 L⊙,r, while the Two Micron All Sky Survey (Jarrett et al., 2000) yields 1.61012 L⊙,K. The BCG has a half-light radius of 15 kpc. Sand et al. (2004) measured a velocity dispersion of = 230–250 km s-1 in the inner 1.5 arcsec; SDSS reports = 27714 km s-1. The luminosity, radius and velocity dispersion for the Abell 1201 BCG are consistent with the early-type galaxy Fundamental Plane.
Our new integral-field observations were motivated by the unusually small separation of the bright arc in Abell 1201, which makes it feasible to combine stellar kinematics and strong-lensing information across an overlapping range in radius, which is not possible in most lensing clusters. The velocity dispersion measurements from the Sand et al. (2004) long-slit spectra do not reach the radius of the arc in Abell 1201, while previous integral-field observations (Swinbank, 2003) covered a much narrower field-of-view and sampled a limited spectral range, not including the bright [O iii] emission line from the arc. Our stellar kinematic measurements and dynamical modelling will be presented in a forthcoming paper. Here, we focus on the strong-lensing constraints, showing that the unusual configuration of Abell 1201 allows us to infer the presence of an additional centrally-concentrated mass, of order M⊙, with no detectable luminous counterpart.
The remainder of the paper is structured as follows: Section 2 describes the observations and data reduction steps, and presents the general lensing configuration, including identification of a faint counter-image close to the centre of the BCG. Section 3 presents a lensing analysis constrained only by the main arc, using models with a constant stellar mass-to-light ratio combined with a parametrized dark-matter halo. Section 4 then discusses the interpretation of the counter-image, proposing three alternative scenarios: (a) a very heavy IMF throughout the BCG, (b) a steep radial variation in the stellar initial mass function, and (c) a very massive central black hole. In Section 5 we discuss the merits and implications of these solutions, with reference to external evidence, and Section 6 considers future observations which might help discriminate between them. Brief conclusions are summarized in Section 7.
For computing physical scales we adopt the relevant cosmological parameters from Planck Collaboration et al. (2016): = 0.678, = 0.308 and = 0.692. In this cosmology, the spatial scale at the redshift of Abell 1201 is 2.96 kpc arcsec-1.
2 MUSE observations
We observed Abell 1201 with the Multi-Unit Spectroscopic Explorer (MUSE) (Bacon et al., 2010) on the 8.2m Yepun (Unit Telescope 4) of European Southern Observatory’s Very Large Telescope. The data used in this paper were obtained on the nights of March 31 and April 2, 2016, under good seeing conditions.
A total of twelve 940-second exposures were obtained, using the standard spectral configuration, covering 4750–9350 Å, sampled at 1.25 Å per pixel, with resolution 2.6 Å FWHM (at = 7000 Å). Each exposure spans a 1 arcmin2 field-of-view, with 0.2 arcsec spatial pixels. To help suppress the effects of instrumental artifacts, the observations were arranged in four groups of three exposures each. Each group was observed at a different position angle (0, 90, 180, 270 degrees), and the field centres for the groups were arranged in a 22 grid, with separation of 15 arcsec. Hence the total field observed is 7575 arcsec2, while the full exposure time of 3.1 hours was obtained only in the central 4545 arcsec2. Further small dither offsets (0.5 arcsec) were made between the exposures in each group.
The initial data reduction steps were accomplished using the standard MUSE pipeline. Each of the twelve exposures was reconstructed to generate a separate datacube, using an initial “global” sky spectrum obtained from the darkest parts from the complete field of view. This leaves a wavelength-dependent background “striping” effect, apparently due to residual bias-level variations which differ among the 24 separate spectrograph “channels” of the instrument. To reduce the impact of these variations, we derived and subtracted a separate “residual sky” spectrum from the darkest spatial pixels in each channel, prior to combining the separate observations into a single final data-cube. During this final combination, integer-pixel astrometric offsets were applied, and pixels at the edge of each channel were masked to improve the flatness of the background.
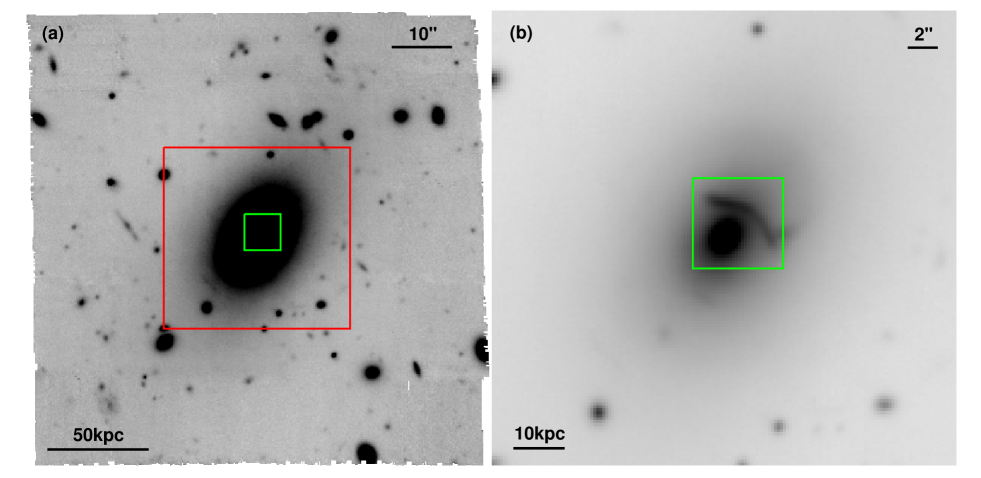
A broad-band image generated from the combined MUSE data-cube is shown in Fig. 1. The point-spread function, measured at 7000 Å from stars in the combined observation, has a FWHM of 0.6 arcsec (2.9 pixels). The tangential arc is clearly seen in the continuum image, as well as numerous other cluster and background galaxies111We have conducted a careful search for additional lensed galaxies behind Abell 1201, which could provide improved constraints on the lensing model. Although many faint emission-line objects were found, none of them can be identified as multiply imaged.. The BCG light can be traced to 20 arcsec (60 kpc).
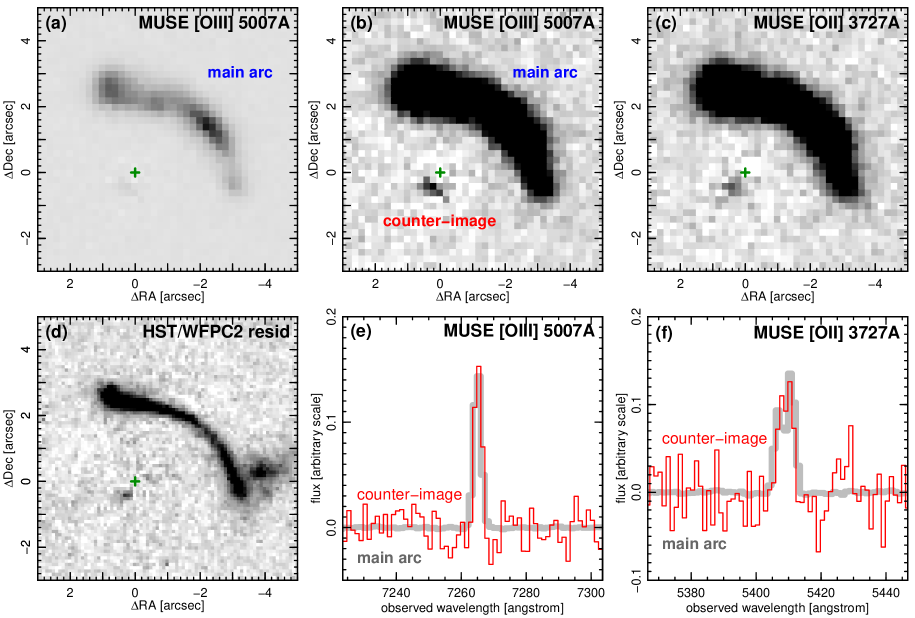
Fig. 2 presents the discovery of a faint counter-image to the main arc. Extracting the MUSE spectrum of the main arc, we find that the [O iii] 5007 Å is the brightest emission line in the MUSE spectral range. Integrating over this line, and subtracting a continuum derived from neighbouring wavelengths, we obtain the net emission-line image shown in Fig. 2a,b. In addition to the main arc reported by E03, a significant excess emission is observed 0.6 arcsec SSE of the BCG centre, with a flux ratio 1:200, relative to the integrated value for the main arc. A faint peak is seen at the same location in a similarly-constructed net [O ii] 3727 Å image (Fig. 2c). In fact, a residual feature is already clearly visible at this location in the E03 HST WFPC2 image, after subtracting a model for the BCG light (Fig. 2d). Note that the bright object at (–4,+0.5) arcsec is an unrelated background galaxy at = 0.273, which is not multiply-imaged.) Spectra extracted at the location of the faint peak (after subtracting a model for the BCG spectrum) show that the excess flux is clearly centred on the expected wavelengths of the [O iii] and [O ii] lines (Fig. 2e,f). The weaker [O iii] 4959 Å and H lines are not clearly detected from the inner image, but given the spatial coincidence of HST continuum emission with the significant emission in two lines, both of which are well-matched to the expected wavelengths, we consider it beyond reasonable doubt that the faint source is a lensed counter-image to the main arc.
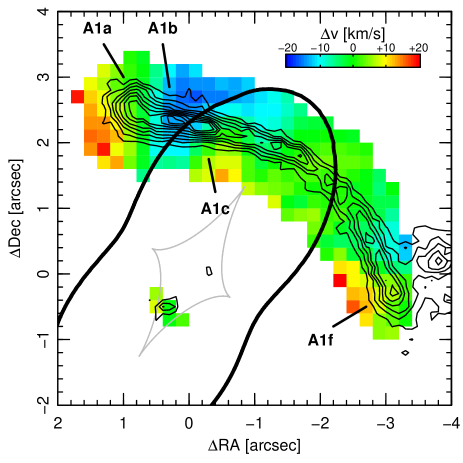
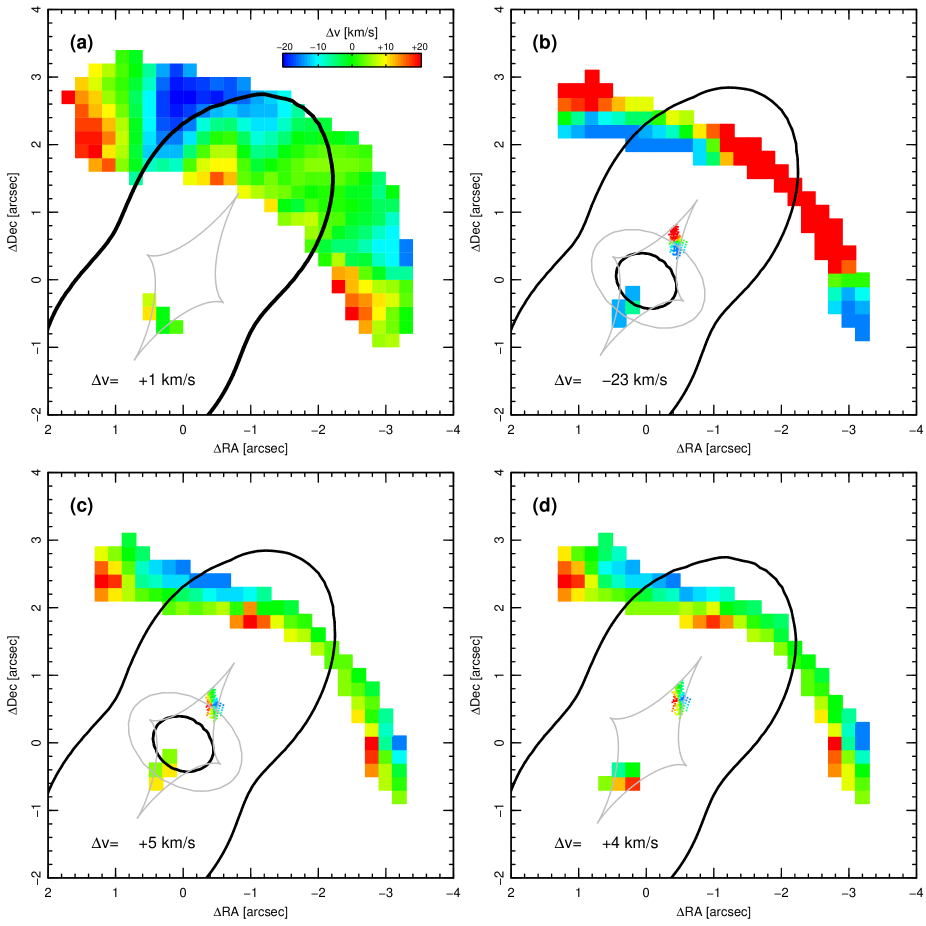
The spatial resolution of the MUSE data is much lower than that of the HST image, so in the lens modelling reported in Sections 3 and 4 we primarily use HST-derived positional constraints. However, the emission-line data can provide additional information to help verify the solutions obtained. Although matching the overall form of the arc as seen by HST, there are notable differences which cannot be attributed to the difference in resolution. Strikingly, the bright image pair at (0.0,+2.3) arcsec, denoted A1b/c by E03, and used by them to locate the critical curve, does not correspond to any peak in the emission-line map. Conversely, the region of weaker continuum at (–2.2,+1.2) arcsec is coincident with the maximum in the [O iii] image. Other local peaks are located at the extremities of the arc (A1a, A1f in the E03 nomenclature), roughly coincident with continuum maxima, and at (–0.5,+0.2) arcsec, which does not have a continuum counterpart. Fig. 3 shows the velocity map derived from the [O iii] line. The total velocity range is 25 km s-1. A reversal in the velocity trend along the arc, due to the lens folding, is clearly seen at (0,+2.2) arcsec, as reported previously by Swinbank (2003).
3 Models constrained by the main arc
E03 showed that the main arc could be reproduced by a “cusp" configuration, where the unlensed position of the source crosses one of the points of the tangential caustic. In this case, each point in the source maps to three neighbouring images close to the tangential critical line; for an extended source, the images merge to form a single large arc.
In this section, we develop models for the lens, constrained by three positions on the main arc proposed by E03 to be sister images of one another: the A1b/c image pair bracketing the critical curve, and A1f at the far end of the arc. The location of the velocity fold in Fig. 3 strongly supports the critical curve passing through A1b/c, though we note that the velocity near A1f appears discrepant with the measurements near A1b/c. The coordinates for the constraints, in arcsec relative to the BCG centre, are: A1b = , A1c = , A1f = , determined by computing centroids within a 2-pixel window around each flux peak in the HST image. The estimated positional error on all constraints is 0.025 arcsec in each coordinate, i.e. a quarter of the HST pixel.
All lensing calculations here are made using the gravlens/lensmodel software (Keeton, 2001).
3.1 Constant models
The first models we attempt to fit are those in which the mass distribution is fully determined by the observed luminosity of the BCG.
The luminosity profile of the Abell 1201 BCG exhibits a clear flattening near the centre, well beyond the radius affected by the HST PSF. Within the radius of the tangential arc but outside the PSF disk, the profile is well described by an elliptical “Nuker” law (Lauer et al., 1995), with outer and inner logarithmic slopes of 1.2 and 0.4 respectively, and break radius 1 kpc, or “cusp radius” 0.5 kpc. Cores of this size are typical for BCGs of comparable luminosity: at –23.7, Lauer et al. (2007) derive a mean = 0.45 kpc with a factor-of-two galaxy-to-galaxy scatter.
For the lens modelling, we choose to represent the stellar mass using a pixelized convergence map, to account for the detailed profile and angular structure in the BCG. Specifically, we construct an ellipse-fit representation of the HST image, derived after masking pixels affected by the main arc and by the = 0.273 source. We calibrate to the -band by matching the large-aperture flux of the BCG as measured from Data Release 8 of SDSS (Aihara et al., 2011), and use the source and lens redshifts to compute a lensing convergence map under an assumed mass-to-light ratio of = 1 (in solar units). A scaling parameter applied to this convergence then yields the lensing estimate for . For the mass-follows-light models, is formally identical to the stellar mass-to-light ratio , but in practice of course we expect the mass to include contributions from dark matter.
Without additional freedom, the constant model is unable to fit the three positional constraints or produce the observed arc morphology. This is a generic result, already noted by E03: any model matched to the orientation and ellipticity of the BCG light, in which the critical curve bisects A1b/c, will produce a third image that does not lie on the arc. The simplest solution is to include greater freedom in the model, by introducing an external linear shear term, with amplitude and direction . The shear is intended as a first-order approximation to the effect of structure beyond the modelled region. (E03 achieved a similar effect by adding a highly-elliptical mass component to represent the cluster potential.) The inclusion of the shear term is motivated by the complex and asymmetric mass structure surrounding the lens: X-ray observations and optical spectroscopy (Owers et al., 2009; Ma et al., 2012) indicate a post-merger morphology for Abell 1201, with the merger direction aligned with the BCG major axis, and the BCG itself is offset from the X-ray peak by 11 kpc along the same axis.
Fig. 4a shows the lensing caustics, critical lines, and image and source positions, for the best-fitting model with constant and shear. The model matches the input position constraints essentially perfectly; there is only one residual degree of freedom in the fit. Moreover, the model reproduces the overall morphology of the main arc: pixels in the arc map to one another successfully, despite not being used as constraints in the model fitting. The arc points also map to a credible morphology in the source plane, lying across the cusp of the tangential caustic. The emission-line structure of the arc provides additional support for this general scenario: the critical curve passes directly through the continuum-faint but line-bright region at (–2.2,+1.2) arcsec. This is suggestive of an emission-line peak located near the caustic, at the northern tip of the unlensed source, and mapping to an image pair that is unresolved at the MUSE resolution. The third image corresponding to this pair would be close to A1a, the peak at the north-eastern extremity of the arc, which is also bright in the emission map (see Fig 2a).
The derived shear is large in amplitude ( = 0.22), and directed 31 deg West of North, in a convention where the angle indicates the direction of an external mass concentration generating the shear. This direction is consistent with the overall cluster axis along which the BCG and merging substructure are aligned. We derive a total mass-to-light of = 10.60.3 in , where the errors are estimated by simple Monte Carlo simulation, perturbing the positional constraints by errors of 0.025 arcsec in each coordinate, and re-fitting the model. This result is consistent with the value of = in , estimated by E03 from their two-component parametric model. The total mass-to-light ratio is much larger than the expected value of 4 for an old stellar population with MW-like IMF222For example, a single-burst population formed at 4, has age 10 Gyr at = 0.169. In the Maraston (2005) models, with Kroupa (2001) IMF, this population has = 3.5 for [Z/H] = 0.0 or = 4.4 for [Z/H] = +0.35. This value is for observed SDSS -band, after correcting for a 18 per cent bandshifting effect., indicating either a heavier IMF, or significant dark-matter contributions, or both. The projected mass inside a 1.6 arcsec (4.75 kpc) radius aperture is = (371) 1010 M⊙.
3.2 Models with a dark-matter halo
We now consider models with an explicit description for the dark halo as a separate mass component, assumed to follow a Navarro, Frenk & White (1996) (NFW) density profile.
In the cases shown in Fig. 4, we impose a 25 or 50 per cent dark-matter fraction within an aperture of 4.75 kpc radius. Panels (b) and (c) show the models with a spherical halo, while in panel (d) the halo is flattened with ellipticity = 0.4. In each case, the NFW break radius is fixed at = 300 kpc (100 arcsec). For the virial radius of 1.47 Mpc (for our cosmology) measured by Rines et al. (2013), this corresponds to a halo concentration 4.9, which is typical in simulations for clusters with mass similar to that of Abell 1201333 Neto et al. (2007) report a mean 4.8, with a 2 range of 3.0–7.4, at = 3.51014 M⊙, for our cosmology. We have verified that even adopting = 150 kpc, corresponding to 10 makes no substantive difference to the results in this paper.
After optimising the stellar mass-to-light ratio and the external shear, the models with dark matter yield fits to the main arc that are virtually identical to those of the mass-follows-light models. This is consistent with the expectation that only the total projected mass within the arc would be well constrained. Adding 50 per cent dark matter naturally reduces the derived stellar mass-to-light ratio, to 5. Increasing the halo ellipticity reduces the required external shear amplitude, to = 0.12. Regardless of the form of the adopted halo, the total projected mass within a 4.75 kpc radius aperture is slightly reduced from the no-dark-matter case, with = (351) 1010 M⊙.
4 Interpretation of the counter-image
In this section, we turn to considering models which can adequately predict the presence of the inner counter-image shown in Fig. 2.
4.1 A uniformly very heavy IMF?
In the models with dark-matter haloes (Fig. 4b,c,d), the source lies inside a so-called “naked cusp”, where the tangential caustic curve extends beyond the elliptical caustic. This unusual configuration leads to exactly three images, of similar magnification, close to the tangential critical line. The naked cusp arises from the combination of high ellipticity and strong shear in Abell 1201 (which determines the size of the tangential caustic), together with the shallow total mass profile (which sets the location of the radial caustic).
In the case where all of the gravitating mass is distributed identically to the stellar light (Fig. 4a), the total mass profile is steeper, so that some points in the source fall inside both caustics, and generate additional images, forming a radial arc444 We use the term “radial arc” specifically to refer to an image generated by an extended source which crosses the radial caustic.. The new images will be faint compared to the main arc (both because they are relatively demagnified by the lens, and because they map to outer parts of the source). Simple elliptical source models can adequately match the observed 1:200 flux ratio. The predicted position of the radial arc is close to, but not exactly coincident with the observed location of the counter-image, being offset 0.15 arcsec towards the lens centre.
If we interpret this model as a pure “stellar-mass” lens, then the mass-to-light ratio of = 10.6 implies an extremely heavy IMF, with a mass excess factor of 2.4–3.0 (relative to Kroupa), depending on the metallicity, if the stellar population is old. This is larger than the typical mass-excess factors of 1.5–2.0 reported for giant ellipticals (see Section 5), and of course the DM contribution is unlikely to be negligible at the centre of a massive cluster. We therefore consider this uniformly heavy IMF interpretation implausible on balance, and explore alternative scenarios in the following sections.
4.2 Stellar M/L gradients?
Generically, the presence of the counter-image implies that the mass profile is at least as steep as the luminosity profile, on small scales. This cannot be achieved by altering the distribution of dark matter, as long as this component is flatter than the stellar profile, as expected. However, variations in the stellar mass-to-light ratio , as a function of radius, could provide a way to steepen the mass profile sufficiently to produce the radial arc without requiring an excessively heavy IMF throughout the galaxy.
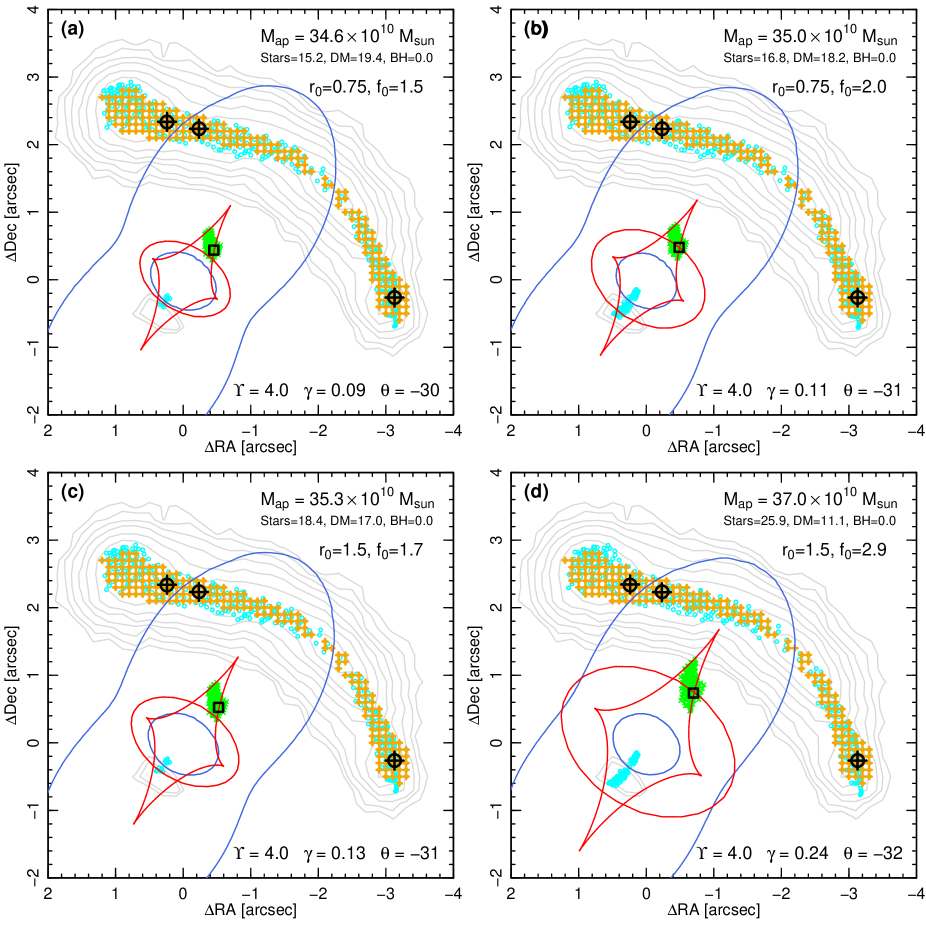
We test this scenario by modulating the lensing convergence generated by the stars, with a linear function of slope between the galaxy centre and some threshold radius, . The mass-to-light ratio is unchanged beyond . To have the desired effect, must be smaller than the radius probed by the main arc. We limit our exploration to cases with =1.5 arcsec or =0.75 arcsec, and tune the dark-matter content in each model to retain = 4.0 in the outer (unaffected) region, compatible with a MW-like IMF.
Fig. 5 illustrates several representative models with gradients. For each value of , we show the case corresponding to the minimum gradient necessary to produce a radial arc (Panels a,c), and for a larger value illustrating the effect of increasing , with and held fixed (Panels b,d). The main result of these tests is that a radial arc counter-image is formed if increases by a factor of 1.5–1.7 towards the galaxy centre, depending only slightly on . These cases effectively add (1–4)1010 M⊙ at small radius, relative to an assumption of constant = 4.0. At this threshold, the radial arc is similar to that in the case of the uniformly heavy IMF model, forming compact pair of images close to the critical line, and somewhat offset from the observed counter-image location, with a flux ratio comparable to the 1:200 observed. For steeper gradients, a larger part of the source falls inside the quadruply-imaged region, and the radial arc brightens and becomes more extended, to a length of 0.5 arcsec or more, in contrast to the compact observed HST morphology.
The 60 per cent variation required in is larger than the 10 per cent attributable to typical age and metallicity gradients in massive ellipticals and BCGs (Kuntschner et al., 2010; Oliva-Altamirano et al., 2015). Hence this model appears to require radial gradients in the IMF; for example a factor of 1.55 in corresponds to the difference between a Kroupa (2001) and an extrapolated Salpeter (1955) IMF. In summary, a model with spatial variation in the IMF directly alters the slope of the lensing potential, and consequently produces radial-arc counter-image without requiring such extreme variation away from the MW IMF as in the spatially uniform scenario.
4.3 A very massive central black hole?
An alternative route to steepening the inner mass profile, without invoking a non-standard IMF at all, is to include contributions from a central super-massive black hole.
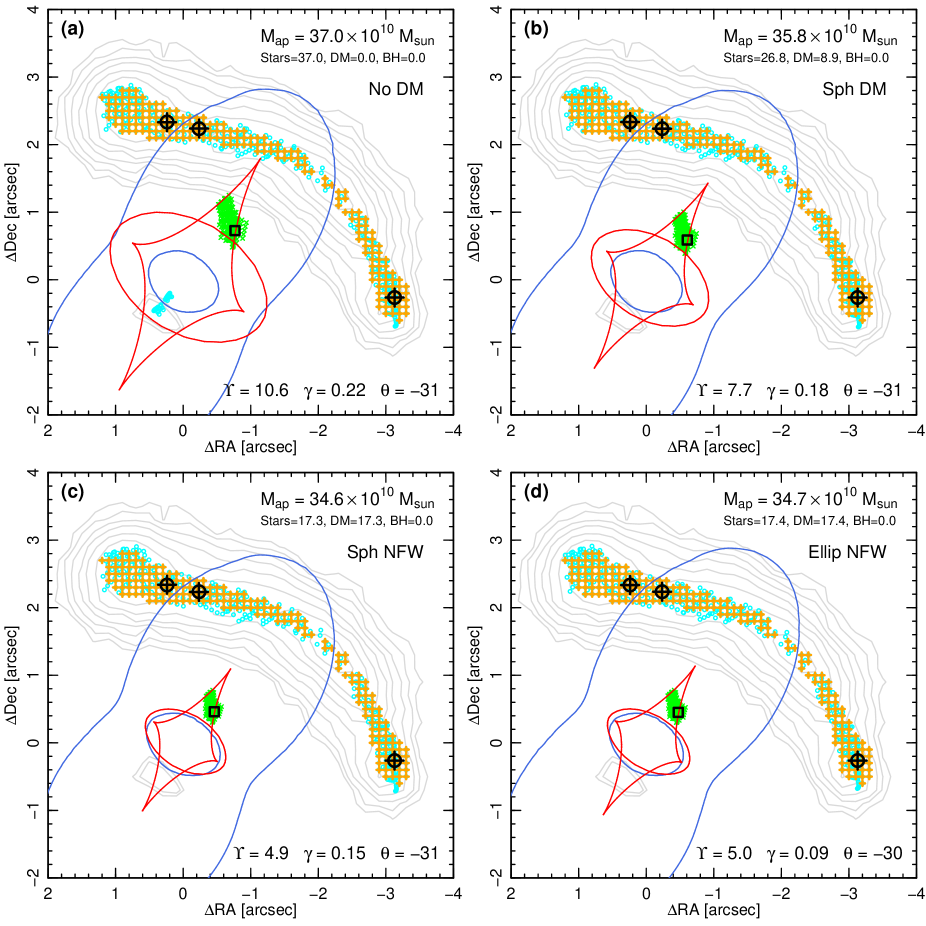
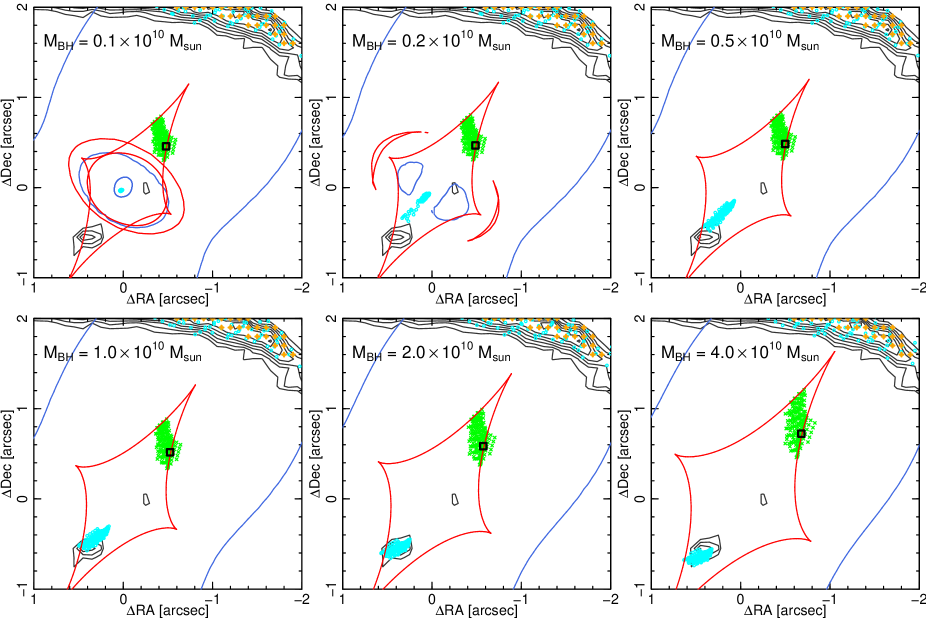
The presence of a central point mass can qualitatively alter the structure of caustics and critical lines in a lensing system, as described in detail by Mao et al. (2001). For the purposes of this paper, the relevant aspect is that above a critical black hole mass (a few per cent of the total mass inside the critical curve), the usual radial caustic can be destroyed, and all source-plane positions inside the tangential caustic become quadruply imaged. Hence the observability and location of a counter-image, for a source located in an “otherwise-naked cusp”, can become sensitive to the presence and mass of a central black hole. We illustrate this situation, as it applies specifically to Abell 1201, in Fig. 6 (see fig. 3 of Mao et al. for a more general description). Here, as before, the model is constrained using only the three sister-images identified on the main arc (A1b, A1c, A1f), and the stellar mass-to-light ratio () and shear () are re-fit in each panel, assuming a fixed black hole mass which increases from panel to panel. For relatively small values of the black-hole mass, 0.31010 M⊙, the caustic structure is complex, and a highly demagnified image is produced at extremely small separation ( 0.1 arcsec) from the lens centre. For more massive black holes ( 0.51010 M⊙), there is only a single caustic, and the fourth image begins to extend away from the lens centre. As increases further, the counter-image becomes brighter and more compact, and moves to larger separation, reaching the observed position for (1–2)1010 M⊙. For the same mass, the flux ratio between main arc and counter-image is 1:100.
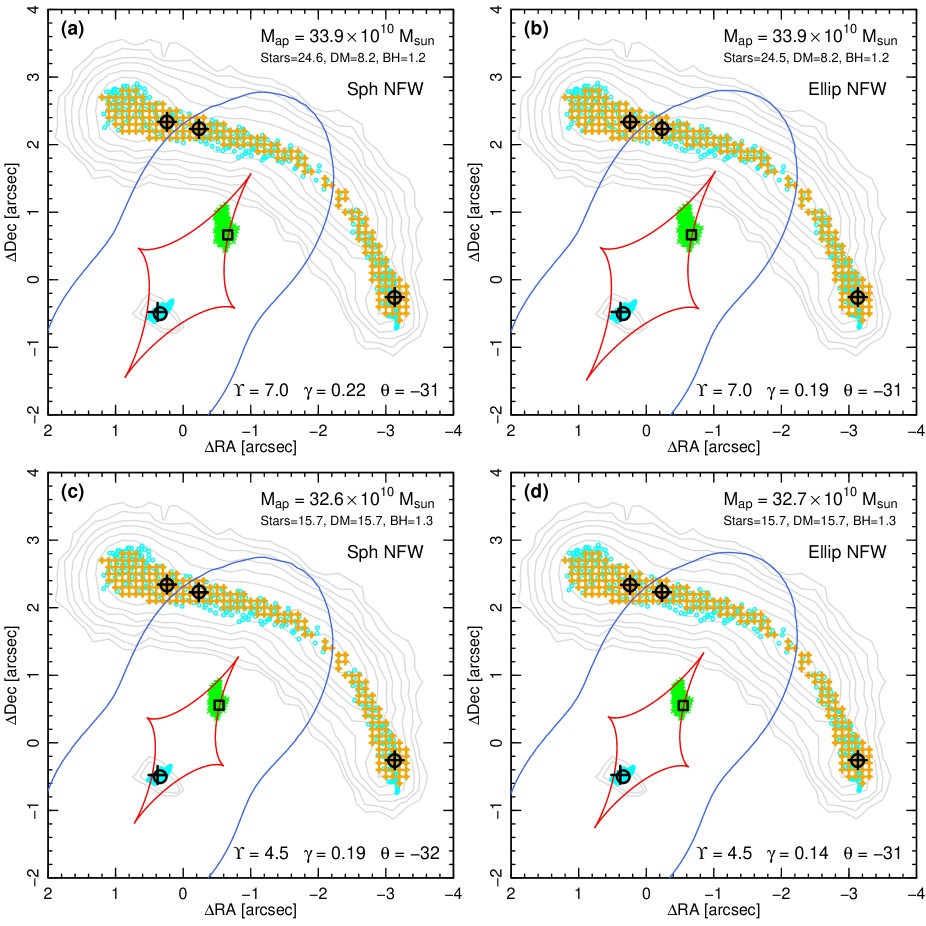
In the black hole model (unlike the -gradient case), all multiply-imaged parts of the source are quadruply imaged, so the unresolved inner image can be assumed to be a sister image to points A1b/c/f. To incorporate the counter-image consistently into our modelling, we add it as a fourth positional constraint, C = , and refit for four model parameters, including the black-hole mass (). As before, the fit does not distinguish between dark matter and stellar mass, so we test the results using different fixed assumptions for the halo shape and mass contribution. Four illustrative cases are shown in Fig. 7. For each form assumed for the halo, we find that the presence and position of the counter-image are reproduced for black-hole masses of (1.2–1.3)1010 M⊙. Adopting the flattened-halo case with 50 per cent halo contribution (Fig. 7d) as our default solution, and using Monte Carlo simulations as before to propagate positional errors, we obtain a mass of = 1010 M⊙. In this model, the stellar mass-to-light ratio is = 4.50.3, consistent with a Milky-Way-like IMF. Reducing the dark-matter fraction leads to slightly more stellar mass in the galaxy centre, and hence less mass is allocated to the black hole. This is a small effect, however: halving the dark-matter content reduces the derived by only 10 per cent (Fig. 7b). Finally, we note that in these models the total mass projected within 4.75 kpc is = (332) 1010 M⊙, including contribution from the black hole itself (4 per cent of the total). The aperture mass is consistent with that derived for the models with stars and DM only.
5 Discussion
We have proposed three possible interpretations for the newly-discovered counter-image to the Abell 1201 arc: (a) a very heavy IMF throughout the BCG, (b) a steep increase in the stellar mass-to-light ratio towards the galaxy centre, or (c) a very massive central black hole. In this section, we assess the plausibility of each scenario with reference to evidence from other studies, and discuss possible routes to distinguishing observationally between the possibilities.
Scenarios (a) and (b) both require variations in the stellar IMF away from the form pertaining apparently almost universally within the Milky Way (Bastian, Covey & Meyer, 2010). The evidence for heavier555Either bottom-heavy with an excess of dwarf stars, or top-heavy with an excess of remnants, relative to the Milky Way case. Both lead to larger stellar mass-to-light ratios. IMFs in massive galaxies has been discussed widely in recent years. From dynamical modelling of nearby early-type galaxies, Cappellari et al. (2013) found a trend of increasing IMF mass factor, from MW-like ( 1) at = 100 km s-1 to Salpeter-like ( 1.6) at = 300 km s-1. Treu et al. (2010) combined stellar dynamics with strong lensing for the SLACS (Sloan Lensing Advanced Camera for Surveys) lens sample, and derived larger mass excesses, 2, for the most massive galaxies ( ≳ 300 km s-1), under the assumption of universal NFW haloes. Conversely, for a sample of three very nearby strong-lensing ellipticals with ≳ 300 km s-1 (subject to smaller corrections for dark matter), Smith et al. (2015) found 1, from a pure lensing analysis, i.e. with no dynamical inputs. Independently, the strength of gravity-sensitive features in the spectra of massive galaxies suggests they harbour an excess of dwarf stars compared to a MW-like IMF, leading to higher mass-to-light ratios, e.g. = 1.5–2.0 from Conroy & van Dokkum (2012b). However, direct comparisons of these results to measurements are hampered by the unknown detailed shape of the IMF at very low mass (Lyubenova et al., 2016).
The mass excess factor of = 2.4–3.0 (relative to the Kroupa IMF), required by our spatially-uniform IMF model for the Abell 1201 counter-image, is substantially larger than the factors discussed in the recent literature. Moreover, this scenario would imply that dark matter contributes negligibly within the aperture probed by the main arc, contrary to theoretical expectation. For example, extracting average profiles of massive galaxies ( M⊙, 250 km s-1) from the EAGLE666Evolution and Assembly of GaLaxies and their Environments. simulation (Schaye et al., 2015), we find a typical dark-matter mass of 101010 M⊙ projected within 4.75 kpc, i.e. about a third of the total lensing mass. In rich clusters (which are not well represented in the simulation dataset) the DM fraction may well be larger. Alternatively, integrating an NFW halo with = 5, = 3.91014 M⊙ and = 1.5 Mpc (Neto et al., 2007; Rines et al., 2013), yields 201010 M⊙ projected within 4.75 kpc (two thirds of the lensing mass). On balance, we consider scenario (a) to be the least plausible of the three interpretations.
Scenario (b), invokes an internal gradient in the stellar mass-to-light ratio , spanning a factor of 1.6 between the BCG centre and a radius of 1.5 arcsec. The typical change in [Z/H] over this radial interval in nearby ellipticals is 0.2 dex (Kuntschner et al., 2010), which would yield a 10 per cent effect in , according to the Maraston (2005) models, while the age profiles are generally flat. Oliva-Altamirano et al. (2015) report even shallower metallicity gradients for a sample of BCGs777The Abell 1201 BCG itself does not seem to have unusual radial trends compared to these larger samples. Fitting SSP model spectra from Conroy & van Dokkum (2012a) to spectra extracted from annuli in the MUSE datacube, assuming common age in all bins, we find very weak metallicity gradients in the inner 2 arcsec. Allowing age to vary, we tentatively find an increase of towards the galaxy centre, but only by 25 per cent.. Hence, radial variation in the IMF is probably required to generate the necessary gradient.
The IMF gradient scenario requires only a fairly modest deviation from the standard MW form (at least as compared to what is needed for the uniformly-heavy IMF proposal). Even in the galaxy centre, the mass excess factor can be as small as 1.6, which is similar to a Salpeter IMF, and more consistent with the results obtained from other methods, e.g. gravity-sensitive spectral features. The possibility of IMF gradients has been advanced as a potential explanation for discrepancies between spectroscopic analyses (often limited to the innermost parts of galaxies, 0.1 ) and dynamical measurements ( 1 ) (Smith, 2014). Several recent studies have attempted to measure internal gradients in the IMF from spectral features. For two massive galaxies, Martín-Navarro et al. (2015) and La Barbera et al. (2016) report steep radial trends in the derived IMF slope within 0.5 ; for their preferred description of the behaviour at very low stellar masses, the variation corresponds to a factor of 1.5–2.0 in . Similar results have been reported very recently for six galaxies by van Dokkum et al. (2016). Other studies, however, have argued that while steep gradients in some spectral features are indeed present, the pattern of trends (especially the weakness or absence of gradient in the Fe H Wing–Ford band) is more consistent with abundance variation than with IMF trends (McConnell, Lu & Mann, 2016; Alton, Smith & Lucey, 2017). For the Abell 1201 BCG itself, the classic IMF indicators (e.g. the Na i 8200 Å doublet) are redshifted out of the MUSE spectral range, so we cannot make a direct comparison between methods at this stage. Meanwhile, Davis & McDermid (2016) have analysed the dynamics of molecular gas disks in seven early-type galaxies, finding no clear cases of a central rise in (though selection by presence of molecular gas inevitably biases the sample away from old, very massive ellipticals). Hence, while there is not yet a secure consensus regarding gradients in the IMF, the magnitude of the trend required by our lensing models of the Abell 1201 BCG is within the range being discussed in the literature, and we conclude that scenario (b) is not inconsistent with external evidence.
Finally, scenario (c) can account for the counter-image without any modifications to the IMF, by introducing a very massive central super-massive black hole. Empirically, black hole masses correlate most strongly with the velocity dispersion (Beifiori et al., 2012), with the largest reported masses from dynamical studies being (1–2)1010 M⊙, e.g. in the BCGs NGC 3842 and NGC 4889 (McConnell et al., 2011) and in the field elliptical NGC 1600 (Thomas et al., 2016). To place the putative Abell 1201 black hole on the scaling relations established from more traditional methods, we use ppxf (Cappellari & Emsellem, 2004) to measure , the velocity dispersion within the effective radius of = 5 arcsec, from the MUSE datacube, finding = 2901 km s-1. This is substantially larger than the values reported by Sand et al. (2004), who measured = 230–250 km s-1 within 1.5 arcsec. The discrepancy is due partly to a real mismatch888 Newman et al. (2013a) reported similar disagreements with the Sand et al. measurements for several other clusters, and concluded that the earlier data were compromised by poor stellar templates and measurement procedures (see their section 6.4). in the inner regions (where we measure 270 km s-1 from MUSE, and SDSS reports 27714 km s-1), and partly to a rising velocity dispersion profile beyond 2 arcsec.
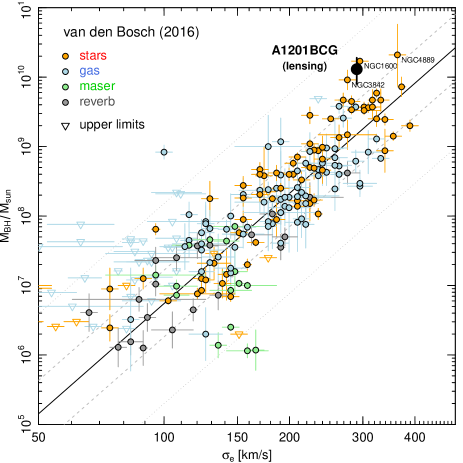
Fig. 8 shows our estimate for Abell 1201 BCG in comparison to the – relation derived by van den Bosch (2016) from a compilation of published masses. The predicted mean black-hole mass at = 290 km s-1 is 1.5109 M⊙, an order of magnitude smaller than the lensing-derived value. Given the large scatter around the relationship, the Abell 1201 BCG is a 2 outlier, comparable to NGC 3842 or NGC 1600. The possibility of a BH mass offset in BCGs has been discussed in the context of AGN feedback in cluster environments. Hlavacek-Larrondo et al. (2012) argue that the radio/X-ray properties of BCG nuclei in cool-core clusters are inconsistent with the “fundamental plane” of nuclear accretion activity (Merloni, Heinz & di Matteo, 2003), if their BH masses follow the local scaling relations. The discrepancy can be resolved if is under-predicted by the correlations with or luminosity, by an order of magnitude. The direct evidence for such over-massive BHs in BCGs remains sparse, given the small number of such galaxies having dynamical mass estimates; our measurement for Abell 1201, if confirmed, would add anecdotal support for this picture.
Which model is favoured, given these external considerations? At a qualitative level, the existence of central super-massive black holes is established beyond reasonable doubt, and the presence of 1010 M⊙ objects in some of the most massive galaxies is supported by other studies. The reality of IMF variations in such galaxies is not yet, in our view, confirmed to the same degree of confidence. However the level of variation required, if applied as a gradient within the BCG, is fairly modest, with a Salpeter-like IMF in the centre sufficient to match the observed configuration. Weighing the arguments above, we mildly favour scenario (c) (a massive black hole) over scenario (b) (an internal IMF gradient), and strongly disfavour only scenario (a) (a heavy IMF throughout).
6 Observational outlook
We now discuss possible observational tests to discriminate better between the two remaining explanations for the counter-image.
From a purely lensing perspective, deeper and better-sampled HST imaging will help by revealing the morphology of the counter-image, which cannot be adequately established from the present very shallow WFPC2 data. If the counter-image is a true radial arc (i.e. formed by a an extended source crossing the radial caustic), then we expect in general to observe a more radially-extended image, or an image pair around the corresponding critical line. As shown in Figure 5, the length of the arc in this case carries information about the slope of the IMF gradient. Time has been allocated for future observations with WFC3 (Wide Field Camera 3) in two bandpasses, with one bluewards of the BCG 4000 Å break, to maximise contrast of the arc against the lens. These two-colour HST observations will also provide a link which helps understand the differences between the continuum flux (at high spatial resolution) and the emission-line structure of the main arc (only available at ground-based resolution).
A possible route to excluding the black hole scenario is that in this model the whole of the source is quadruply imaged, while in the other options the counter-image is formed from only a small part of the background galaxy. Hence by measuring properties with spatial structure within the background galaxy, it might be possible to “tag” the counter-image to a particular region in the source, if scenario (b) is correct. Radial velocity would be the most obvious tagging parameter, and naively the elliptical distribution of the main-arc pixels, when mapped to the source plane, suggests that the radial arc should correspond to an extreme of the rotation curve. If so, a velocity offset of the counter-image, relative to the mean velocity for the main arc, would decisively favour the radial arc interpretation. In practice, however, the observed velocity structure in the arc seems to indicate a velocity gradient orthogonal to the expected direction999 Using pixelised source reconstruction methods on the forthcoming WFC3 data will help to establish the origin of this velocity gradient, e.g. a merger or other peculiarity. (Fig. 9), so that no large velocity offset is predicted for the counter-image. At higher spatial resolution, e.g. IFU with adaptive optics (AO), the internal velocity structure of the counter-image might be able to distinguish a reduced image of the complete source versus a small section, but the small velocity width and faintness of the image will make this very challenging. Alternatively other possible spatially-varying “tags”, such as emission line ratios or equivalent widths, could be explored, either with AO-assisted IFU data or with HST narrow-band imaging.
Independent of the information available from lensing, analysing the spatially-resolved stellar kinematics will help to establish the mass contribution of dark matter, through its increasing importance at large radii. Moreover, despite the large distance of the Abell 1201 BCG compared to the other galaxies in Fig. 8, a 1010 M⊙ black hole would have measurable effects on the kinematics at small radius, even in natural-seeing observations. An analysis of the kinematic data from our current MUSE observations will be presented in a forthcoming paper. Future AO-assisted IFU observations could provide an unambiguous dynamical confirmation of the black hole, if it is really as massive as required by our scenario (c).
7 Conclusions
We have presented new deep IFU observations of the lensing BCG of Abell 1201, revealing a faint inner counter-image to the previously-known bright arc. Our lens modelling shows that if the lensing mass is dominated by a reasonable combination of stars (with constant mass-to-light ratio) and halo dark matter, then the bright arc arises from a “naked cusp”, and no counter-image is predicted. To accound for the newly-discovered image, we find that additional mass is required at the centre of the BCG, relative to the observed luminosity profile.
If the central mass distribution is dominated by stars and dark matter, then the counter image must be interpreted as a radial arc. This would require either:
-
•
A negligible dark-matter contribution at the centre of this massive cluster, and hence a high stellar mass-to-light ratio. This would require a very heavy IMF, with a mass-excess factor of 2.4 (relative to a MW-like IMF), which is larger than the typical factors of 1.6 obtained from lensing, dynamical and spectroscopic studies of giant ellipticals (Treu et al., 2010; Conroy & van Dokkum, 2012b; Cappellari et al., 2013). Or:
-
•
A steep gradient in the stellar mass-to-light ratio within the radius of the main arc, increasing towards the BCG centre. Such a gradient could be generated by a radial trend in the IMF; in this case only modest variations away from the MW form are necessary (reach 1.6 at the centre), in line with some estimates from spectroscopy (La Barbera et al., 2016; Martín-Navarro et al., 2015).
Alternatively, if the stellar populations conform to a standard MW-like IMF throughout the BCG, then the observed counter-image can be reproduced by a third scenario:
-
•
A 1.31010 M⊙ central black hole, comparable to the most massive black holes measured from stellar dynamical modelling, and an order of magnitude larger than the prediction from the – scaling relation.
The black hole model and the IMF variation models make differing predictions for the morphology of the counter-image. Hence, improved high-contrast and high-resolution observations may be able to distinguish between the competing interpretations. In a forthcoming paper, we will present measurement for the extended stellar kinematics of the Abell 1201 BCG, to derive independent constraints on the stellar, dark-matter and black-hole mass components, from dynamical modelling.
Acknowledgements
RJS acknowledges support from the STFC through grant ST/L00075X/1. We thank Mark Swinbank for helpful conversations about MUSE data reduction and previous observations of Abell 1201, and Tom Collett for discussions about the lensing analysis. The datasets used in this paper are available from the HST and ESO data archives.
References
- Aihara et al. (2011) Aihara H., et al., 2011, ApJS, 193, 29
- Alton et al. (2017) Alton P. D., Smith R. J., Lucey J. R., 2017, MNRAS, submitted
- Bacon et al. (2010) Bacon R., et al., 2010, in Ground-based and Airborne Instrumentation for Astronomy III. p. 773508, doi:10.1117/12.856027
- Bastian et al. (2010) Bastian N., Covey K. R., Meyer M. R., 2010, ARA&A, 48, 339
- Beifiori et al. (2012) Beifiori A., Courteau S., Corsini E. M., Zhu Y., 2012, MNRAS, 419, 2497
- Blumenthal et al. (1986) Blumenthal G. R., Faber S. M., Flores R., Primack J. R., 1986, ApJ, 301, 27
- Cappellari & Emsellem (2004) Cappellari M., Emsellem E., 2004, PASP, 116, 138
- Cappellari et al. (2012) Cappellari M., et al., 2012, Nature, 484, 485
- Cappellari et al. (2013) Cappellari M., et al., 2013, MNRAS, 432, 1862
- Chabrier et al. (2014) Chabrier G., Hennebelle P., Charlot S., 2014, ApJ, 796, 75
- Conroy & van Dokkum (2012a) Conroy C., van Dokkum P., 2012a, ApJ, 747, 69
- Conroy & van Dokkum (2012b) Conroy C., van Dokkum P. G., 2012b, ApJ, 760, 71
- Davis & McDermid (2016) Davis T. A., McDermid R. M., 2016, MNRAS,
- Edge et al. (2003) Edge A. C., Smith G. P., Sand D. J., Treu T., Ebeling H., Allen S. W., van Dokkum P. G., 2003, ApJ, 599, L69
- Hlavacek-Larrondo et al. (2012) Hlavacek-Larrondo J., Fabian A. C., Edge A. C., Hogan M. T., 2012, MNRAS, 424, 224
- Jarrett et al. (2000) Jarrett T. H., Chester T., Cutri R., Schneider S., Skrutskie M., Huchra J. P., 2000, AJ, 119, 2498
- Keeton (2001) Keeton C. R., 2001, preprint, (arXiv:0102340)
- Kneib et al. (2003) Kneib J.-P., et al., 2003, ApJ, 598, 804
- Kroupa (2001) Kroupa P., 2001, MNRAS, 322, 231
- Kuntschner et al. (2010) Kuntschner H., et al., 2010, MNRAS, 408, 97
- La Barbera et al. (2016) La Barbera F., Vazdekis A., Ferreras I., Pasquali A., Cappellari M., Martín-Navarro I., Schönebeck F., Falcón-Barroso J., 2016, MNRAS, 457, 1468
- Lauer et al. (1995) Lauer T. R., et al., 1995, AJ, 110, 2622
- Lauer et al. (2007) Lauer T. R., et al., 2007, ApJ, 662, 808
- Lyubenova et al. (2016) Lyubenova M., et al., 2016, MNRAS, 463, 3220
- Ma et al. (2012) Ma C.-J., Owers M., Nulsen P. E. J., McNamara B. R., Murray S. S., Couch W. J., 2012, ApJ, 752, 139
- Mao et al. (2001) Mao S., Witt H. J., Koopmans L. V. E., 2001, MNRAS, 323, 301
- Maraston (2005) Maraston C., 2005, MNRAS, 362, 799
- Martín-Navarro et al. (2015) Martín-Navarro I., Barbera F. L., Vazdekis A., Falcón-Barroso J., Ferreras I., 2015, MNRAS, 447, 1033
- McConnell et al. (2011) McConnell N. J., Ma C.-P., Gebhardt K., Wright S. A., Murphy J. D., Lauer T. R., Graham J. R., Richstone D. O., 2011, Nature, 480, 215
- McConnell et al. (2016) McConnell N. J., Lu J. R., Mann A. W., 2016, ApJ, 821, 39
- Merloni et al. (2003) Merloni A., Heinz S., di Matteo T., 2003, MNRAS, 345, 1057
- Navarro et al. (1995) Navarro J. F., Frenk C. S., White S. D. M., 1995, MNRAS, 275, 720
- Navarro et al. (1996) Navarro J. F., Frenk C. S., White S. D. M., 1996, ApJ, 462, 563
- Neto et al. (2007) Neto A. F., et al., 2007, MNRAS, 381, 1450
- Newman et al. (2013a) Newman A. B., Treu T., Ellis R. S., Sand D. J., Nipoti C., Richard J., Jullo E., 2013a, ApJ, 765, 24
- Newman et al. (2013b) Newman A. B., Treu T., Ellis R. S., Sand D. J., 2013b, ApJ, 765, 25
- Oliva-Altamirano et al. (2015) Oliva-Altamirano P., et al., 2015, MNRAS, 449, 3347
- Owers et al. (2009) Owers M. S., Nulsen P. E. J., Couch W. J., Markevitch M., Poole G. B., 2009, ApJ, 692, 702
- Planck Collaboration et al. (2016) Planck Collaboration et al., 2016, A&A, 594, A13
- Rines et al. (2013) Rines K., Geller M. J., Diaferio A., Kurtz M. J., 2013, ApJ, 767, 15
- Salpeter (1955) Salpeter E. E., 1955, ApJ, 121, 161
- Sand et al. (2004) Sand D. J., Treu T., Smith G. P., Ellis R. S., 2004, ApJ, 604, 88
- Schaye et al. (2015) Schaye J., et al., 2015, MNRAS, 446, 521
- Schmidt & Allen (2007) Schmidt R. W., Allen S. W., 2007, MNRAS, 379, 209
- Smith (2014) Smith R. J., 2014, MNRAS, 443, L69
- Smith et al. (2015) Smith R. J., Lucey J. R., Conroy C., 2015, MNRAS, 449, 3441
- Spergel & Steinhardt (2000) Spergel D. N., Steinhardt P. J., 2000, Physical Review Letters, 84, 3760
- Swinbank (2003) Swinbank A., 2003, PhD Thesis, University of Durham
- Thomas et al. (2016) Thomas J., Ma C.-P., McConnell N. J., Greene J. E., Blakeslee J. P., Janish R., 2016, Nature, 532, 340
- Treu et al. (2010) Treu T., Auger M. W., Koopmans L. V. E., Gavazzi R., Marshall P. J., Bolton A. S., 2010, ApJ, 709, 1195
- van Dokkum et al. (2016) van Dokkum P., Conroy C., Villaume A., Brodie J., Romanowsky A., 2016, preprint, (arXiv:1611.09859)
- van den Bosch (2016) van den Bosch R. C. E., 2016, ApJ, 831, 134