ZOMG II: Does the halo assembly history influence central galaxies and gas accretion?
Abstract
The growth-rate and the internal dynamics of galaxy-sized dark-matter haloes depend on their location within the cosmic web. Haloes that sit at the nodes grow in mass till the present time and are dominated by radial orbits. Conversely, haloes embedded in prominent filaments do not change much in size and are dominated by tangential orbits. Using zoom hydrodynamical simulations including star formation and feedback, we study how gas accretes onto these different classes of objects that, for simplicity, we dub ‘accreting’ and ‘stalled’ haloes. We find that all haloes get a fresh supply of newly accreted gas in their inner regions, although this slowly decreases with time, in particular for the stalled haloes. The inflow of new gas is always higher than (but comparable with) that of recycled material. Overall, the cold-gas fraction increases (decreases) with time for the accreting (stalled) haloes. In all cases, a stellar disc and a bulge form at the centre of the simulated haloes. The total stellar mass is in excellent agreement with expectations based on the abundance-matching technique. Many properties of the central galaxies do not seem to correlate with the large-scale environment in which the haloes reside. However, there are two notable exceptions that characterise stalled haloes with respect to their accreting counterparts: i) the galaxy disc contains much older stellar populations; ii) its vertical scale-height is larger by a factor of two or more. This thickening is likely due to the heating of the long-lived discs by mergers and close flybys.
keywords:
cosmology: dark matter – galaxies: evolution, formation, haloes – methods: numerical1 Introduction
Within the standard CDM scenario, dark-matter (hereafter, DM) haloes form in a hierarchical fashion. Matter falls onto them in two distinct ways: via smooth accretion and by mergers. Baryons initially follow the path dictated by the DM. However, they can radiate their binding energy away and collapse into the central high-density regions thus forming stars and subsequently galaxies (White & Rees, 1978). In this framework, the properties of galaxies are determined by the mass and formation history of the DM haloes within which they form (e.g. White & Frenk, 1991; Somerville & Primack, 1999; Cole et al., 2000). Semi-analytic models of galaxy formation are based on this concept (e.g. Bower et al., 2006; Somerville et al., 2008; Guo et al., 2011; Benson, 2012; Henriques et al., 2015) which is also naturally included in hydrodynamical numerical simulations.
From the observational point of view, a galaxy-halo connection can only be established at the statistical level. A commonly used approach is the ‘abundance matching’ technique, which is based on the hypothesis that galaxy properties depend only on the mass of the host halo (e.g. Kravtsov et al., 2004; Vale & Ostriker, 2004; Conroy & Wechsler, 2009; Moster et al., 2013; Behroozi et al., 2013a, b; Reddick et al., 2013). This approach is routinely used to infer the halo masses of galaxy populations and inform models of galaxy formation (Mandelbaum et al., 2006), as well as to constrain cosmological parameters from measurements of the large scale structure (e.g., Tinker et al., 2005; Cacciato et al., 2009, 2013; More et al., 2013; Villaescusa-Navarro et al., 2014)
It has been shown that the clustering of haloes at fixed mass depends on their formation history, the so-called halo assembly bias (Sheth & Tormen, 2004; Gao et al., 2005; Li et al., 2008; Dalal et al., 2008). Internal properties (e.g., halo concentration) also correlate with halo age (Wechsler et al., 2006).
In order to explain the origin of this phenomenon, Borzyszkowski et al. (2016, heareafter paper I) divided present-day galaxy-sized haloes into two classes based on their mass-accretion history: those that are still growing in size (accreting) and those that are not (stalled). Paper I showed that accreting and stalled haloes populate different environments of the cosmic web. Namely, stalled haloes reside within prominent filaments (thicker than their sizes), while accreting haloes at the nodes where thinner filaments converge. In addition, the internal dynamics reflects the different accretion modes, i.e., the velocity anisotropy profile is biased towards radial (tangential) orbits in accreting (stalled) haloes.
If galaxy characteristics correlate with other halo properties than the mass, then the existence of assembly bias would imply that the abundance-matching method is inadequate. Observations (Weinmann et al., 2006; Kauffmann et al., 2013; Knobel et al., 2015) and numerical simulations (Chaves-Montero et al., 2016; Bray et al., 2016) provide evidence for such a galaxy-halo correspondence. For instance, neighbouring galaxies tend to have similar colours, gas fractions and morphologies up to separations of several Mpc, a phenomenon known as ‘galactic conformity’. These effects alter observables (i.e. two-point correlations) at the 10-20 per cent level. Therefore, it is imperative to address them before the advent of the next-generation wide-field galaxy surveys (e.g. eBoss, DESI, Euclid, and LSST) which will produce extremely accurate measurements. Attempts to extend the abundance-matching technique have been proposed using either age-matching (Hearin & Watson, 2013), or a secondary halo property beyond mass (Hearin et al., 2016). In parallel with this phenomenological approach, to make progress, it is necessary to shed new light on the connection between galaxies and their host halos from the theoretical point of view.
This article is the second in a series of three presenting a numerical project named ‘Zooming On a Mob of Galaxies’ (ZOMG). The goal of the ZOMG simulations is to investigate environmental effects on the formation of present-day galaxies, their host haloes and satellites. In paper I we uncovered the physical origin of halo assembly bias. In particular we used zoomed-in simulations of stalled and accreting haloes to study their assembly history and structural properties. In this paper we consider a sub-set of the Dark-ZOMG (DM-only) runs and resimulate them adding the baryonic component, including star formation, cooling and feedback. Our aim is to characterise gas accretion and the properties of the central galaxy in haloes with different formation histories. In paper III (Garaldi et al., 2016) we address the connection with the satellite galaxy population.
From the theoretical point of view, gas inflow in haloes with masses of has been shown to be bimodal, the so-called cold and hot accretion (Birnboim & Dekel, 2003; Kereš et al., 2005; Dekel & Birnboim, 2006; Kereš et al., 2009). Haloes below this threshold are not massive enough to support shocks. In this case, cold gas reaches the halo centre along filaments, feeding directly the main galaxy. On the other hand, in more massive hosts the gas is shock heated to (and above) the virial temperature of the halo. The gas smoothly fills the halo until it cools down and rains into the galaxy, thus sustaining its star-formation rate. Cold accretion dominates at high redshifts () while the hot mode becomes more efficient at later epochs (Kereš et al., 2005).
A natural question that raises at this point is: how is the gas accretion scenario coupled with the stagnation or growth of the underlying DM haloes? Moreover, how does the halo assembly history affect the formation and evolution of the central galaxies? Given that stalled haloes do not grow in mass since long (10 Gyr), should one expect them to host red and passive galaxies by the present time? More generally, is there a galaxy property that correlates with halo formation time and generates galaxy assembly bias? In this paper we address these issues. For this purpose we select and re-simulate two acccreting and two stalled haloes from the Dark-ZOMG suite. We study gas accretion at different physical radii ranging from distances well beyond the halo radius all the way down to the central galaxy. Results are contrasted with the inflow rate of dark matter at the same locations. We investigate the morphological structure of the central galaxies in terms of their stellar density profile (both radial and vertical) and kinematic decomposition.
The outline for this paper is as follows. In Section 2 we describe our numerical simulation setup, the identification of haloes and galaxies, define their formation times, and the construction of their merger trees. In Section 3 we present our main results. In Section 3.1 we study the mass accretion rates for both DM and gas. The analysis of the central galaxies is presented in Section 3.2, their comparison with observations in Section 3.3 and their morphological characterisation in Section 3.4. A non-parametric analysis of their stellar distributions is shown in Section 3.5. Finally, we present our conclusions in Section 4.
2 Numerical Simulations and methodology
We have made use of the ZOMG simulations presented in paper I. This simulation-set follows the evolution of seven zoomed-in DM haloes that have been chosen according to their collapse time. In the present paper we are interested in studying how the halo gas content is affected by the difference in their formation time, and in turn, how this affects the evolution of the central galaxies. For these purposes, we have extended part of such simulation suite as to include baryons in four of those haloes. We have chosen two that have collapsed before and therefore, their respective matter accretion has been ‘stalled’. The other two chosen haloes are still ‘accreting’ matter at the present epoch and have not fully collapsed yet. Following the nomenclature used in paper I, the selected haloes are: Supay, Siris, Amun and Abu, where the initial letter stands for stalled (S) or accreting (A). The S-haloes have the particularity that they are immersed within filaments, while the A-haloes are residing at the knots (intersections) of two or more filaments (see Fig. 9 in paper I).
For a full explanation about the simulation setup and selection of the haloes we refer the reader to paper I. In this section we specify their main characteristics and the inclusion of the baryonic component.
2.1 The code
We have used a modified version of the tree-particle-mesh smoothed particle hydrodynamics (SPH) code PGADGET-3 (Springel, 2005), using the conservative entropy formulation (Springel & Hernquist, 2002). Our implementation includes radiative cooling by H, He, and metals, star formation, stellar feedback, constant-velocity galactic winds, a uniform ultraviolet (UV) background (Haardt & Madau, 2001) and a sub-resolution model for the multiphase interstellar medium, where SPH particles contain both cold and hot phases (Yepes et al., 1997; Springel & Hernquist, 2003). Since our haloes have masses , we do not include AGN feedback which is thought to regulate star formation in more massive objects (see Di Matteo et al., 2005; Sijacki et al., 2007; Fabian, 2012; Ishibashi & Fabian, 2012; Cresci et al., 2015, and references therein). Star formation can only take place in regions where the gas density exceeds the threshold . This is calibrated to reproduce the observed Kennicutt-Schmidt relation (Kennicutt, 1998) at . Each gas particle has an assigned star-formation rate (SFR). However, the actual conversion from gas to stars proceeds stochastically, where each star particle takes half of the initial gas mass (Springel & Hernquist, 2003).
2.2 Setup
The D-ZOMG set presented in paper I follows the evolution of DM haloes with masses around the peak in the expected stellar mass - halo mass relation at the present time (Behroozi et al., 2013b; Moster et al., 2013).
The suite was drawn from a low resolution, collisionless (DM-only) parent simulation. The initial conditions (ICs) were generated with the MUSIC code (Hahn & Abel, 2011). The ICs were imposed on a box size, with a resolution of grid cells per dimension. The cosmology adopted was that of the Planck Collaboration et al. (2014), i.e. , , , . The linear power spectrum was characterised by the spectral index and normalised by the linear rms amplitude of mass fluctuations in spheres of radius, . The simulation was evolved from up to .
The collapse time for all haloes was calculated following Borzyszkowski et al. (2014) (see Section 2.4). Seven haloes with mass and different collapse times were selected for re-simulation at higher resolution. In order to avoid contamination from massive particles in the multi-mass re-simulated haloes, all particles within three virial radii at were selected. These particle distributions were traced back to the ICs. The corresponding comoving volumes were resampled at higher resolution with MUSIC. The global setup includes six nested levels of refinement and periodic boundary conditions. To minimise the computational effort in the zoom-in simulations, a minimal ellipsoid was carved out containing all the particles that by would end up within the three virial radii.
For the present study, we have modified the ICs of our chosen four haloes as to add baryons only at the highest level of refinement. The final effective resolution in the high-resolution region was in both DM and SPH particles, with a gravitational softening of (comoving). The corresponding particles masses are in DM and for gas. Since gas particles could experience up to two episodes of star formation (SF), the resulting stellar masses are .
We imposed a fine time interval of 20 Myr between outputs to perform accurate post-processing analysis of the evolution of the structures. There are in total 682 snapshots for each halo.
2.3 Halo and galaxy identification
Haloes were defined as gravitationally bound objects by means of the Amiga Halo Finder code AHF (Gill et al., 2004; Knollmann & Knebe, 2009). They were initially identified as those spherical regions with mean density equal to , with being the critical density of the universe at a given redshift. After this, an iterative unbinding procedure was applied by removing particles with velocities larger than , where is the escape velocity of the halo. In the case of gas particles, their thermal energy was also taken into consideration. Halo masses and radii ( and , respectively) were computed from the bound distributions. In particular, was defined as the minimum spherical radius containing all the bound particles. Substructures and possible sub-substructures were identified along the same lines (see paper III). Halo quantities such as spin, shape, number of substructures, among others, were computed within these distributions. Note that we followed the same formalism to identify haloes as in paper I, with the only difference that our haloes are composed by DM and baryons (gas and stars). The main physical properties of our halo sample are shown in Table 1. Differences in these quantities from paper I are due to the inclusion of baryons.
It is worth noticing that the definition of a halo depends on the critical matter density of the universe. Such definition can lead to a spurious pseudo-evolution of halo mass and size because of the redshift-dependence of the reference density, even if its physical density profile remains constant over time (Diemer et al., 2013; Diemer & Kravtsov, 2014; Zemp, 2014; Adhikari et al., 2014). As shown in paper I, it is difficult to draw a distinctive boundary between a halo and its environment since the transition is smooth. Adhikari et al. (2014) and More et al. (2015) suggested the ‘splashback’ radius as that region which is not subject to pseudo-evolution. They associated the steepening in the radial density profile of haloes with the apocentre of accreted matter which is on its first orbit. We have included the splashback radius (, hereafter) values at in Table 1 (see paper I for details).
The main galaxy for each halo was defined as the central region containing both gas and stars within a radius (e.g. Scannapieco et al., 2012).
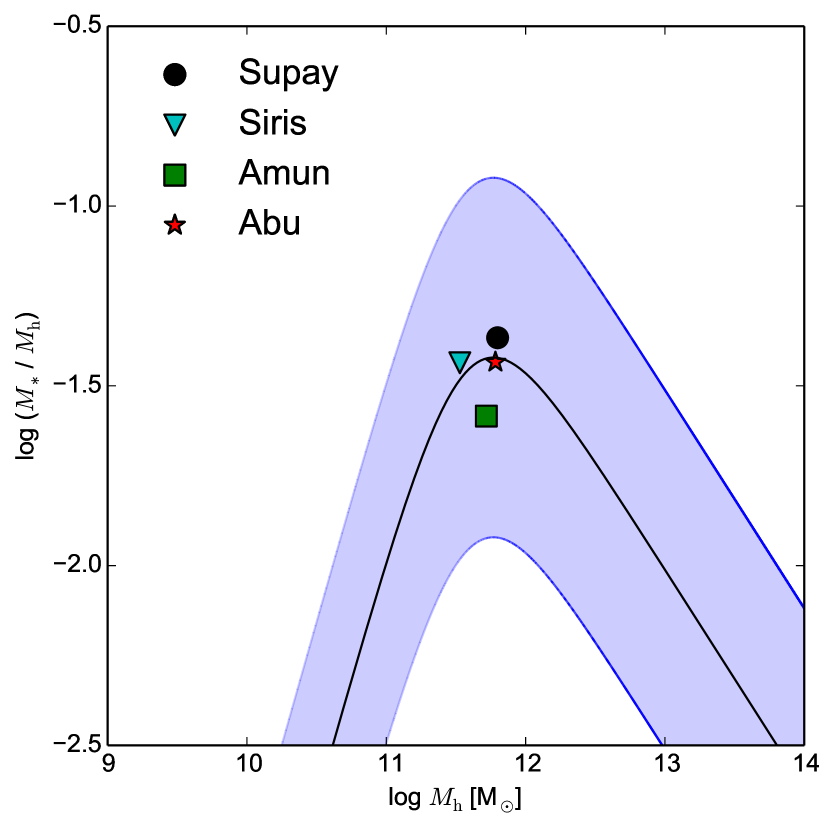
We have checked that our haloes and galaxies are in agreement with the expected relation (Behroozi et al., 2013b; Moster et al., 2013) at . Fig. 1 shows the stellar-mass fractions as a function of halo mass for our simulation set. Notice that all of our galaxies agree very well with the expected trend (black solid line) and with the peak of the distribution.
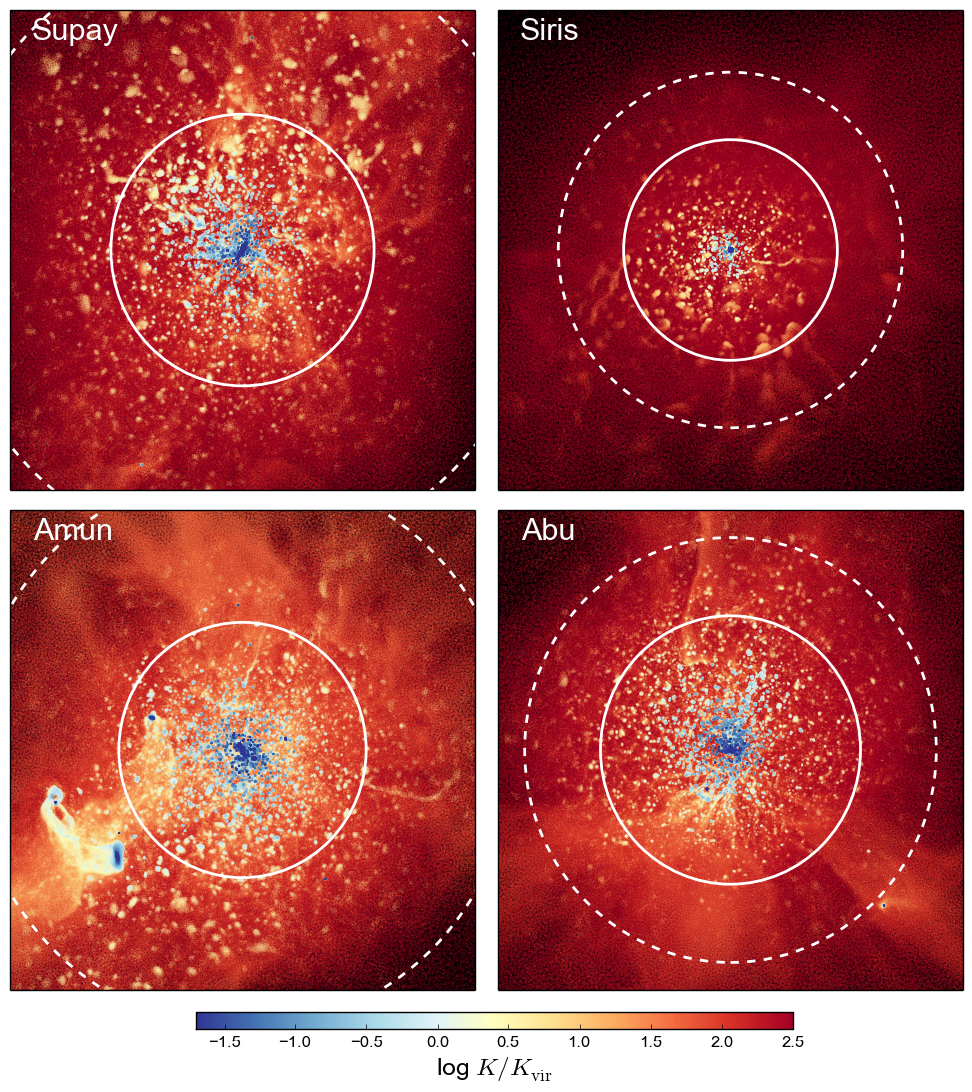
The gas distributions in and around our haloes are illustrated in Fig. 2, where 2D projections are shown at . Each panel refers to a cube with side length of 540 kpc (same as in Fig. 4 of paper I) projected along one of the axes. The solid circles represent the halo radius (), while the dashed ones the splashback radius (). Particles have been colour-coded using their local ‘entropy’ (, see Dekel et al., 2009) in units of the virial temperature and mean density within . The figure highlights the structure and kinematics of the gas distributions. The entropy maps exhibit gas heated by virial shocks indicated by red tones that cover all the surroundings of the stalled haloes, and to a lesser degree the accreting ones. In the case of Siris, this extends even beyond . The A-haloes show some streams of lower entropy (light colours) penetrating into the central parts. They represent cold gas being accreted into the central regions (see Section 3.1.3). The boundaries between streams and the hot intergalactic medium seem to be well defined. The main galaxies (and some substructures) are depicted as regions of very low entropy indicated by the blue tones.
2.4 Formation and collapse times
We computed the mass accretion histories (MAHs) of our haloes, following the main branch of their merger tree. A parent halo was defined as the halo between two neighbouring time outputs that maximises the merit function , where and are the numbers of particles within the halo at time and its progenitor at time , respectively, while is the number of particles shared between both times (Knollmann & Knebe, 2009). Merger trees were traced from until the time their corresponding parent haloes could be identified by AHF. Fig. 3 shows the MAH for our haloes: continuous, dashed, dot-dashed and dotted curves represent the total, DM, gas and stellar masses, respectively. Haloes are identified with different colours.
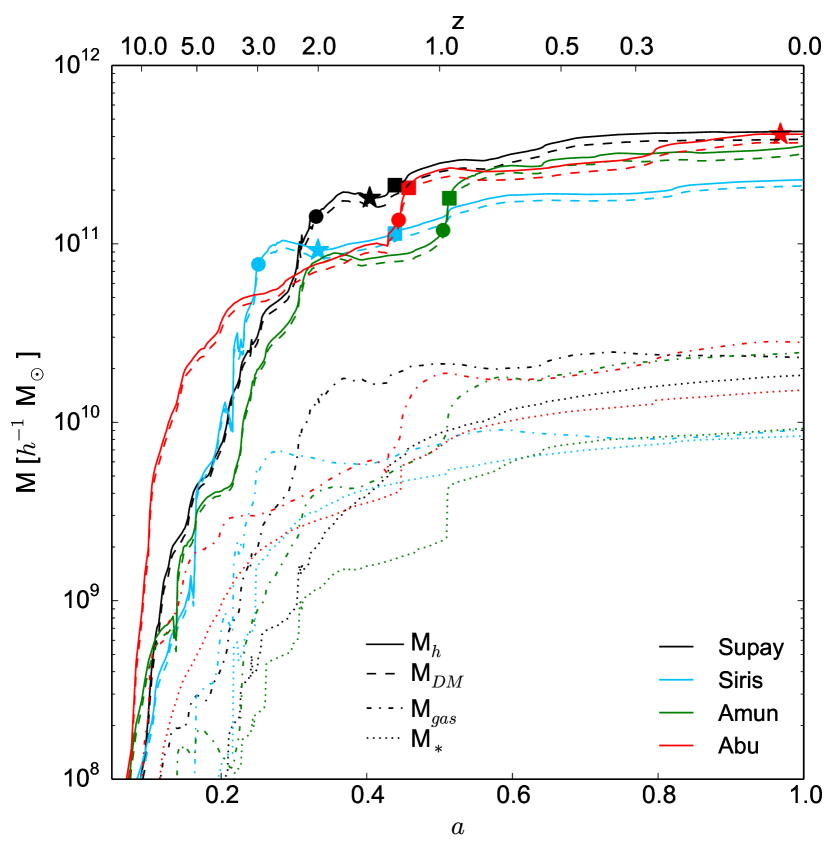
We defined halo formation time in different ways (see also Li et al., 2008). We denoted by () the earliest time at which half (30 per cent) of the mass is in place (filled squares and circles in Fig. 3). We also computed the collapse time (stars in Fig. 3) as in Borzyszkowski et al. (2014, see also paper I). This quantity identifies the epoch at which the physical volume filled by the forming haloes becomes stable and virialization can happen. For Supay and Siris this happened at , while for Abu and Amun . [We recall that the definition of stalled and accreting haloes is based on ]. Notice that for the stalled haloes and are very similar, with the former taking place before the latter. The situation for the accreting-haloes is substantially different, as they reach their by and by .
Overall, these times are very similar to those reported in paper I, the small differences are due to the effect of baryons that slightly affect the collapse time of the main structures as well as the incoming ones.
| Halo name | # substructures | |||||||
|---|---|---|---|---|---|---|---|---|
| [] | [] | [] | ||||||
| Supay | 4.3 | 153 | 348 | 0.0284 | 0.330 | 0.439 | 0.404 | 630 |
| Siris | 2.3 | 124 | 200 | 0.0087 | 0.251 | 0.439 | 0.333 | 228 |
| Abu | 4.1 | 151 | 239 | 0.0163 | 0.444 | 0.458 | 0.968 | 364 |
| Amun | 3.5 | 144 | 314 | 0.0347 | 0.505 | 0.513 | >1.000 | 457 |
2.5 Accretion rates
Once the main branches of the merger trees were identified, we calculated the matter inflows and outflows as a function of time at given radii. We have chosen to work with physical rather than comoving coordinates. In order to calculate the accretion, we have tagged all particles (DM and baryons) that are or were part of the halo at a given time. We registered the time at which each particle became part of the halo or of a region of interest within the halo. With this list, and by comparing the matter content within the given region between two neighbouring output times, one can distinguish if a particle has been accreted for the first time, re-accreted or if it has been expelled (see also Romano-Díaz et al., 2014). The fine output-time sampling of our simulation suite allows us to have a very detailed and precise measurement of such inflows and outflows. Notice that our approach differs from other techniques where accretion is defined by differentiating the MAH (e.g. Murali et al., 2002; Maller et al., 2006; Kereš et al., 2009; Fakhouri et al., 2010; van de Voort et al., 2011), or by measuring the flux of matter at fixed radii (e.g. Faucher-Giguère et al., 2011).
3 Results
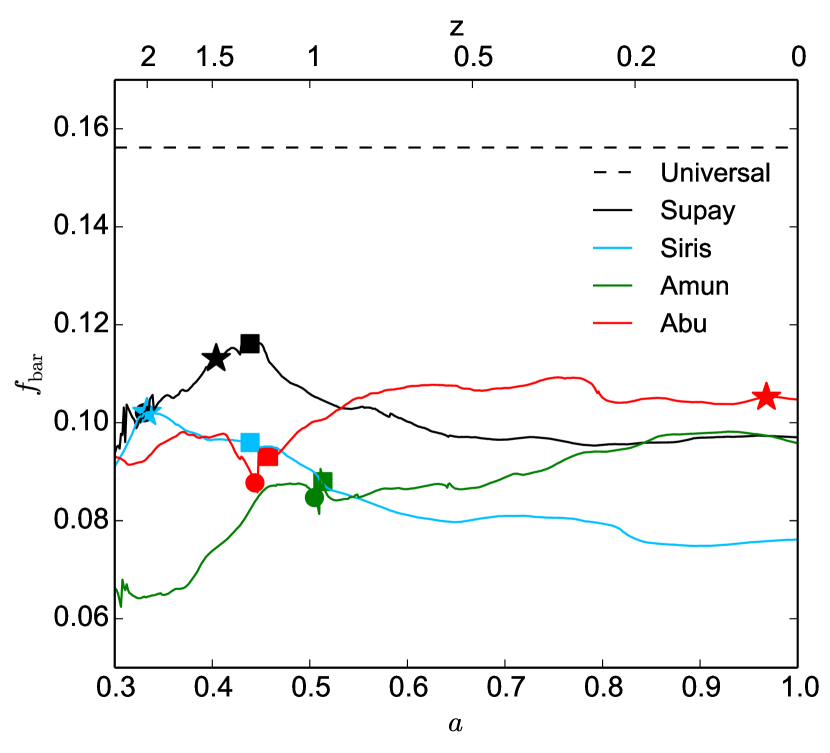
In Fig. 4 we analysed how the baryonic mass fraction () within changes with time. To establish a link with the MAHs, we indicated the different characteristic times of the haloes using the same convention as in Fig. 3. As a consequence of feedback processes, is always lower than the universal baryon fraction (dashed line) and shows relatively little variations. This is consistent with previous numerical results (e.g. Crain et al., 2007; Faucher-Giguère et al., 2011; Scannapieco et al., 2012; Peirani et al., 2012; Brook et al., 2014; Metuki et al., 2015) and observations (McGaugh et al., 2010). The nearly constant value of over time implies that the baryon mass grows approximately at the same rate as the DM.
On top of these general trends, a clear distinction between early- and late-collapsing haloes is noticeable: the stalled ones show a slight decrease in after having reached their maximum baryonic fraction (in the case of Supay this time coincides with , while for Siris with , both of these being very close to ). At later times, stays almost constant. On the other hand, the baryon fraction of accreting haloes continues raising slowly until .
3.1 Accretion
In this section we describe how matter was accreted onto the haloes as a function of time. The starting point for our calculations was set as so that to analyse a considerable interval for each halo.
3.1.1 Halo outskirts
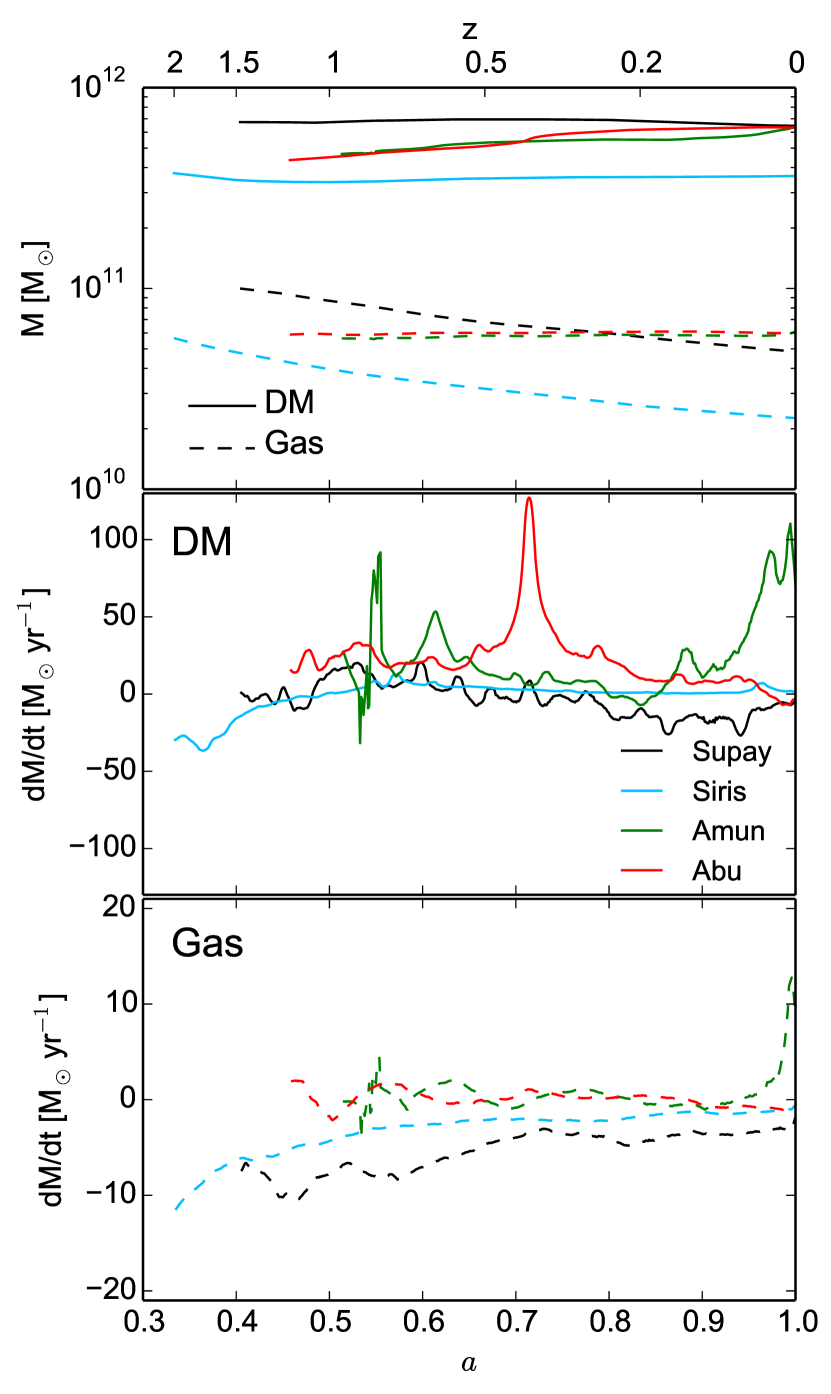
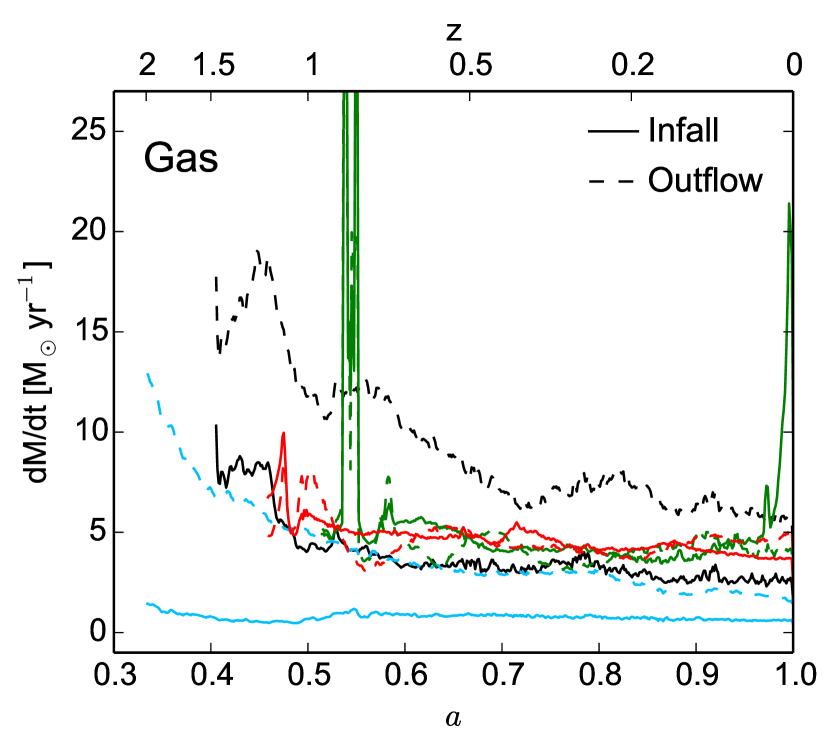
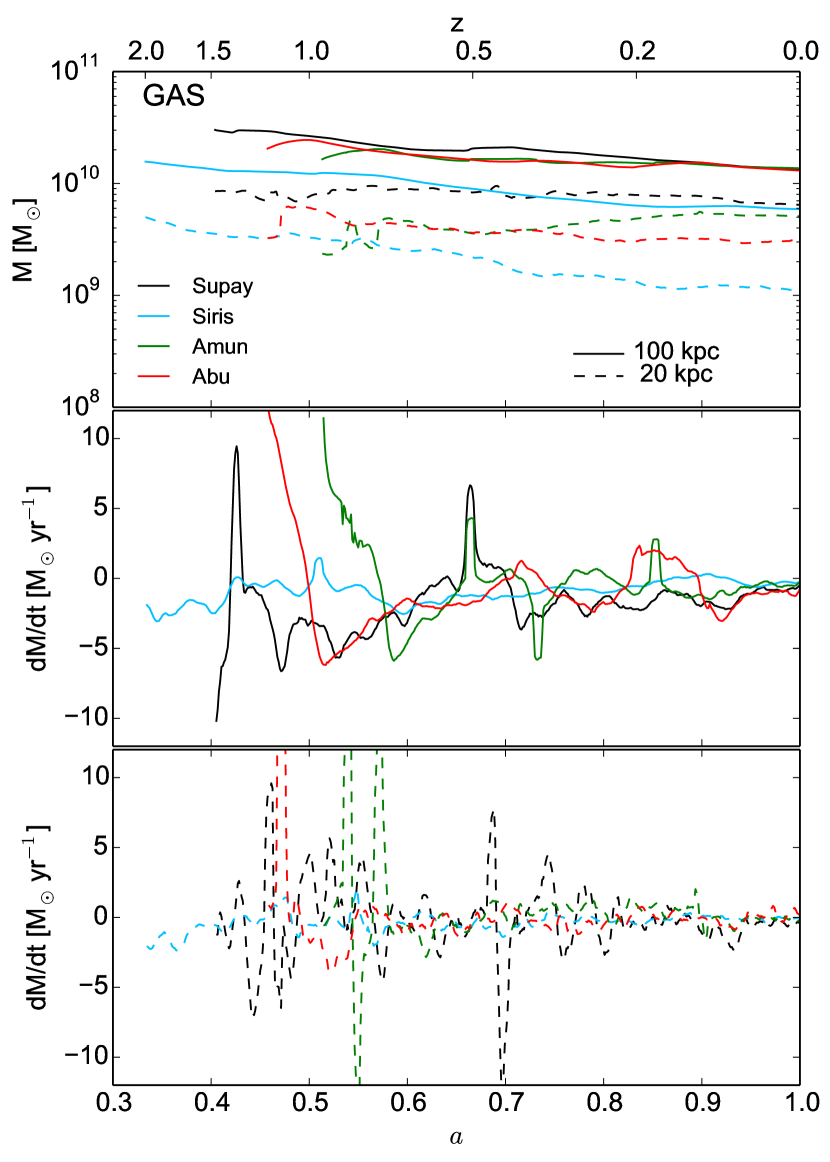
We first explored the outermost regions of the haloes. In order not to suffer from the pseudo-evolution, we calculated the matter inflow and outflow rates at fixed physical radii rather than using conventional choices such as or . In Fig. 5 we show the evolution of the matter content calculated at fixed radii of 300 kpc (), a distance comparable to . The top panel shows the DM and gas masses while the central and lower panels display the corresponding time derivatives. In Fig. 6 the gas infall and outflow rates are presented. For the S-haloes, the DM content does not evolve after , while the gas mass nearly halves by the present time. This is mostly due to the combined action of gas consumption via star formation and gas ejection via feedback processes which are more efficient than the ability of the haloes to capture gas from their surroundings. In fact, outflows are considerably larger (by almost a factor of two) than the corresponding inflows (see bottom panel in Fig. 5 and Fig. 6). On the other hand, the accreting haloes increase their DM mass by a factor of two, while their gas content remains nearly constant given that infall and outflow rates cancel each other. Notice that the infall rates are larger than in the S-haloes.
3.1.2 Dark-matter accretion within haloes
In order to study the accretion onto the halo and how gas flows in its inner region, we considered an outer radius of ()111Choosing a larger radius, such as or more does not change qualitatively our results. and an inner radius of (, comparable to the size of the central galaxies).
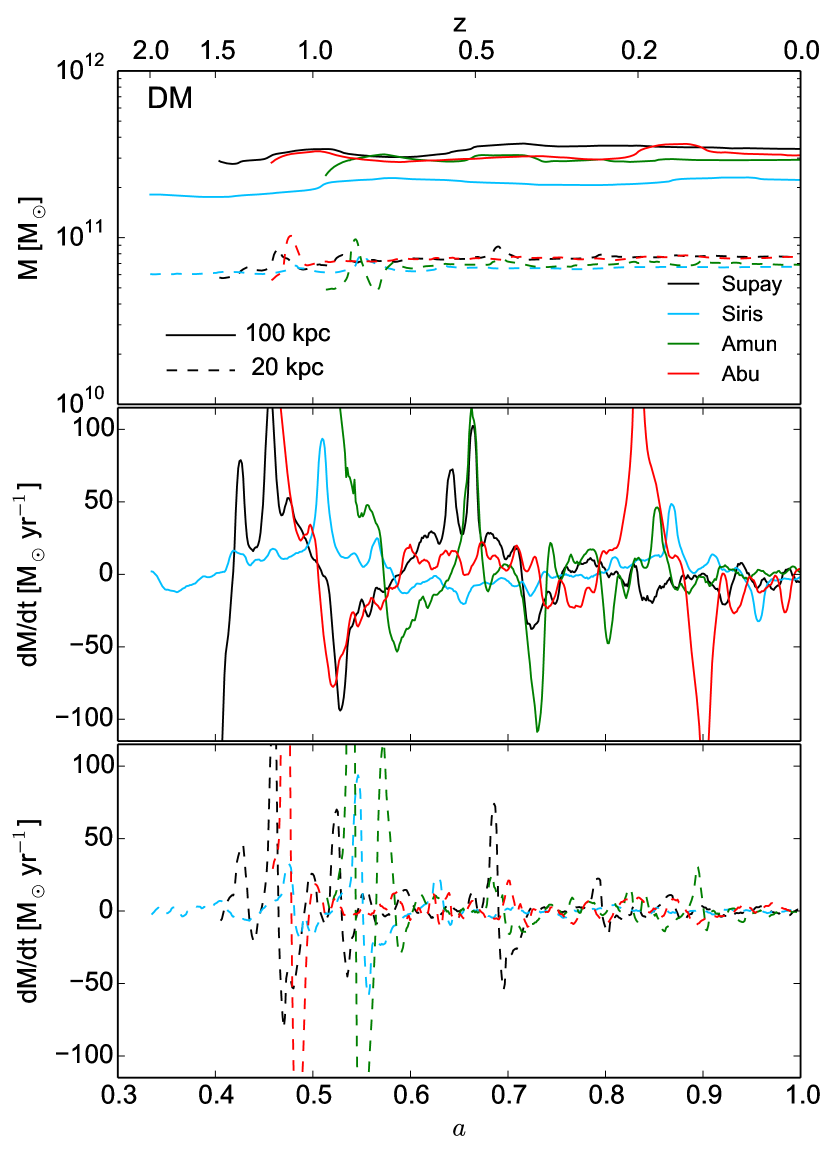
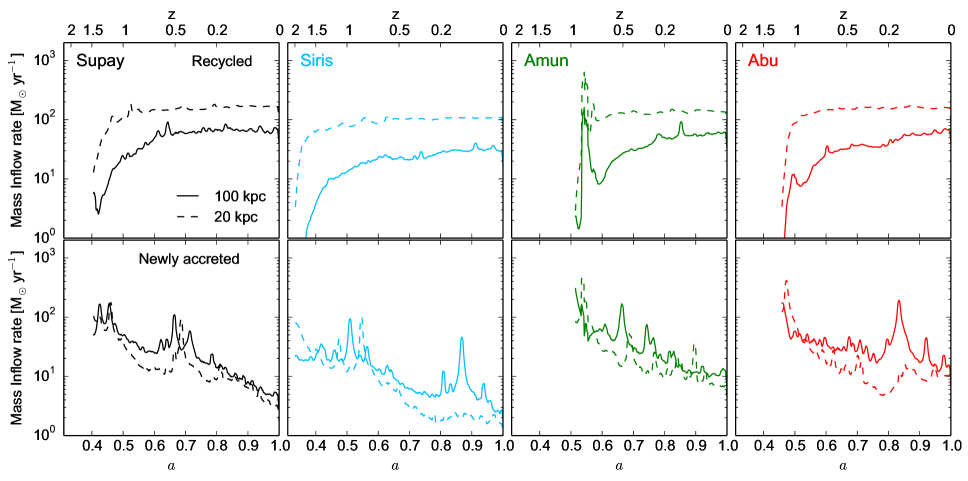
Fig. 7 shows the evolution of the DM content (top panel) within (solid lines) and (dashed lines) for all our haloes. All masses grow only by per cent, showing that in these regions inflows and outflows are approximately in equillibrium (see bottom panel of Fig. 7). The temporary deviations, denoted by local oscillations in the masses indicate interactions with substructures. However, these events do not add any significant amount of material.
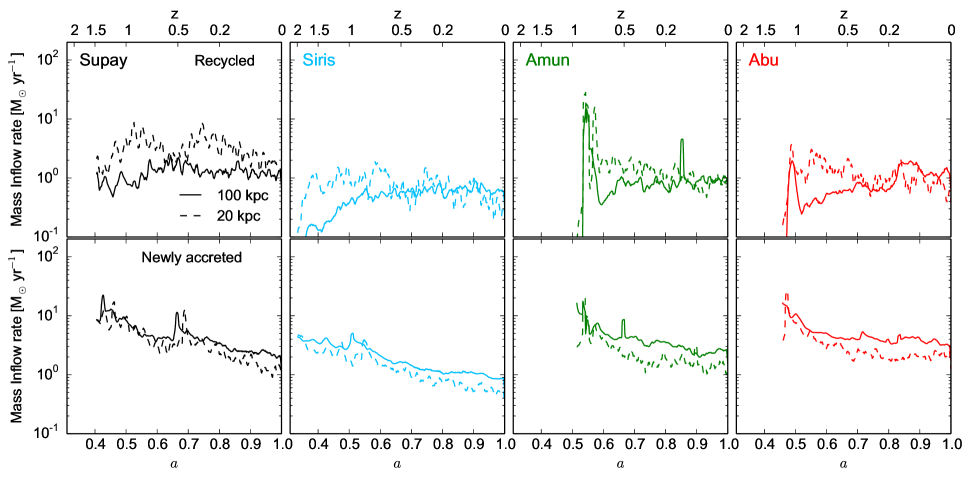
In Fig. 8 we have analysed in more detail the infalling material dividing it into recycled (upper panels) and newly accreted matter (bottom panels). Recycled material refers to those particles that have been previously accreted onto the selected volumes and due to various processes (i.e. radial migration, encounters, mergers) have been expelled and have fallen back into them. For all haloes, the rate at which material is recycled at is higher by a factor of two than at . This indicates that there is DM which is confined within the inner regions of the halo and has limited radial excursions (e.g., Romano-Díaz et al., 2009). Notice that the amount of recycled material at increases with time for all haloes but it saturates earlier for the stalled ones (), while it continues increasing until the present time for their accreting counterparts.
Typically, only a fraction (50 per cent or less) of the newly accreted material that infalls into reaches . Overall, the infall rates for the S-haloes are lower than those in the A-haloes at both radii. This becomes more evident at lower redshifts where the differences go up to a factor of 5 between the two types of haloes, and it is independent of the chosen radius. Spikes (local maxima) along the evolution are signatures of incoming substructures orbiting around and within the halo222These can also be seen in the recycled material although to a lesser degree due to substructure destruction (see also paper III).. Some of these cross both and during their first passage with a time lag. However, most of them, do not pass close enough to the centre as shown by the relative lack of peaks in the dashed lines
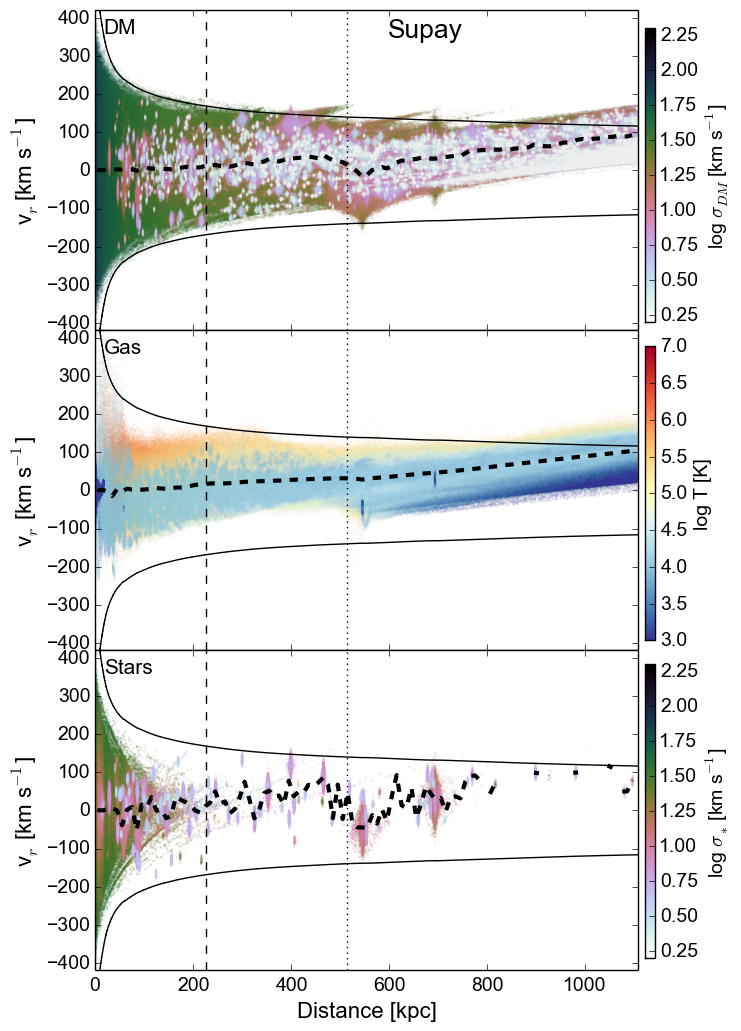
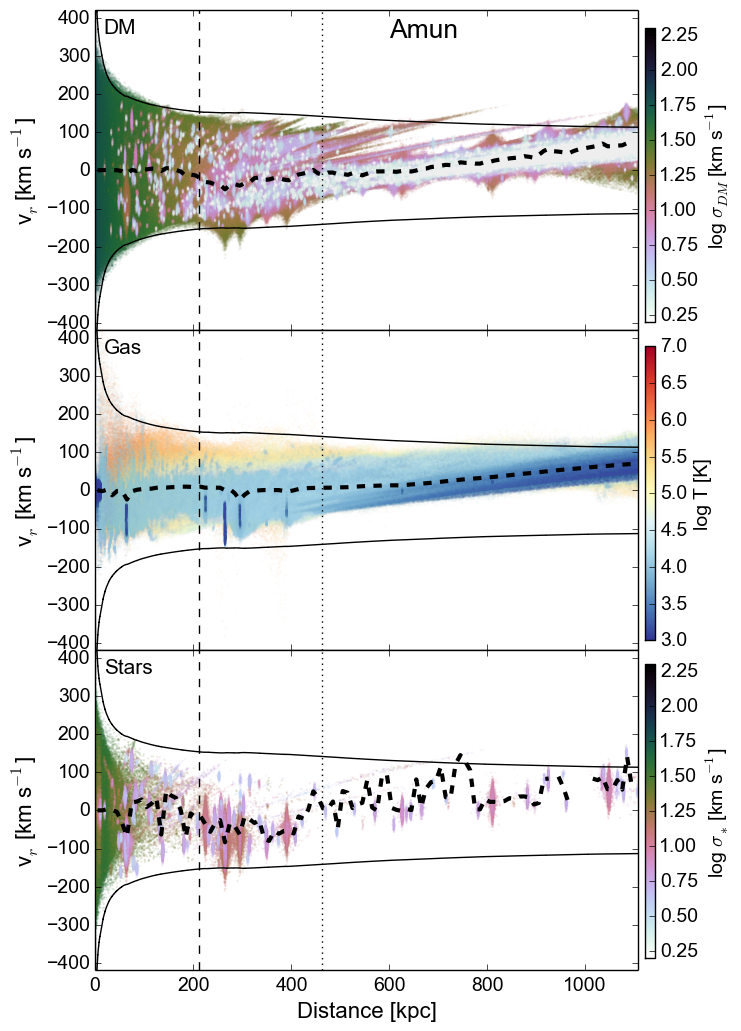
The way in which (sub)structures and loose material accrete onto the halo can be clearly seen in Figs. 9 and 10 (for Supay and Amun respectively, the diagrams for Siris and Abu are very similar). These show the radial phase-space distribution at for DM (top), gas (middle) and stars (bottom). The dashed and dotted vertical lines indicate and , respectively. The solid curves above and below the point distributions are the escape velocity as a function of distance from the halo centre while the thick dashed line represents the local mean radial velocity. For DM, colour coding reflects the particle velocity dispersion () calculated with a standard SPH-like kernel with 64 neighbours. We use since it is a good indicator of the kinematical state of the immediate neighbourhood around a given particle. For example, a particle located in a virialized region (i.e. where random motions dominate over coherent or orderly motions) will have a large , while a particle moving within a region where coherent motions dominate (i.e. filaments or voids of the cosmic web) will have a lower .
Light colours denote substructures and the cosmic environment (filaments) surrounding the haloes. Darker tones indicate the potential well of the main objects. Intermediate hues show mixing between these regions. The needle-shaped features with positive radial velocity () are tidal tails formed by the disruption of substructures orbiting the haloes (e.g., Vogelsberger et al., 2009; Romano-Díaz et al., 2010, see also paper I). A-haloes show clear accretion flows, i.e., material that falls in from cold environments of the cosmic web (whitish band at ). The radial velocity dispersion of the infalling matter (vertical thickness at fixed radius in the phase-space diagram) increases as particles move towards the central regions and interarct with the halo and substructures. This process progressively enhances the random component of the particle velocities, weakening the coherent accretion flow (white region on the right-hand side of the phase-space diagram) that becomes less and less noticeable while moving inwards (see also bottom panel of Fig. 8). This effect becomes stronger as the halo grows in mass and radius since the accretion flow needs to cross larger an denser virialized regions. Notice that S-haloes do not show coherent infalling motions (see paper I). The radial-velocity distribution is approximately symmetric between positive and negative values until very large distances from the halo center.
3.1.3 Gas accretion within haloes
The gas component is subject to more physical processes than DM. Apart from gravity, it is also severely affected by the combined action of star formation, winds and feedback. We have analysed gas accretion onto the halo along the same lines as we did for the DM component (Section 3.1.2). In the top panel of Fig. 11, we show the gas mass within and . A difference from the DM case is that the gas content decrease at by a factor of two for the S-haloes and 1.5 for the A-ones as time progresses. Similarly, at the amount of gas slightly decreases, with the exception of Amun in which remains constant at late times (see also the bottom panel of Fig. 11).
We define recycled gas as the material that has been expelled from a given region due to SNe, winds or tidal stripping from infalling substructures. As in the case of the DM, the recycled gas accretion rates at increase up to after which they remain almost constant for the S-haloes while in the A-ones still register a slight increase (Fig. 12, top panel). The situation is different at where the effects due to the presence of the central galaxy are much stronger. Although, the curves are noisy due to the presence of incoming and outgoing substructures, the main trends are clear: the recycled material decreases for the S-haloes while for the A-ones remains almost constant.
The amount of newly accreted gas decreases at both radii with time from down to for the S-haloes and down to for the A-ones (Fig. 12, bottom panel). Furthermore, the accretion rates for the A-haloes flatten at both radii so that they are slightly higher than those from their stalled counterparts. Overall, the fresh-gas accretion rates are in agreement with Brook et al. (2014) who found similar values for galaxies of similar masses. Local maxima (spikes) in the gas inflow rate are much less prominent than in the DM. This is because gas that is brought by infalling substructures is mostly stripped from them due to ablation, shock heating and/or ram pressure. Therefore, most of the substructures that cross the central region are gas naked (see also paper III). The total amount of gas that is being recycled is of the same order as the newly accreted gas at late times. However, at early times the trends are different, new gas accretion exceeds by almost an order of magnitude the amount of recycled gas.
Radial gas motions are investigated in the middle panel of Figs. 9 and 10, where the colour coding reflects the gas temperature . At distances larger than , a clear accretion pattern is noticeable both in Supay and Amun: a coherent stream of cold gas (blue) with negative radial velocity (the same holds true for the remaining two haloes). [A relatively massive halo is infalling onto Supay together with its own gaseous accretion stream at kpc.] It is worth mentioning that, in the DM, this feature was only visible for the A-haloes (see the top panels). Infalling cold gas gradually gets warmer as it approaches the halo boundaries. In the surroundings of the haloes, there is also a warmer gas component (yellow) generated by the combined action of SF and feedback from substructures as well as accretion shocks due to large density gradients in the cosmic web. Hotter gas within has been shock heated as it fell into the halo (orange). Islands of very cold gas (dark blue) identify the locations of galaxies which are associated with massive DM substructures, while smaller subhaloes are devoid of gas. Feedback processes increase the gas temperature and provide sufficient kinetic energy to expel gas from its host halo. As the gas moves outwards, it radiates energy away, cools down and, if still gravitationally bound, reduces its radial velocity until it reaches . After this, the material slowly falls back into the halo due to its gravitational pull, increasing again the gas temperature. Unbound gas moves quickly away from the halo.
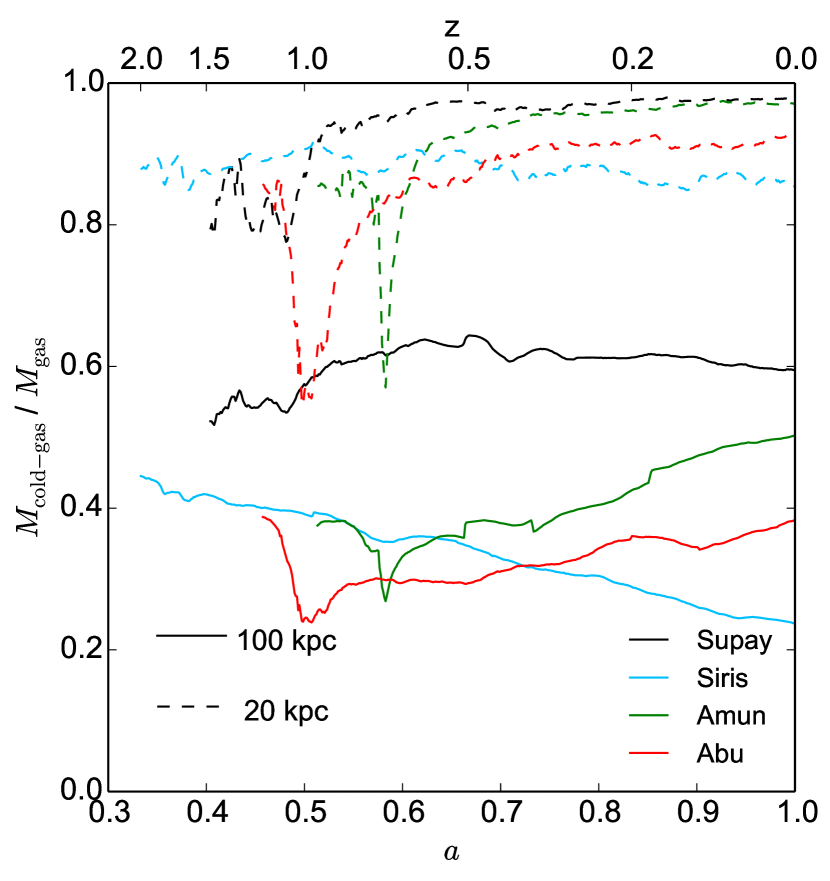
An important quantity is the amount of cold gas (K) that might fall onto the central galaxy and support SF (further details will be discussed in Section 3.2). In Fig. 13 we have calculated the evolution of the cold-gas fraction at (solid) and (dashed) for our haloes. The inner regions are dominated by the cold component while in the outer ones the warmer gas is equally important. In terms of sheer numbers all haloes present similar fractions, however, trends in their time evolution within are different between A- and S-objects. The former show a constant increase while the latter do not (Supay has no change and Siris a constant decrease). Instead, in the central regions, all haloes have similar and little evolving cold-gas fractions. All this suggests that the amount of cold gas in the halo cores does not correlate with the halo assembly history. We explain this as follows. Gas that has been shock heated when it enters the halo (or pushed out by feedback) cools down radiatively and eventually rains into the central part. Since cooling times are long (comparable with the Hubble time, i.e., several Gyr), the halo is filled with large reservoirs of hot gas. Therefore, if gas accretion in the outskirts would cease (which is not the case even for S-haloes), cold gas would continue infalling onto the central galaxy for very long time.
In summary, haloes of the same mass but with extremely different assembly histories do not show large differences in their central cold-gas content if they are fed via the ‘hot-mode accretion’. However, we find that a factor of two difference in the amount of infalling gas per unit time should be expected with the A-haloes showing the highest rate.
3.2 The central galaxies
| Galaxy name | D/T | mZ | C | A | S | ||||||||
|---|---|---|---|---|---|---|---|---|---|---|---|---|---|
| [] | [] | [] | [] | [] | [] | [Gyr] | [] | ||||||
| Supay | 23.9 | 6.57 | 0.63 | 1.65 | 3.20 | 0.60 | 0.69 | -0.01 | 10.5 | 12.75 | 4.37 | 0.17 | 0.25 |
| Siris | 11.4 | 1.07 | 0.90 | 2.46 | 0.64 | 0.40 | 0.41 | -0.04 | 11.2 | 10.77 | 3.04 | 0.27 | 0.28 |
| Abu | 20.3 | 3.31 | 0.66 | 3.12 | 0.54 | 0.20 | 0.43 | -0.06 | 6.8 | 10.72 | 3.13 | 0.28 | 0.22 |
| Amun | 12.1 | 5.16 | 0.89 | 1.27 | 2.28 | 0.28 | 0.66 | -0.02 | 7.1 | 11.72 | 3.55 | 0.21 | 0.32 |
We now turn our attention to the central galaxies within our halo sample. We will refer to the galaxies by using the same names of their respective host haloes. Figs. 14 and 15 show the face-on (top) and edge-on (bottom) gas and stellar distributions at , respectively. Colour coding reflects the metallicity () for the gas and the local velocity dispersion () for the stars. The white horizontal and vertical segments represent 10 and 5 kpc yardsticks, respectively. Based on their morphologies, our galaxies can be divided into two groups that, however, do not separate early and late collapsing haloes. While Supay and Amun are grand design spirals with thin gaseous discs, Siris and Abu are smaller bulge-dominated disc galaxies with more irregular gas distributions. In particular, Abu has been perturbed by minor mergers at as indicated by: (i) the lack of alignment between the gaseous and stellar discs; (ii) the presence of a ring-like pattern around the gaseous disc with a different metallicity. These results are based on visual inspections of the figures, a more quantitative study will be addressed in Section 3.4.
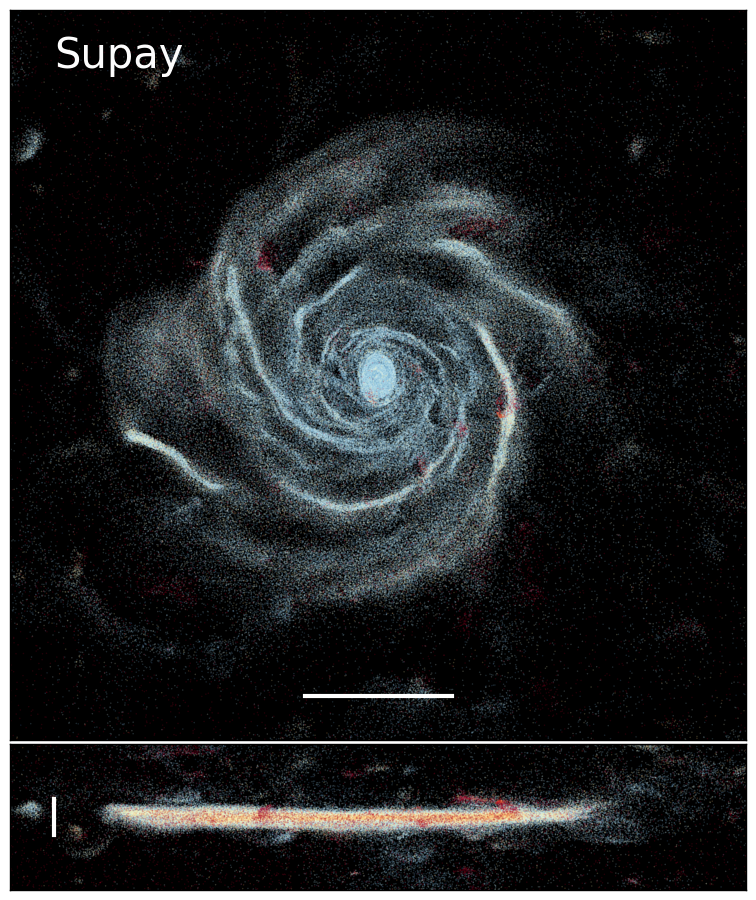
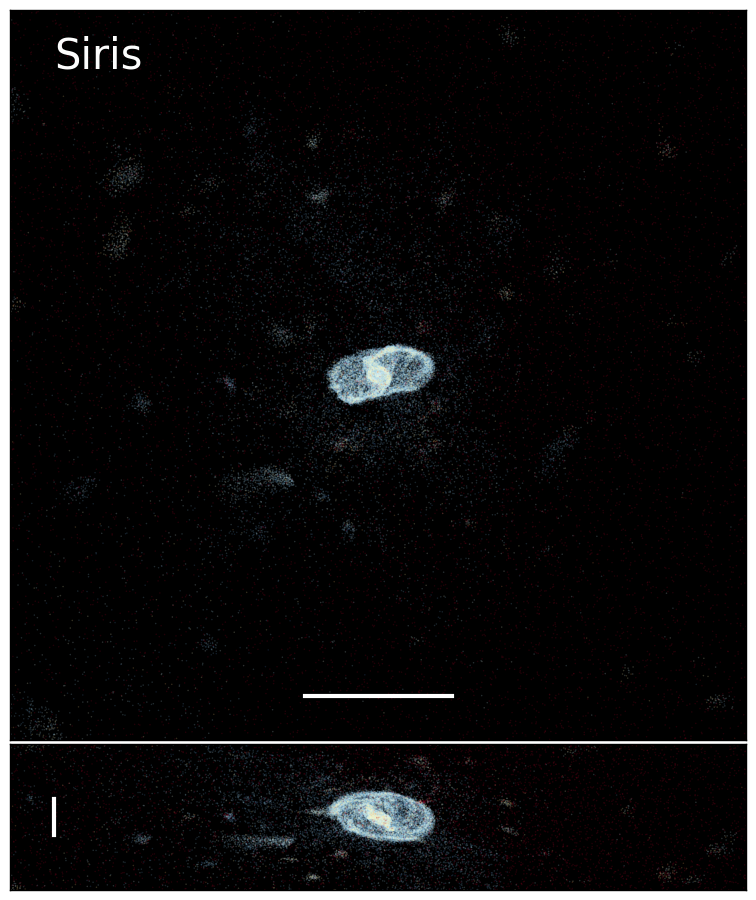
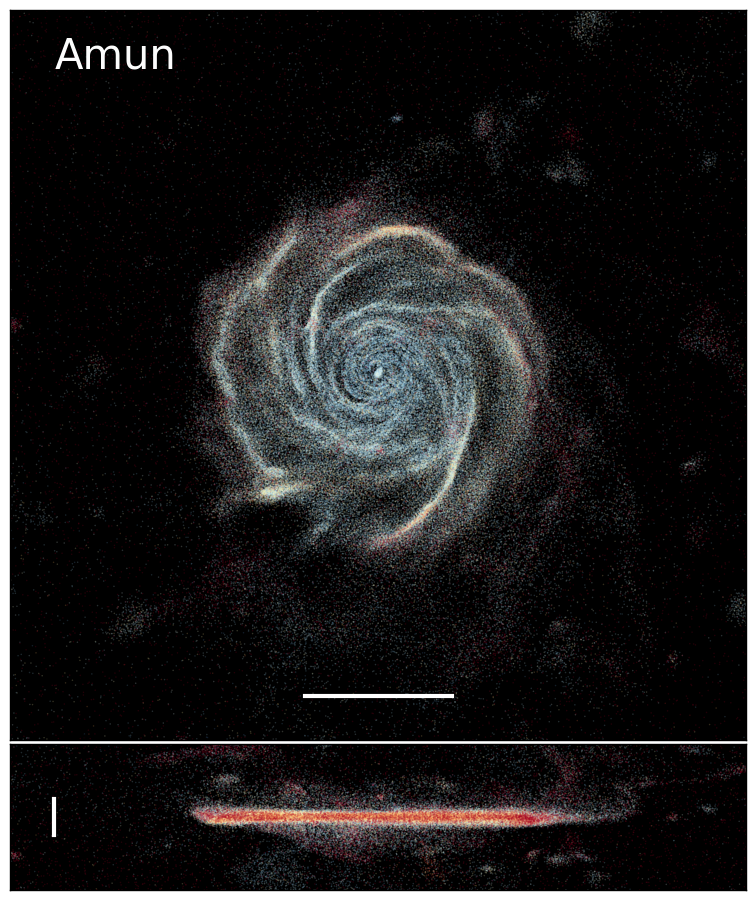
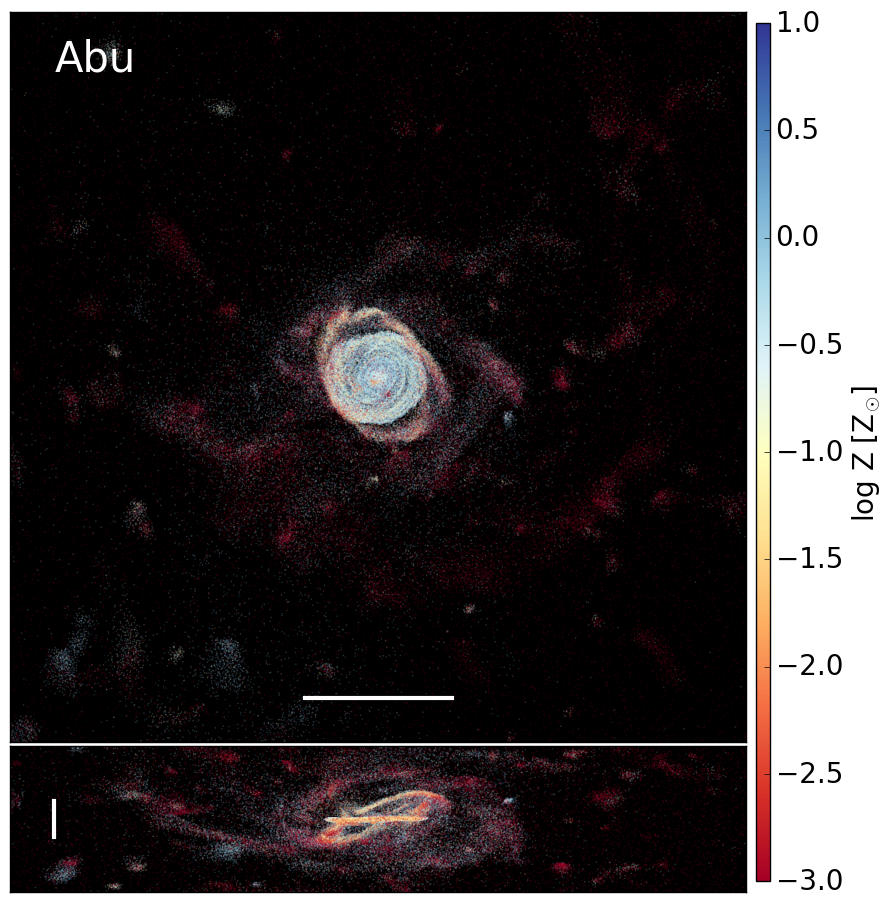
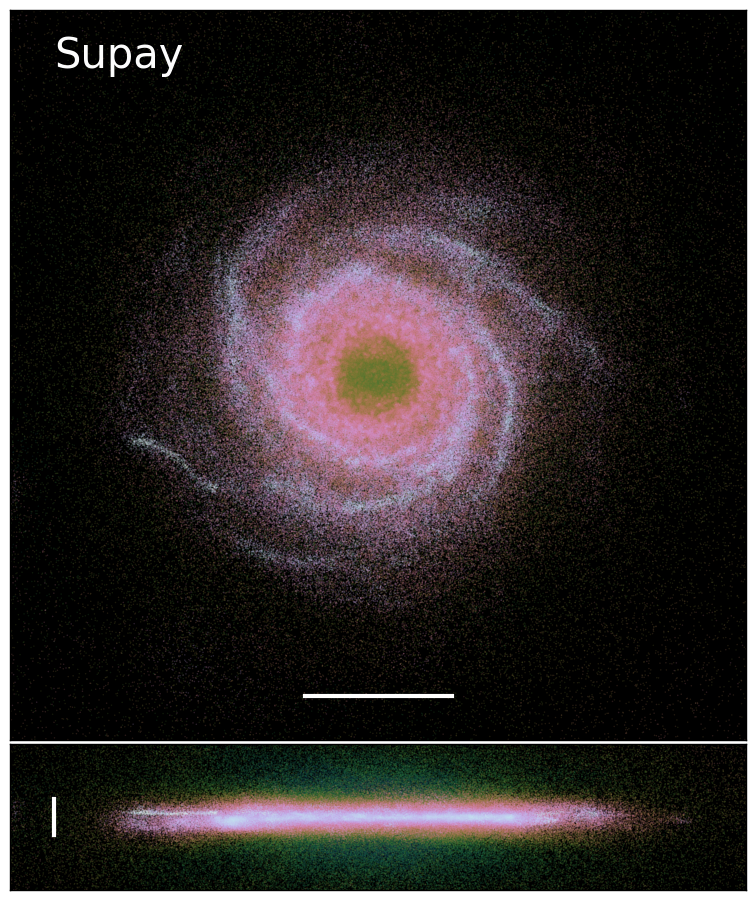
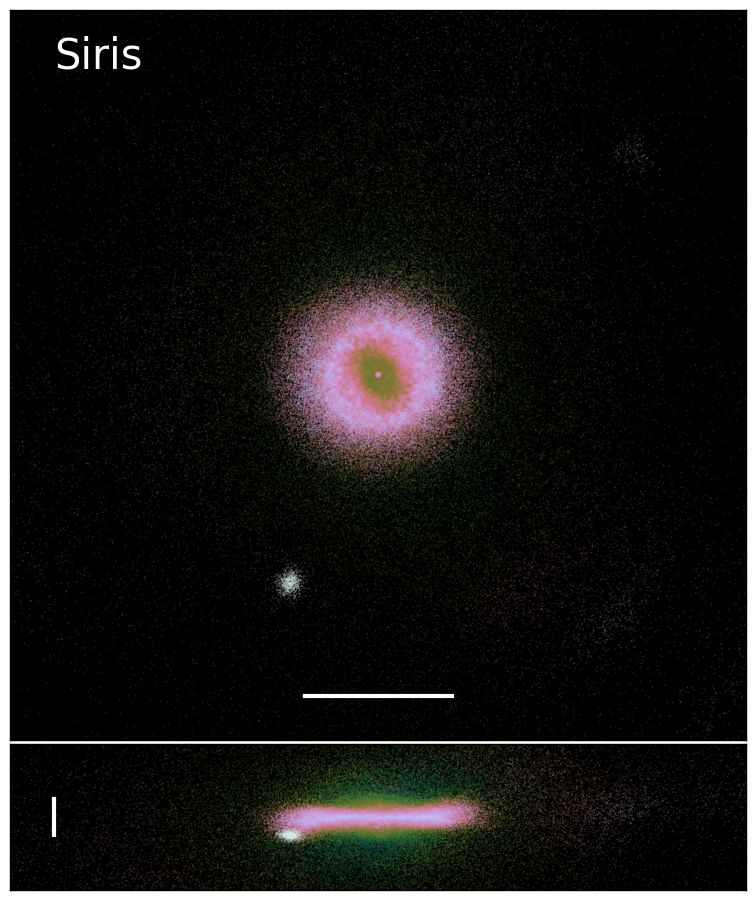
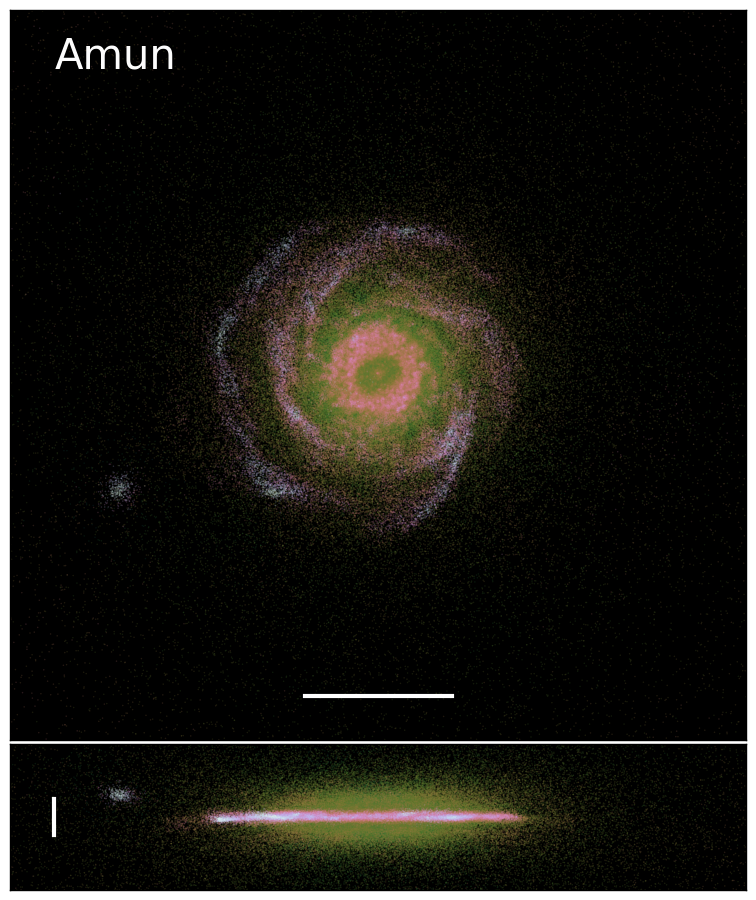
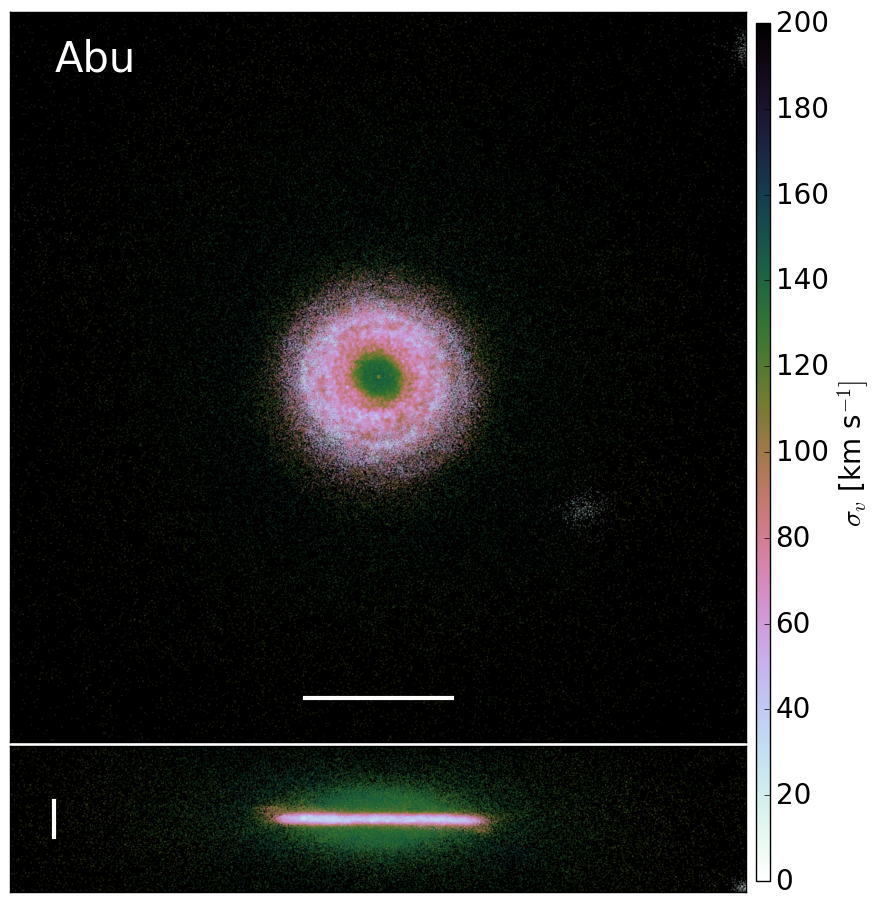
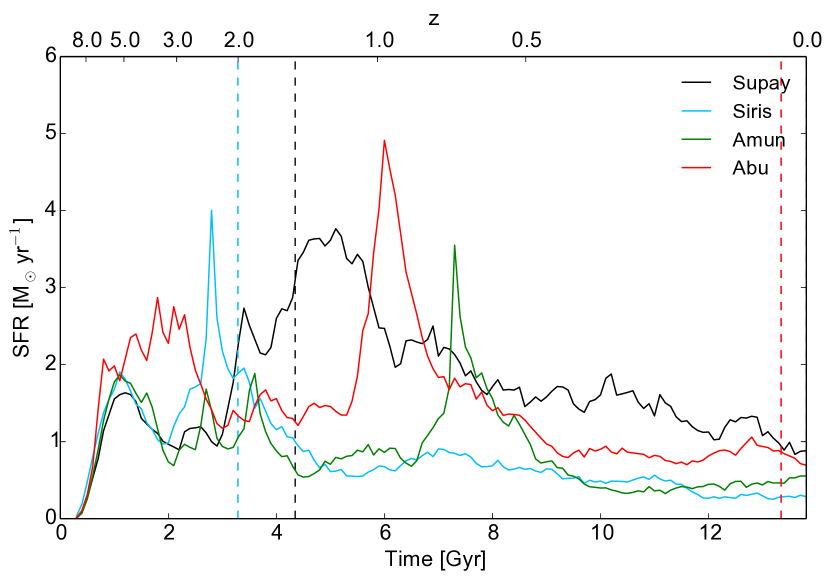
Fig. 16 shows the SF histories for our galaxies. The highest peak for each model coincides with the last major galaxy merger. A-haloes experience this at lower redshifts () with respect to the S-ones. For the latter class, the peak also coincides with the halo collapse time (dashed-vertical lines). At later times the SFR decreases to or less.
3.3 Comparison with observations
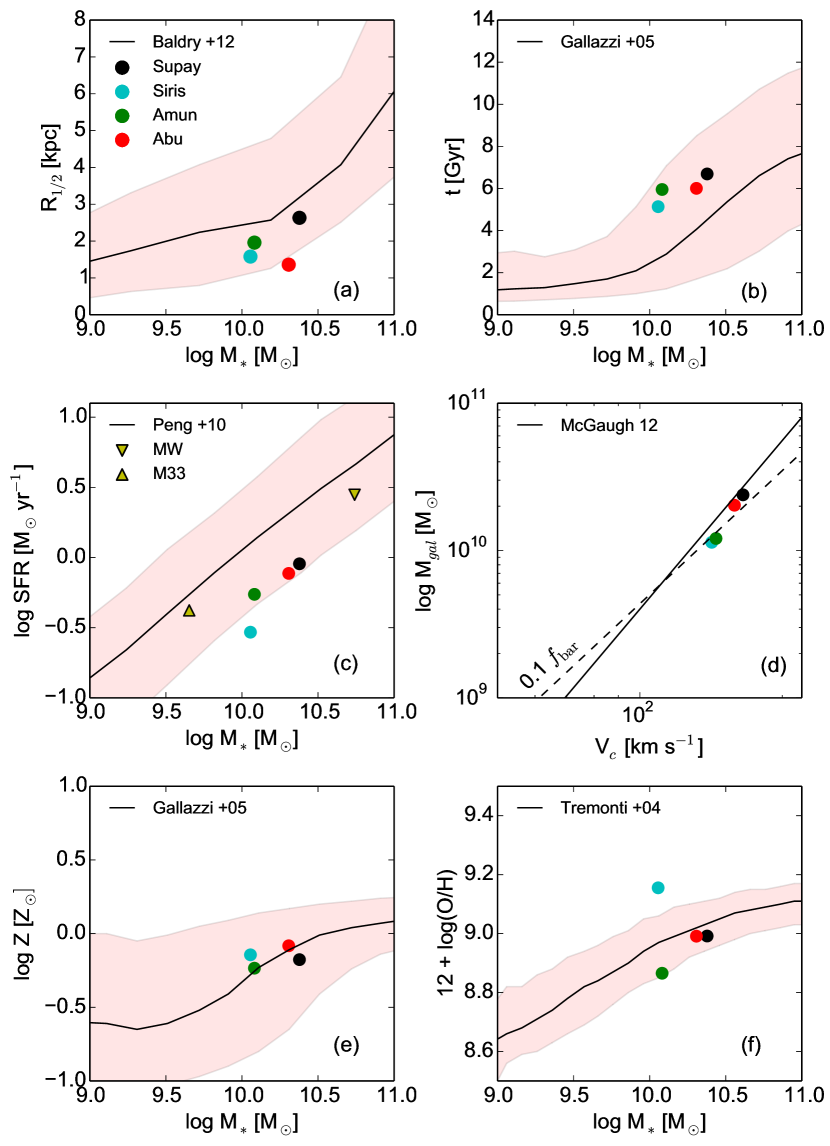
In order to assess the reliability of our simulated galaxies, we have compared our suite to a set of observational properties at gathered from the literature. Fig. 17 presents the following data: (a) the stellar mass – half mass radius relation (Baldry et al., 2012); (b) the age – stellar mass relation (Gallazzi et al., 2005); (c) the galaxy main sequence (Peng et al., 2010); (d) the baryonic Tully-Fisher relation (McGaugh, 2012); (e) the stellar metallicity – stellar mass relation (Gallazzi et al., 2005); (f) the gas metallicity – stellar mass relation (Tremonti et al., 2004). In all cases the black lines represent the mean of the measured values, while the shaded regions indicate the uncertainties (). The simulations are represented by filled circles with different colours. In panel (c) we have added the observed values for the Milky-Way and M33 that bracket our galaxy sample in terms of stellar mass.
In general our galaxies are in very good agreement with the different observational properties. The objects do not only follow the overall trends, but they are also close to the mean values. If anything, our simulations consistently produce slightly smaller, older and less star forming galaxies than the observed mean values but lie well within the scatter.
3.4 Galactic decomposition
In order to characterise the stellar morphology of our galaxy set we have implemented two different and complementary methods: fitting their stellar surface density profiles and using a kinematical decomposition.
3.4.1 Surface density profiles
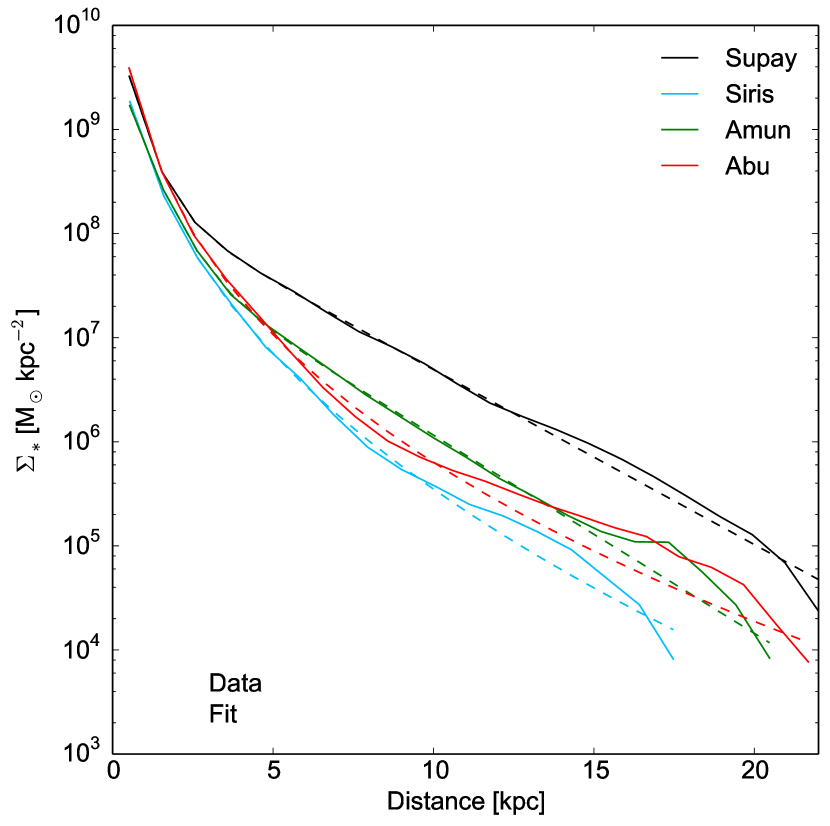
Fig. 18 shows the azimuthally-averaged face-on surface density profiles (solid lines). We have fitted the data with the following model:
| (1) |
which includes two components, a bulge333For simplicity we have included the central bar component into the contribution of the galactic bulge. and an exponential disc. The first term on the right-hand side, equivalent to a standard Sérsic profile (Sérsic, 1963), has been expressed in terms of effective quantities to facilitate its comparison with observations (MacArthur et al., 2003). In this way, is the effective bulge radius, the density at this point and the Sérsic index. Note that depends on (Ciotti & Bertin, 1999; MacArthur et al., 2003). The disc component is parameterised in terms of its scale length and the density . The fits were performed by simultaneously varying the parameters. Fitting the disc first and then the bulge gave consistent results (see also Marinacci et al., 2014). The dashed lines in Fig 18 represent the best fits to the data, the corresponding scale lengths are reported in Table 2. These results corroborate the visual impression described in Section 3.2, namely, Supay and Amun have extended discs, while Abu and Siris more compact ones.
We have calculated the bulge and disc masses by integrating equation (1). Table 2 lists the disc-to-total mass ratio (D/T) for our sample. This indicates that Supay and Amun are disc dominated. On the other hand, Siris and Abu have the most dominant bulges of the sample.
3.4.2 Kinematic decomposition
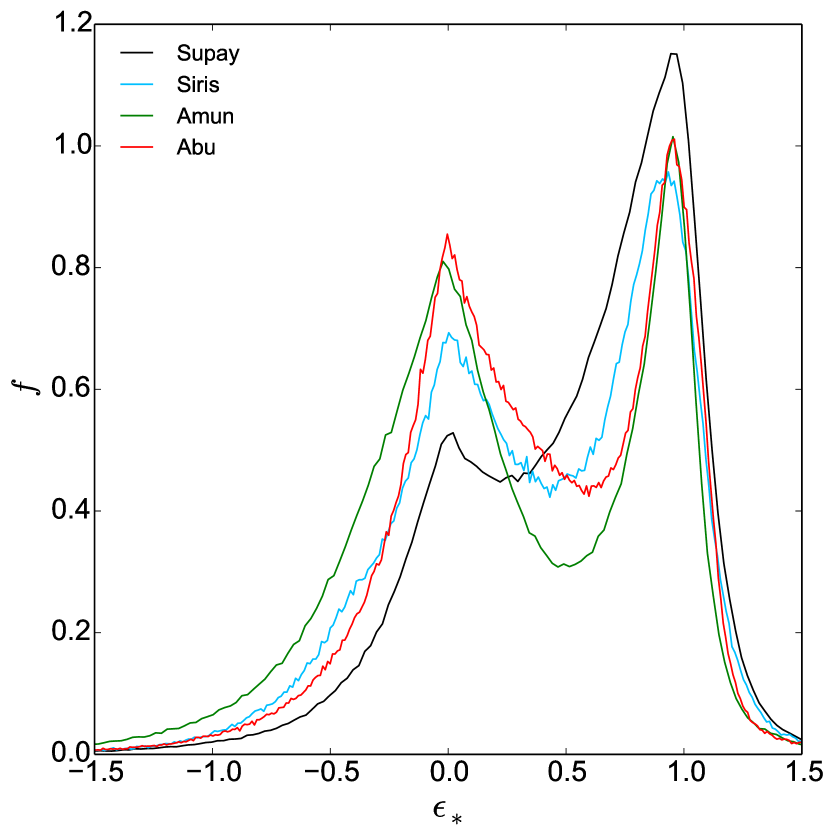
We performed a kinematic bulge-to-disc decomposition in terms of the circularity parameter
| (2) |
(Abadi et al., 2003; Scannapieco et al., 2008) where is the component of the specific angular momentum of each particle parallel to the total stellar angular momentum and , with . Fig. 19 shows the distributions of for our four galaxies normalised so that . The histograms extend beyond because we also considered particles that are not gravitationally bound to the galaxies. Particles in dispersion-dominated regions (bulges) have , while those in rotation-supported ones (discs) . We have calculated the masses of the disc and bulge components. The former is defined by stars with (e.g., Marinacci et al., 2014) and imposing an extra condition of . The remaining particles are very extended spatially, in contrast with the bulge definition used in Section 3.4.1. Therefore, we have made use of the galactic rotation curves in order to separate this spheroidal component into a bulge and a halo. Namely, we considered as bulge-particles those with and , with the radius of the maximum of the rotation curve. The halo is composed by the remaining particles. The resulting D/T values are in very good agreement (within 10 per cent) with those reported in Table 2 obtained from the stellar surface density profiles. Overall, our values are on the low-side of the observed range in the CALIFA survey (Mendez-Abreu et al., 2016), in agreement with other numerical simulations (Brooks & Christensen, 2016). Anyway, Supay and Amun are within one standard deviation from the CALIFA mean value.
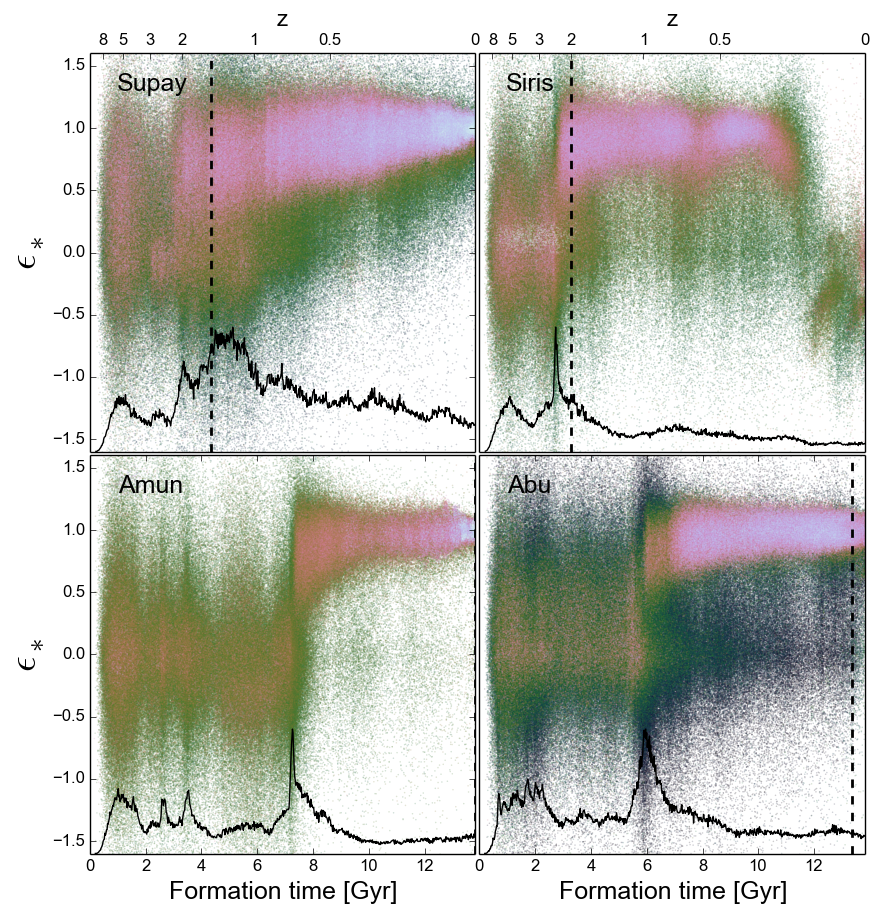
In Fig. 20 we have plotted (evaluated at ) as a function of the stellar formation time (see also Sales et al., 2012; Aumer et al., 2013). Colour coding represents the local stellar velocity dispersions . Generally, stars that now make the spheroidal components formed first while those found in the disc at later times. All galaxies show a sharp transition after which the stellar disc forms. We refer to this event as the disc formation time (see Table 2). This happens early on for Siris and Supay () and approximately coincides with the halo formation time (dashed-vertical lines) while it is delayed until for Abu and Amun. The transition epochs coincide with the maximum of the SF histories for all galaxies (represented by the black-solid curves at the bottom). We conclude that the age of the stellar discs correlates with the collapse time of haloes in which the galaxies are found.
3.4.3 Vertical profiles
The edge-on stellar distributions of Fig. 15 show a clear difference between the thickness of the galactic disc in stalled and accreting haloes. The former have a much thicker vertical distributions than the latter. In order to accurately measure this, we fit the vertical density profiles with the relation (van der Kruit, 1988):
| (3) |
where is the vertical scale-height of the disc and is the midplane surface density. The top panel in Fig. 21 shows the measured profiles (solid) and their respective best fits (dashed). The corresponding values of (in kpc) are also indicated in the figure and listed in Table 2. The average scale-height of the S-galaxies is a factor of two larger than for the A-galaxies.
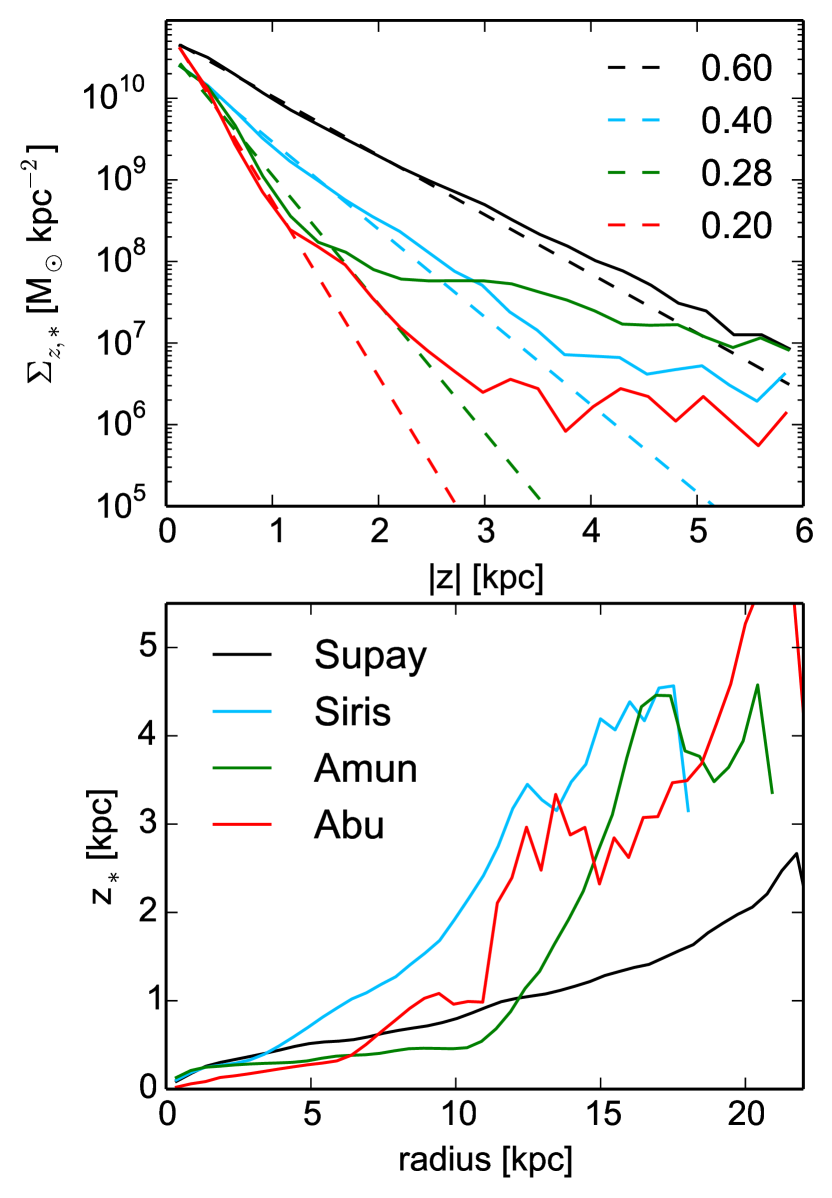
Two effects contribute to the thickening of the stellar vertical profiles: i) (minor) mergers and close flybys (e.g., Villalobos & Helmi, 2008; Kazantzidis et al., 2008; Purcell et al., 2010; Zolotov et al., 2010; Qu et al., 2011), which give rise to flared discs as well as ii) gravitational instabilities, which generate radially constant scale heights (Bournaud et al., 2009). The bottom panel of Fig. 21 shows that , the rms value of the -coordinate, increases as a function of radius. This indicates that merger activity is probably the main driver in the thickening of the discs (see however, Minchev et al., 2015, and references therein).
As we have shown in Fig. 20, S-galaxies have older discs and therefore are more prone to experience mergers, flybys of substructures and secular evolution. As already disccused in Section 3.1.3, most of the incoming satellites are being stripped of their baryons and do not deposite gas into the disc. A detailed analysis of the evolution and influence of substructures will be discussed in paper III.
3.5 CAS analysis
We have looked for galactic signatures that could correlate with the halo formation time. For this reason, we have measured galaxy morphologies using the CAS (concentration, asymmetry, clumpiness) non-parametric method (Conselice, 2003, 2014) applied to the face-on stellar surface density. These quantities are designed to capture the major features of the underlying galactic structures and their evolution. Concentration (which correlates with the Sérsic index, Conselice, 2003) is defined as:
| (4) |
where and are the circular apertures containing 80 and 20 per cent of the stellar mass enclosed within 1.5 Petrosian radii.444In this context the Petrosian radius is defined as the location where the surface density divided by its average value within that radius reaches (Petrosian, 1976). Asymmetry is defined as (in the absence of a sky background):
| (5) |
where and represent the galaxy map in its original form and rotated by , respectively. The sum is performed over all pixels within 1.5 Petrosian radii. Clumpiness (or smoothness) is defined as (in the absence of a sky background):
| (6) |
where is defined as before and is the smoothed map. The scale of the smoothing kernel () depends on the radius of the galaxy and is defined as .
The results reported in Table 2 indicate that: i) Supay and Amun show CAS values which are in agreement with observations of spiral galaxies (Fossati et al., 2013; Conselice, 2014); ii) Siris and Abu show slightly higher values of A, indicating that these systems have been recently perturbed by mergers, while their C and S parameters are consistent with late-type disc galaxies.
Overall, the CAS analysis confirms our previous results. Namely, Supay and Amun are spiral systems while Siris and Abu present a more complicated morphology. However, we do not find any obvious correlation between the formation time of the parent haloes and galaxy morphologies.
4 Conclusions
The ZOMG project aims to study the relation between the assembly history of DM haloes and galaxy formation. In the present paper we have concentrated in analysing how gas accretes onto the haloes, and how this process affects the evolution of their central galaxies. For this purpose we have performed zoom-in N-body+baryon simulations of the formation and evolution of four galaxy-sized haloes with masses . The haloes were selected from a larger sample presented in paper I based on their mass-accretion history. Two of them continue growing in size until the present time, while the other two stopped doing so by . We refer to the first group as accreting haloes (Abu and Amun), and to the second one as stalled haloes (Siris and Supay).
Our main results can be summarised as follows:
-
1.
DM is acquired via smooth accretion and aggregation of satellites. As substructures penetrate the halo, their orbits are affected by dynamical friction and their mass content is eroded by tidal disruption. These effects reduce the amount of material that reaches the central region. At distances of 300 kpc for , infall and outflows balance each other for stalled haloes, while accreting haloes show recent important mergers. For both classes no net mass inflow is found in the central regions (kpc).
-
2.
Although gas experiences hydrodynamical effects (e.g., shock heating, stellar feedback), its accretion mimics the DM behaviour at the halo outskirts.
-
3.
In the central regions the distinction between stalled and accreting haloes is still present, but to a lesser degree. The former consistently acquire a factor of two less fresh gas (material that enters for the first time into the innermost 20 kpc) than the latter. [This holds true also at larger radii up to 100 kpc]. The infall rate of recycled material (i.e., gas that has been accreted at a given radius , ejected at and then re-accreted) decreases with time for stalled haloes during more than half of their lifetime. On the other hand, accreting haloes show a constant or slight increase in their inflow rates for the same period of time. Gas that has been shock heated cools down and ‘rains’ onto the central galaxy on relatively long time scales (comparable to the Hubble time). For this reason, gas accretion in the central regions does not accurately match what happens in the outskirts of the halo.
-
4.
The central galaxies have stellar masses of the order of at the present time, times smaller than the Milky Way (Licquia & Newman, 2015). They sit at the peak of the star formation efficiency of DM haloes as inferred using abundance matching.
-
5.
All galaxies present a stellar disc. Characterising them into their structural components, using either the density-profile-fitting method or kinematic decomposition, does not show a clear connection between the assembly time of the halo and the shape of its central galaxy. Supay and Amun are disc dominated while Abu and Siris are bulge dominated. The two grand-design spiral galaxies are found within the haloes with the largest spin parameters (see Table 1). This shows that there is no one-to-one correspondence between morphological type and environment (stalled haloes are found immerse in filaments while accreting ones at the junctions of two or more of them, as shown in paper I). Furthermore, observational signatures, drawn from the CAS statistics, do not show any clear difference between the different halo types.
-
6.
The negative metallicity gradients (see Table 2) indicate that discs formed inside-out. The smaller enrichment at the edges suggests that low SF takes place in these regions. Fig. 20 shows that the central parts were formed first, followed by the disc components. Present-day SF mainly takes place in the disc, with the exception of the disc in Siris in which SF has ceased since , but shows some minor contribution at the centre.
-
7.
The median stellar age of the disc component clearly reflects the halo assembly time. This quantity is older in the stalled haloes, where the disc started to be assembled by . This process is delayed until in the accreting haloes.
-
8.
The vertical profiles also present a clear difference between the two types of haloes. The stellar discs of the stalled ones are thicker by a factor of two with respect to their accreting counterparts. This is the result of the reduced supply of fresh gas, secular evolution and mostly the action of incoming satellites that puff up the stellar discs.
In summary, our study suggests that the median stellar ages and the vertical profiles of the discs could be used as a proxy for the halo assembly time. It would be interesting to explore whether assembly bias is detected when a galaxy population is split in terms of these variables, at least for the stellar ages since vertical scale-lenghts are more challenging to measure.
Our results, although lacking statistical support and being focussed on a narrow halo mass range, present interesting challenges for galaxy-formation models in which correlations between halo evolution, gas supply and quenching star-formation in the central galaxy are directly assumed. In particular, they warn us against making the naive association between haloes that have collapsed early (late) and red, early-type (blue, late-type) galaxies.
Acknowledgements
We thank Volker Springel for allowing the use of his code PGADGET-3 and the anonymous referee for their suggestions which improved the presentation of our results. We acknowledge support by the Deutsche Forschungsgemeinschaft through the SFB 956, ‘The Conditions and Impact of Star Formation’ and the TRR 33 ‘The Dark Universe’. MB thanks the Bonn-Cologne Graduate School for Physics and Astronomy for support. The authors acknowledge that the results of this research have been achieved using the PRACE-3IP project (FP7 RI-312763), using the computing resources (Cartesius) at SURF/SARA, The Netherlands.
References
- Abadi et al. (2003) Abadi M. G., Navarro J. F., Steinmetz M., Eke V. R., 2003, ApJ, 597, 21
- Adhikari et al. (2014) Adhikari S., Dalal N., Chamberlain R. T., 2014, J. Cosmology Astropart. Phys., 11, 019
- Aumer et al. (2013) Aumer M., White S. D. M., Naab T., Scannapieco C., 2013, MNRAS, 434, 3142
- Baldry et al. (2012) Baldry I. K., et al., 2012, MNRAS, 421, 621
- Behroozi et al. (2013a) Behroozi P. S., Wechsler R. H., Conroy C., 2013a, ApJ, 762, L31
- Behroozi et al. (2013b) Behroozi P. S., Wechsler R. H., Conroy C., 2013b, ApJ, 770, 57
- Benson (2012) Benson A. J., 2012, New Astron., 17, 175
- Birnboim & Dekel (2003) Birnboim Y., Dekel A., 2003, MNRAS, 345, 349
- Borzyszkowski et al. (2014) Borzyszkowski M., Ludlow A. D., Porciani C., 2014, MNRAS, 445, 4124
- Borzyszkowski et al. (2016) Borzyszkowski M., Porciani C., Romano-Diaz E., Garaldi E., 2016, preprint, (arXiv:1610.04231)
- Bournaud et al. (2009) Bournaud F., Elmegreen B. G., Martig M., 2009, ApJ, 707, L1
- Bower et al. (2006) Bower R. G., Benson A. J., Malbon R., Helly J. C., Frenk C. S., Baugh C. M., Cole S., Lacey C. G., 2006, MNRAS, 370, 645
- Bray et al. (2016) Bray A. D., et al., 2016, MNRAS, 455, 185
- Brook et al. (2014) Brook C. B., Stinson G., Gibson B. K., Shen S., Macciò A. V., Obreja A., Wadsley J., Quinn T., 2014, MNRAS, 443, 3809
- Brooks & Christensen (2016) Brooks A., Christensen C., 2016, Galactic Bulges, 418, 317
- Bullock et al. (2001) Bullock J. S., Dekel A., Kolatt T. S., Kravtsov A. V., Klypin A. A., Porciani C., Primack J. R., 2001, ApJ, 555, 240
- Cacciato et al. (2009) Cacciato M., van den Bosch F. C., More S., Li R., Mo H. J., Yang X., 2009, MNRAS, 394, 929
- Cacciato et al. (2013) Cacciato M., van den Bosch F. C., More S., Mo H., Yang X., 2013, MNRAS, 430, 767
- Chaves-Montero et al. (2016) Chaves-Montero J., Angulo R. E., Schaye J., Schaller M., Crain R. A., Furlong M., Theuns T., 2016, MNRAS, 460, 3100
- Ciotti & Bertin (1999) Ciotti L., Bertin G., 1999, A&A, 352, 447
- Cole et al. (2000) Cole S., Lacey C. G., Baugh C. M., Frenk C. S., 2000, MNRAS, 319, 168
- Conroy & Wechsler (2009) Conroy C., Wechsler R. H., 2009, ApJ, 696, 620
- Conselice (2003) Conselice C. J., 2003, ApJS, 147, 1
- Conselice (2014) Conselice C. J., 2014, ARA&A, 52, 291
- Crain et al. (2007) Crain R. A., Eke V. R., Frenk C. S., Jenkins A., McCarthy I. G., Navarro J. F., Pearce F. R., 2007, MNRAS, 377, 41
- Cresci et al. (2015) Cresci G., et al., 2015, A&A, 582, A63
- Dalal et al. (2008) Dalal N., White M., Bond J. R., Shirokov A., 2008, ApJ, 687, 12
- Dekel & Birnboim (2006) Dekel A., Birnboim Y., 2006, MNRAS, 368, 2
- Dekel et al. (2009) Dekel A., et al., 2009, Nature, 457, 451
- Di Matteo et al. (2005) Di Matteo T., Springel V., Hernquist L., 2005, Nature, 433, 604
- Diemer & Kravtsov (2014) Diemer B., Kravtsov A. V., 2014, ApJ, 789, 1
- Diemer et al. (2013) Diemer B., More S., Kravtsov A. V., 2013, ApJ, 766, 25
- Fabian (2012) Fabian A. C., 2012, ARA&A, 50, 455
- Fakhouri et al. (2010) Fakhouri O., Ma C.-P., Boylan-Kolchin M., 2010, MNRAS, 406, 2267
- Faucher-Giguère et al. (2011) Faucher-Giguère C.-A., Kereš D., Ma C.-P., 2011, MNRAS, 417, 2982
- Fossati et al. (2013) Fossati M., et al., 2013, A&A, 553, A91
- Gallazzi et al. (2005) Gallazzi A., Charlot S., Brinchmann J., White S. D. M., Tremonti C. A., 2005, MNRAS, 362, 41
- Gao et al. (2005) Gao L., Springel V., White S. D. M., 2005, MNRAS, 363, L66
- Garaldi et al. (2016) Garaldi E., Romano-Díaz E., Borzyszkowski M., Porciani C., 2016, astroph
- Gill et al. (2004) Gill S. P. D., Knebe A., Gibson B. K., 2004, MNRAS, 351, 399
- Guo et al. (2011) Guo Q., et al., 2011, MNRAS, 413, 101
- Haardt & Madau (2001) Haardt F., Madau P., 2001, in Neumann D. M., Tran J. T. V., eds, Clusters of Galaxies and the High Redshift Universe Observed in X-rays. (arXiv:astro-ph/0106018)
- Hahn & Abel (2011) Hahn O., Abel T., 2011, MNRAS, 415, 2101
- Hearin & Watson (2013) Hearin A. P., Watson D. F., 2013, MNRAS, 435, 1313
- Hearin et al. (2016) Hearin A. P., Zentner A. R., van den Bosch F. C., Campbell D., Tollerud E., 2016, MNRAS, 460, 2552
- Henriques et al. (2015) Henriques B. M. B., White S. D. M., Thomas P. A., Angulo R., Guo Q., Lemson G., Springel V., Overzier R., 2015, MNRAS, 451, 2663
- Ishibashi & Fabian (2012) Ishibashi W., Fabian A. C., 2012, MNRAS, 427, 2998
- Kauffmann et al. (2013) Kauffmann G., Li C., Zhang W., Weinmann S., 2013, MNRAS, 430, 1447
- Kazantzidis et al. (2008) Kazantzidis S., Bullock J. S., Zentner A. R., Kravtsov A. V., Moustakas L. A., 2008, ApJ, 688, 254
- Kennicutt (1998) Kennicutt Jr. R. C., 1998, ApJ, 498, 541
- Kereš et al. (2005) Kereš D., Katz N., Weinberg D. H., Davé R., 2005, MNRAS, 363, 2
- Kereš et al. (2009) Kereš D., Katz N., Fardal M., Davé R., Weinberg D. H., 2009, MNRAS, 395, 160
- Knobel et al. (2015) Knobel C., Lilly S. J., Woo J., Kovač K., 2015, ApJ, 800, 24
- Knollmann & Knebe (2009) Knollmann S. R., Knebe A., 2009, ApJS, 182, 608
- Kravtsov et al. (2004) Kravtsov A. V., Berlind A. A., Wechsler R. H., Klypin A. A., Gottlöber S., Allgood B., Primack J. R., 2004, ApJ, 609, 35
- Li et al. (2008) Li Y., Mo H. J., Gao L., 2008, MNRAS, 389, 1419
- Licquia & Newman (2015) Licquia T. C., Newman J. A., 2015, ApJ, 806, 96
- MacArthur et al. (2003) MacArthur L. A., Courteau S., Holtzman J. A., 2003, ApJ, 582, 689
- Maller et al. (2006) Maller A. H., Katz N., Kereš D., Davé R., Weinberg D. H., 2006, ApJ, 647, 763
- Mandelbaum et al. (2006) Mandelbaum R., Seljak U., Kauffmann G., Hirata C. M., Brinkmann J., 2006, MNRAS, 368, 715
- Marinacci et al. (2014) Marinacci F., Pakmor R., Springel V., 2014, MNRAS, 437, 1750
- McGaugh (2012) McGaugh S. S., 2012, AJ, 143, 40
- McGaugh et al. (2010) McGaugh S. S., Schombert J. M., de Blok W. J. G., Zagursky M. J., 2010, ApJ, 708, L14
- Mendez-Abreu et al. (2016) Mendez-Abreu J., et al., 2016, preprint, (arXiv:1610.05324)
- Metuki et al. (2015) Metuki O., Libeskind N. I., Hoffman Y., Crain R. A., Theuns T., 2015, MNRAS, 446, 1458
- Minchev et al. (2015) Minchev I., Martig M., Streich D., Scannapieco C., de Jong R. S., Steinmetz M., 2015, ApJ, 804, L9
- More et al. (2013) More S., van den Bosch F. C., Cacciato M., More A., Mo H., Yang X., 2013, MNRAS, 430, 747
- More et al. (2015) More S., Diemer B., Kravtsov A. V., 2015, ApJ, 810, 36
- Moster et al. (2013) Moster B. P., Naab T., White S. D. M., 2013, MNRAS, 428, 3121
- Murali et al. (2002) Murali C., Katz N., Hernquist L., Weinberg D. H., Davé R., 2002, ApJ, 571, 1
- Peirani et al. (2012) Peirani S., Jung I., Silk J., Pichon C., 2012, MNRAS, 427, 2625
- Peng et al. (2010) Peng Y.-j., et al., 2010, ApJ, 721, 193
- Petrosian (1976) Petrosian V., 1976, ApJ, 209, L1
- Planck Collaboration et al. (2014) Planck Collaboration et al., 2014, A&A, 571, A1
- Purcell et al. (2010) Purcell C. W., Bullock J. S., Kazantzidis S., 2010, MNRAS, 404, 1711
- Qu et al. (2011) Qu Y., Di Matteo P., Lehnert M. D., van Driel W., 2011, A&A, 530, A10
- Reddick et al. (2013) Reddick R. M., Wechsler R. H., Tinker J. L., Behroozi P. S., 2013, ApJ, 771, 30
- Romano-Díaz et al. (2009) Romano-Díaz E., Shlosman I., Heller C., Hoffman Y., 2009, ApJ, 702, 1250
- Romano-Díaz et al. (2010) Romano-Díaz E., Shlosman I., Heller C., Hoffman Y., 2010, ApJ, 716, 1095
- Romano-Díaz et al. (2014) Romano-Díaz E., Shlosman I., Choi J.-H., Sadoun R., 2014, ApJ, 790, L32
- Sales et al. (2012) Sales L. V., Navarro J. F., Theuns T., Schaye J., White S. D. M., Frenk C. S., Crain R. A., Dalla Vecchia C., 2012, MNRAS, 423, 1544
- Scannapieco et al. (2008) Scannapieco C., Tissera P. B., White S. D. M., Springel V., 2008, MNRAS, 389, 1137
- Scannapieco et al. (2012) Scannapieco C., et al., 2012, MNRAS, 423, 1726
- Sérsic (1963) Sérsic J. L., 1963, Boletin de la Asociacion Argentina de Astronomia La Plata Argentina, 6, 41
- Sheth & Tormen (2004) Sheth R. K., Tormen G., 2004, MNRAS, 350, 1385
- Sijacki et al. (2007) Sijacki D., Springel V., Di Matteo T., Hernquist L., 2007, MNRAS, 380, 877
- Somerville & Primack (1999) Somerville R. S., Primack J. R., 1999, MNRAS, 310, 1087
- Somerville et al. (2008) Somerville R. S., Hopkins P. F., Cox T. J., Robertson B. E., Hernquist L., 2008, MNRAS, 391, 481
- Springel (2005) Springel V., 2005, MNRAS, 364, 1105
- Springel & Hernquist (2002) Springel V., Hernquist L., 2002, MNRAS, 333, 649
- Springel & Hernquist (2003) Springel V., Hernquist L., 2003, MNRAS, 339, 289
- Tinker et al. (2005) Tinker J. L., Weinberg D. H., Zheng Z., Zehavi I., 2005, ApJ, 631, 41
- Tremonti et al. (2004) Tremonti C. A., et al., 2004, ApJ, 613, 898
- Vale & Ostriker (2004) Vale A., Ostriker J. P., 2004, MNRAS, 353, 189
- Villaescusa-Navarro et al. (2014) Villaescusa-Navarro F., Marulli F., Viel M., Branchini E., Castorina E., Sefusatti E., Saito S., 2014, J. Cosmology Astropart. Phys., 3, 011
- Villalobos & Helmi (2008) Villalobos Á., Helmi A., 2008, MNRAS, 391, 1806
- Vogelsberger et al. (2009) Vogelsberger M., White S. D. M., Mohayaee R., Springel V., 2009, MNRAS, 400, 2174
- Wechsler et al. (2006) Wechsler R. H., Zentner A. R., Bullock J. S., Kravtsov A. V., Allgood B., 2006, ApJ, 652, 71
- Weinmann et al. (2006) Weinmann S. M., van den Bosch F. C., Yang X., Mo H. J., 2006, MNRAS, 366, 2
- White & Frenk (1991) White S. D. M., Frenk C. S., 1991, ApJ, 379, 52
- White & Rees (1978) White S. D. M., Rees M. J., 1978, MNRAS, 183, 341
- Yepes et al. (1997) Yepes G., Kates R., Khokhlov A., Klypin A., 1997, MNRAS, 284, 235
- Zemp (2014) Zemp M., 2014, ApJ, 792, 124
- Zolotov et al. (2010) Zolotov A., Willman B., Brooks A. M., Governato F., Hogg D. W., Shen S., Wadsley J., 2010, ApJ, 721, 738
- van de Voort et al. (2011) van de Voort F., Schaye J., Booth C. M., Haas M. R., Dalla Vecchia C., 2011, MNRAS, 414, 2458
- van der Kruit (1988) van der Kruit P. C., 1988, A&A, 192, 117