Colour gradients in cluster ellipticals at z 1.4:
the hidden content of the galaxy central regions
Abstract
We present F775W-F850LP (rest-frame UV-U) and F850LP-F160W (rest-frame U-R) colour gradients for a sample of 17 elliptical galaxies morphologically selected in the cluster XMMU J2235.3-2557 at =1.39. We detected significant negative (redder inwards) U-R colour gradients in 70 per cent of the galaxies and flat gradients for the remaining ones. On the other hand, the UV-U gradients are significant positive (bluer inwards) for 80 per cent of the galaxies and flat for the remaining ones. Using stellar population synthesis models, we found that the behaviour of the two colour gradients cannot be simultaneously explained by a radial variation of age, metallicity and/or dust. The observed U-R gradients are consistent with a metallicity gradient (mean value ) in agreement with the one observed in the local elliptical galaxies. The positive UV-U gradients cannot be explained with age or metallicity variations and imply an excess of UV emission towards the galaxies’ central regions. This excess calls into question mechanisms able to efficiently produce UV emission. The data require either steady weak star formation ( M⊙ yr-1) or an He-rich population in the cores of these galaxies in order to simultaneously reproduce both the colour gradients. On the contrary, the presence of a QSO cannot account for the observed UV excess on its own. We discuss these hypotheses on the basis of current observations and available models.
keywords:
galaxies: ellipticals – galaxies: evolution – galaxies: high redshift – galaxies: stellar content1 Introduction
The mass assembly and the shaping of the elliptical morphology of early-type galaxies (ellipticals and lenticulars) are not yet completely understood and they represent an important challenge for observational cosmology. Colour gradients represent a powerful tool to constrain the possible mechanisms ruling these two processes. The presence of colour gradients indicates that the properties of the stellar population within galaxy are not homogeneous. Stars may not have been formed in a single burst of star formation, or may have been formed in regions characterized by different physical conditions of the interstellar medium (ISM), or be the result of later episodes of accretion of small satellites. The different mechanisms of mass assembly that may have taken place affect in different way the internal distribution of stellar populations probed by the colour gradients.
If elliptical galaxies are formed in dissipational scenarios, such as gas-rich major mergers in which most (80 per cent) of the stars are formed in a dissipative central starburst (e.g. Khochfar & Silk, 2006; Naab et al., 2007; Sommer-Larsen & Toft, 2010), or from primordial mergers of lumps of dark and baryonic matter occurring at very early epochs () (e.g. Chiosi & Carraro, 2002; Pipino & Matteucci, 2004; Merlin & Chiosi, 2006; Merlin et al., 2012), the radial variation of their stellar populations resembles the one expected in the classical monolithic scenario (Eggen et al., 1962). In this scenario, gas is more efficiently retained in the centre of the galaxy and thus fuels both more prolonged star formation and chemical evolution, resulting in a negative metallicity gradient (galaxies are more metal-rich in the centre) and a mild positive age gradient (the mean age of stellar populations is younger in the centre) (Kobayashi, 2004).
However, this early phase dominated by in situ star formation could be followed by an extended phase of ex situ accretion of stars from dry minor mergers with smaller satellite stellar systems, as recently proposed by e.g. Oser et al. (2010). In this case, the above gradients could be strongly affected. In this two-phase process, early-type galaxies continue to grow from the inside-out redistributing the stellar content of the satellites in the outer regions, without mixing with the pre-existing central bulge. However, given the stochastic nature of merger, the resulting galaxies will not show systematics in their colour variation: if age and metallicity of the satellite stellar systems are similar to the central early-type galaxy, the gradients may flatten or, opposite, steepen if the satellites are younger.
In the classical hierarchical merging scenario (e.g. Kauffmann, 1996; De Lucia et al., 2006), early-type galaxies form by the wet (gas-rich) major mergers of disk galaxies. During these mergers, star formation in situ is triggered by gas cooling and shock heating (e.g. Dekel & Birnboim, 2006; Cattaneo et al., 2008) and provides only a minor fraction of the final stellar mass of the remnant, whose stars come principally from the disc progenitors. These major mergers will tend to mix the stellar content of the progenitors producing nearly flat gradients in the remnant. Hereafter, the remnant may later experience minor dry mergers whose effects are those discussed above.
The environment also plays an important role in the evolution of elliptical galaxies. Some theoretical studies suggest that ellipticals in dense environment are formed through bursts of star formation at , unlike field ellipticals that are formed through major mergers of disk galaxies at lower redshift (e.g. < 2) (e.g. Peacock, 1999). These different formation patterns would produce different colour gradients as discussed above. Field and cluster galaxies also experience different evolutionary processes due to the different environment. Cluster galaxies, unlike field galaxies, are subject to two main classes of processes: first, the gravitational ones, including the tidal interactions (galaxy–galaxy, galaxy–cluster, harassment) (e.g. Fujita, 1998; Merritt, 1983, 1984; Mihos, 1995) and, secondly, the interactions taking place between the galaxy’s ISM and the hot intergalactic medium (ram pressure, thermal evaporation, etc.) (e.g. Gunn & Gott, 1972; Abadi et al., 1999; Cowie & Songaila, 1977; Dressler & Gunn, 1983). Processes like ram pressure stripping or thermal evaporation, removing the gas reservoir from the galaxy, can lead to a rapid quenching of star formation (e.g. Larson et al., 1980; Drake et al., 2000). These processes can either act at global galaxy scale or involve only a region of the galaxy, introducing a gradient of the stellar population properties (mainly age), whose steepness depends on the fraction of gas removed.
All these different predictions show how spatially resolving the properties of the stellar populations within the galaxies may therefore constrain the history of mass assembly and evolution of elliptical galaxies.
Colour gradients in local early-type galaxies have been extensively studied during the last 30 years. Local and intermediate redshift elliptical galaxies show negative optical or optical-NIR rest-frame colour gradients (e.g., B-R, U-R, V-K), i.e. they are redder towards the centre. Almost all these works agree on the fact that a metallicity gradient is the main driver of the observed colour variation (e.g. Peletier et al., 1990; Tamura & Ohta, 2000; Saglia et al., 2000; Wu et al., 2005; La Barbera et al., 2005; Tortora et al., 2010): the cores are metal-rich compared to the outer region. A few studies have also found that slightly positive age gradients, in addition to the metallicity gradient, are necessary to explain the observed radial colour variation, i.e. early-type galaxies tend to have younger and more metal-rich cores (e.g. Clemens et al., 2009; Rawle et al., 2010; La Barbera & de Carvalho, 2009). However, the contribution played by radial age variation is still controversial.
The presence or otherwise of an age gradient is a key piece in understanding of the mass assembly of elliptical galaxies. However, its detection in low redshift galaxies is a challenging task: an age variation of 1–2 Gyr in a stellar population with a mean age of about 8–9 Gyr reflects a variation of 0.05 mag in the U-R colour, much smaller than the one produced by the observed metallicity gradient and comparable to typical photometric errors.
On the contrary, a variation of just 1 Gyr in a stellar population 2–3 Gyr old, as in ellipticals at 1.5, would produce a colour variation of 0.2 mag, comparable to the one produced by a metallicity variation (see Section 5). Hence, an age variation, if present, would be detectable in high redshift early-type galaxies. Hence, age gradients, if present, would be more easily detectable in high redshift galaxies.
Only a few studies of colour gradients in high-redshift elliptical galaxies have been carried out so far. Gargiulo et al. (2012) studied the rest-frame optical U-R and UV-U (Gargiulo et al., 2011) colour gradients in a sample of field ellipticals at 1 < < 2 and they found that only for half of the sample an age/metallicity gradient can account for the observed gradients. For the remaining half of the sample, the variation of more than one parameter is required to account for the observed colour variation. Recently, Chan et al. (2016) found that the rest-frame optical U-R colour gradients in passive cluster galaxies at =1.39 are mostly negative, with a median value twice the value in the local Universe (Wu et al., 2005). To reproduce the colour gradients locally observed, the presence of both age and metallicity gradient is needed. It is a conclusion also reached by De Propris et al. (2015, 2016) in cluster early-type galaxies at , where age gradients were associated with the presence of disc-like morphologies.
In this paper, we jointly studied the rest-frame UV-U and U-R colour gradients for a sample of 17 elliptical galaxies morphologically selected in the cluster XMMU J2235.3-2557 at =1.39. Here, we focus on the study of the colour gradients in cluster ellipticals at , while we refer to a forthcoming paper for their evolution to =0. Our colour gradients are derived from optical and near-IR data for this cluster in the Hubble Space Telescope (HST) archive (see the next section).
This paper is organized as follows. In Section 2 we describe the data and the sample selection. In Section 3 we derive the physical (stellar mass, age, absolute magnitudes) and structural (effective radius, index of concentration ) parameters of the galaxies of our sample. In Section 4 we derive the colour gradients with different methods. In Sections 5 and 6 we investigate the origin of the observed colour gradients showing the key role played by the UV-U colour variation in the reconstruction of the history of the mass assembly of elliptical galaxies. In Section 7 we compare our results with previous works. In Section 8 we summarize our results and present our conclusions.
Throughout this paper magnitudes are in the Vega system and we used a standard cosmology with km s-1 Mpc-1, and . With these parameters, the age of the Universe at z = 1.39 is 4.5 Gyr.
2 Data description
2.1 Optical and near-IR data
The analysis presented in this paper is based on data obtained from the Hubble Space Telescope (HST), Spitzer Space Telescope data and the Very Large Telescope (VLT).
The HST data are composed of archival images of cluster XMMUJ2235-2557 (Mullis et al., 2005) at = 1.39 obtained with the Advanced Camera for Surveys (ACS) in the F775W (5060 s) and F850LP (6240 s) filters ( and hereafter) and with the Wide Field Camera 3 (WFC3) in the F160W (1200 s) filter. The ACS images have a pixel scale of 0.05 arcsec pixel-1 and a resolution of FWHM850 0.11 arcsec. ACS observations cover a field of about 11 arcmin2 surrounding the cluster, while WFC3 observations a field of about 5 arcmin2. At , the ACS F775W and F850LP bands probe the younger stellar populations in the near UV, while the WFC3 F160W closely corresponds to the rest-frame R band and traces the older stellar populations in these galaxies. The original WFC3 images have a pixel scale of 0.123 arcsec pixel-1 and a resolution FWHM arcsec. We have re-reduced these images with the software multidrizzle (Koekemoer et al., 2003) to match the pixel scale of the ACS images (0.05 arcsec pixel-1), checking that the procedure had not introduced any spurious effects and conserved the flux.
VLT High Acuity Wide field K-band Imager (HAWK-I) observations covering a 1313 arcmin2 region centred on the cluster were obtained in the J and Ks filters ( s each) under excellent seeing conditions (FWHM(J) 0.5 arcsec and FWHM(Ks) 0.35 arcsec). These data are described in Lidman et al. (2008) and Lidman et al. (2013).
U-band data were obtained from VIMOS at VLT, for a total exposure of 21000 s and FWHM of 0.7 arcsec (see Nonino et al., 2009, for details).
Spitzer data in all four Infrared Array Camera (IRAC) bandpasses (3.6, 4.5, 5.8 and 8.0 m) were retrieved as fully reduced images from the Spitzer Science Archive, with exposure times of 2000 s in all bands.
ID RA Dec 358 22:35:27.003 -25:58:14.11 —- 595 22:35:26.220 -25:56:45.54 —- 684 22:35:25.804 -25:56:46.00 —- 692 22:35:25.680 -25:56:58.48 —- 837 22:35:24.895 -25:56:37.03 —- 1284 22:35:22.814 -25:56:24.92 —- 1539 22:35:22.472 -25:56:15.17 —- 1740 22:35:20.839 -25:57:39.76 1.39 1747 22:35:20.588 -25:58:20.68 —- 1758 22:35:20.920 -25:57:35.90 1.39 1782 22:35:20.707 -25:57:44.43 1.39 1790 22:35:20.707 -25:57:37.70 —- 2054 22:35:19.078 -25:58:27.32 —- 2147 22:35:19.046 -25:57:51.42 —- 2166 22:35:18.168 -25:59:05.89 —- 2429 22:35:17.867 -25:56:13.06 —- 2809 22:35:18.251 -25:56:06.17 —-
2.2 Sample selection
ID U J Ks m3.6 m4.5 m5.8 m8.0 358 28 99 24.850.05 23.910.04 22.140.1 — 20.410.05 19.840.1 19.690.1 19.530.4 19.330.4 595 27.80.3 23.170.02 22.160.01 20.230.03 19.350.03 18.350.01 16.700.1 16.230.1 15.990.1 15.940.2 684 25.90.1 24.190.03 23.330.03 21.920.07 21.100.06 20.110.03 18.150.02 17.790.03 17.310.1 17.410.2 692 28 99 24.800.06 23.750.04 21.900.08 21.120.06 19.970.03 18.690.1 18.460.1 18.290.3 18.030.3 837 28 99 23.760.03 22.770.03 20.590.05 19.830.04 18.610.02 16.990.01 16.490.02 16.380.08 16.100.1 1284 28 99 23.650.02 22.700.02 20.910.04 20.220.04 19.160.02 17.560.01 17.090.02 16.770.09 16.840.1 1539 26.020.1 23.860.02 23.010.02 21.280.05 — 19.340.02 17.630.01 17.200.03 17.140.1 16.870.1 1740 24.30 0.05 22.420.02 21.480.02 18.550.02 18.680.02 17.440.01 15.600.1 15.170.1 15.170.1 14.820.2 1747 28 99 24.790.05 23.700.04 22.060.09 21.250.06 20.080.03 18.730.02 18.410.04 18.560.3 99.0099.0 1758 28 99 24.160.03 23.130.02 20.460.04 20.330.04 19.090.01 17.580.1 17.140.1 16.700.1 16.890.2 1782 24.60.5 23.450.02 22.490.02 19.970.03 19.600.04 18.400.01 16.990.1 16.580.1 16.550.1 16.490.2 1790 28 99 23.220.02 22.250.02 19.700.02 19.350.03 18.180.01 16.340.1 15.910.1 15.910.1 15.560.2 2054 28 99 23.430.02 22.430.02 20.670.03 19.860.04 18.830.01 16.960.01 16.610.03 16.270.1 15.790.1 2147 28 99 23.780.03 22.770.03 20.900.04 20.150.04 19.020.02 16.820.02 16.360.03 16.370.1 15.420.1 2166 26.500.1 22.800.01 21.730.01 20.530.03 — 18.730.01 17.330.01 17.130.03 17.020.1 16.680.1 2429 28 99 24.410.03 23.240.02 21.960.08 21.040.06 20.050.03 18.150.02 17.980.04 17.910.2 17.360.2 2809 28 99 23.410.01 22.330.01 20.920.03 — 19.280.01 18.360.1 17.990.1 17.960.2 16.710.2
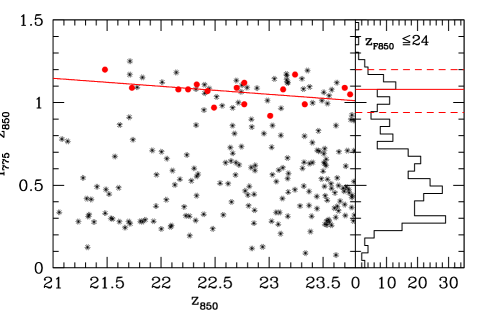
Our sample consists of 17 galaxies that we have selected to belong to the cluster XMMUJ2235-2557 at (Mullis et al., 2005; Rosati et al., 2009). We selected our final sample following the criteria described in Saracco et al. (2014). Briefly, we first detected all the sources () in the F850LP band image up to the magnitude limit in the arcmin2 region surrounding the cluster. We ran SExtractor (Bertin & Arnouts, 1996) in double image mode on the F850LP and F775W band images, using the F850LP band image as the reference image and adopted the mag_best as our fiducial estimate of total magnitude. In order to perform a reliable and robust visual morphological classification, we selected galaxies with magnitudes . At this magnitude limit, the sample is 100 per cent complete. From this flux limited sample we removed stars using SExtractor’s stellarity index (class_star > 0.9) and we only considered galaxies within Mpc ( arcsec) from the cluster centre. This leaves 352 galaxies, 219 of which also have IR data from WFC3. This sample contains the 5 central cluster member galaxies spectroscopically confirmed by Rosati et al. (2009), three out of which, 1740, 1758 and 1782 of Table 1, are ellipticals (see below for the morphological classification). The mean colour of these five cluster member ETGs is with a dispersion . This colour well traces the redshift of the galaxies. In particular, for z < 0.8 the colour is always < 0.8 mag, while for z > 0.8 - 0.9 its value rapidly increases and remains always > 0.8 mag, independently of the age of the stellar population considered (see e.g. Saracco et al., 2014). In Fig. 1 (right panel) we show the colour distribution of the 352 galaxies with , which reflects the behaviour described above. Two peaks are present. We selected all the galaxies in the colour range mag defining the second peak of the colour distribution centred at the mean colour (marked by red solid line in the figure) of the five red sequence member galaxies. The dashed red lines represent from the mean colour of the five cluster members.
According to these criteria, 50 galaxies have been selected as cluster member candidates. Thus, in order to identify the elliptical galaxies, we have performed a morphological classification based on the visual inspection of the galaxies on the ACS-F850LP image and on the fitting of their surface brightness profile as described in Section 3.2. We regard galaxies as ellipticals if they have regular shapes, no signs of a disc and smooth residuals after profile fitting and model subtraction. On this basis, 17 galaxies out of the 50 turned out to be ellipticals. The sample is summarized in Table 1.
Fig. 1 (left panel) shows the - colours of the 17 selected ellipticals (red points) as a function of together with those of the 352 galaxies with (black asterisks). The selected ellipticals define a red sequence, as expected. The solid red line is the colour-magnitude relation ( - ) = 2.16(0.58) - 0.048(0.026) best fitting the 17 ellipticals.
2.3 Multiwavelength photometry
We measured the magnitudes for the 17 galaxies selected in all the available bands using SExtractor. We adopted the mag_best as the best estimator of the magnitude.
As mentioned in Section 2.1, the field of view of the WFC3 is smaller than the ACS field (5 arcmin2 instead of 11 arcmin2); hence, only 13 ellipticals out of the 17 are covered by WFC3 observations, with galaxies 358, 1539, 2166 and 2809 falling outside.
VIMOS U-band observations cover the whole sample to a limiting depth of U . Thank to this depth, we detected six galaxies at this wavelength.
HAWKI J- and Ks-band images cover the whole sample. Thanks to the excellent resolution of the images all the galaxies are resolved in both the filters.
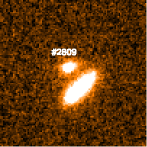
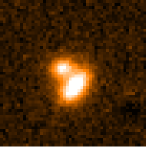
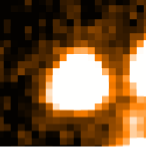
Also Spitzer-IRAC observations cover the whole sample. Magnitudes have been estimated in the four IRAC bands using SExtractor in double image mode adopting the 3.6 m image as reference. We have tested for the reliability of the flux measurement by comparing the flux of some stars in the field measured with Sextractor with the flux obtained using the IRAF task phot. Due to the low resolution (FWHM > 2.7 arcsec), eight galaxies (2809, 595, 692, 358, 1740, 1790, 1782 and 1758) are not resolved but appear fully blended with other close sources. For these galaxies, we have derived their magnitudes in the four IRAC bands by redistributing the total IRAC flux of the blended sources according the fluxes measured for each of them in the F160W and Ks filters. In Fig. 2 we show as example galaxy 2809, which is closed to another galaxy, in the ACS-F850LP (left panel), HAWKI J (central panel) and Spitzer-IRAC 3.6 m (right panel) images. The two galaxies are clearly resolved in the F850LP and in the HAWKI J band images, while they are fully blended in the Spitzer-IRAC 3.6 m image.
In Table 2 we report the photometry in the 10 photometric bands for the 17 ellipticals of the sample.
3 Physical and structural parameters
3.1 Global physical properties of galaxies
For each galaxy we derived the mean global stellar parameters (stellar mass, age, absolute magnitudes) by fitting the spectral energy distribution (SED) defined by the 10 available photometric points. The fit has been performed with the software hyperzmass (Bolzonella et al., 2000) using a set of templates characterized by the composite stellar population models of Bruzual & Charlot (2003, hereafter BC03), the Chabrier initial mass function (IMF) (Chabrier, 2003), an exponentially declining star formation history (SFH ). In all the cases, we considered five star formation time-scale ( Gyr) and solar metallicity Z⊙. For the extinction curve we adopted the Calzetti law (Calzetti et al., 2000), with left as a free parameter and allowed to vary in the range 0.0 to 0.6 mag.
The F775W, F850LP and F160W bands sample Å, Å and Å, respectively, at the cluster redshift. Hence, we derived absolute magnitudes in UV, U and R bands (MUV, MU and MR, respectively), with a correction derived from the best fitting template. In Table 3 we report the best-fitting values for the age, the logarithm of the stellar mass, MUV, MU and MR for the 17 galaxies of the sample.
For 14 galaxies out of the 17, the best fitting template is defined by a SFH with Gyr, while the remaining three galaxies are characterized by SFHs with Gyr (837 and 1539) and with Gyr (1740). The 17 ellipticals have stellar masses in the range M M⊙ with a mean value M⊙ and ages in the range 0.7 Gyr < age 4.3 Gyr with a mean value of Gyr.
ID Age log [Gyr] [M⊙] [mag] [mag] [mag] 358 0.72 10.08 -20.14 -20.19 -21.18 595 3.00 11.56 -21.83 -21.95 -23.62 684 1.70 10.56 -20.71 -20.79 -21.91 692 1.14 10.56 -20.23 -20.35 -21.87 837 2.50 11.47 -21.22 -21.36 -23.22 1284 1.01 11.05 -21.29 -21.41 -22.88 1539 1.80 11.01 -21.07 -21.15 -22.67 1740 3.50 11.93 -22.56 -22.65 -24.39 1747 1.02 10.55 -20.22 -20.34 -21.77 1758 1.80 11.14 -20.85 -20.99 -22.73 1782 1.90 11.57 -21.52 -21.65 -23.43 1790 4.25 11.60 -21.76 -21.89 -23.71 2054 1.70 11.22 -21.55 -21.66 -23.21 2147 1.14 11.01 -21.20 -21.31 -22.90 2166 0.90 10.99 -22.19 -22.27 -23.39 2429 0.72 10.58 -20.66 -20.76 -21.98 2809 0.65 10.73 -21.59 -21.67 -22.74 Mean 1.73 10.45 -21.21 -21.32 -22.80
3.2 Structural parameters
ID R R (b/a)850 R [mag] [kpc] [mag] [kpc] [mag] [kpc] 358 6.00.4 24.50.2 1.10.1 6.00.4 23.50.1 1.50.2 0.60.1 — — — " — 24.80.2 0.80.1 4.0 23.70.1 1.00.2 — — — — 595 5.70.3 22.90.1 2.20.3 5.60.3 21.60.1 3.50.5 0.90.1 4.50.1 19.20.1 2.50.1 " — 23.10.1 1.50.3 4.0 21.90.1 2.20.5 — — 19.20.1 2.30.1 684 6.00.4 24.00.2 0.70.1 6.00.4 22.90.1 1.40.2 0.60.1 4.10.1 20.90.1 0.80.1 " — 24.20.2 0.50.1 4.0 23.10.1 1.00.2 — — 20.90.1 0.80.1 692 4.50.2 24.30.2 1.30.1 4.10.2 23.50.2 1.50.2 0.70.1 3.00.1 21.00.1 0.90.1 " — 24.70.2 1.30.1 4.0 23.50.2 1.50.2 — — 20.90.1 1.10.1 837 6.00.2 23.30.1 5.20.6 6.00.4 21.90.1 7.81.1 0.70.1 6.00.2 19.40.1 5.20.2 " — 23.60.1 2.30.6 4.0 22.30.1 8.01.1 — — 19.70.1 7.20.2 1284 4.30.3 23.40.1 1.80.3 4.30.2 22.30.1 2.40.3 0.90.1 4.00.1 20.00.1 1.70.1 " — 23.40.1 1.90.3 4.0 22.30.1 2.30.3 — — 20.00.1 1.70.1 1539 4.80.3 23.70.2 1.10.1 3.50.2 22.70.1 1.50.2 0.60.1 — — — " — 23.80.2 1.00.1 4.0 22.60.1 1.70.2 — — — — 1740 3.30.2 21.80.1 12.71.9 3.30.2 20.80.1 12.81.9 0.60.1 4.60.1 17.80.1 20.70.9 " — 21.50.1 20.12.0 4.0 20.50.1 19.51.9 — — 18.00.1 15.40.9 1747 4.30.2 24.60.2 0.80.1 4.80.3 23.30.1 1.70.2 0.60.1 4.00.2 21.10.1 0.90.1 " — 24.70.2 0.70.1 4.0 23.40.1 1.50.2 — — 21.10.1 0.90.1 1758 2.90.2 23.90.2 1.90.2 2.90.2 22.60.1 2.50.3 0.80.1 2.900.04 20.30.1 1.50.1 " — 23.70.2 1.90.2 4.0 22.40.1 3.80.3 — — 20.10.1 1.00.1 1782 2.50.2 23.50.1 1.70.1 3.60.2 22.50.1 3.40.5 0.60.1 3.110.04 19.40.1 2.20.1 " — 22.90.1 3.40.1 4.0 22.00.1 3.50.5 — — 19.40.1 2.00.1 1790 4.40.3 23.10.1 1.90.2 4.40.3 21.90.1 2.40.3 0.60.1 4.10.1 19.30.1 2.30.1 " — 23.20.1 1.80.2 4.0 22.00.1 2.20.3 — — 19.30.1 2.20.1 2054 5.10.3 23.20.1 2.90.4 4.40.3 21.90.1 4.20.6 0.70.1 5.10.1 19.50.1 3.70.2 " — 23.30.1 2.20.4 4.0 22.00.1 3.70.6 — — 19.60.1 2.90.2 2147 5.40.3 23.50.1 3.60.5 5.30.3 22.20.1 5.30.8 0.70.1 4.10.1 20.00.1 2.30.1 " — 23.70.1 2.30.5 4.0 22.40.1 3.40.8 — — 20.00.1 2.30.1 2166 3.60.2 22.60.1 1.20.1 3.00.2 21.50.1 1.40.1 0.60.1 — — — " — 22.60.1 1.30.1 4.0 21.40.1 1.70.1 — — — — 2429 2.10.4 24.30.2 0.70.1 2.10.2 23.00.1 0.90.1 0.60.1 2.10.1 21.00.1 0.90.1 " — 24.30.2 0.70.1 4.0 22.80.1 1.20.1 — — 20.90.1 1.00.1 2809 4.80.3 23.30.1 1.20.1 3.20.2 22.70.1 1.40.2 0.60.1 — — — " — 23.30.1 1.10.1 4.0 22.00.1 1.60.2 — — — —
We derived the structural parameters of the ellipticals of our sample by fitting their surface brightness profile with a single Sérsic law
| (1) |
in the F775W, F850LP and F160W bands. The two-dimensional fitting has been performed using galfit software (Peng et al., 2002), which returns as best-fitting set of structural parameters the one that minimizes the residuals between the model convolved with the PSF and the observed image. A detailed description of this procedure may be found in Appendix A. The fitting was performed both assuming as a free parameter and assuming = 4 (appropriate for ellipticals that have a de Vaucouleurs profile). In order to test for the dependence of our results on the PSF used, for each galaxy we have convolved the Sérsic profile with two different PSFs, derived empirically (as recommended in the galfit manual) from two bright, unsaturated and uncontaminated stars in the field. The residual maps lacked of any structure in both the cases and the returned values were not statistically different, showing that the results do not depend on the PSF used. Thus, we chose the mean values of the fitting results as best fitting value for the structural parameters. The structural parameters obtained through the fit are shown in Table 6.
In order to measure colour gradients (see Section 4), we need to measure the radial surface brightness profiles in ellipses having the same orientation and ellipticity in all bands in order to prevent any artificial gradients. Hence, we re-run galfit on the F775W and the F160W images fixing the position angle and the axial ratio to those derived for the F850LP image. We choose the F850LP image as reference band because it has better resolution (FWHM arcsec) and the smallest pixel scale (0.05 arcsec pixel-1). Moreover, given the shallower surface brightness, it determines the maximum radius at which we can reliably estimate radial gradients (see discussion in the next section). In Table 4 we show for each galaxy the best-fitting , [kpc] and in the F775W, F850LP and F160W bands obtained taking as reference the position angle and the axis ratio derived in the F850LP image. In the same table, we also show in the second row the parameters obtained assuming , i.e. de Vaucouleur’s profile. The effective radii , as derived by fitting the Sérsic law in the F850LP image, are in the range 0.9-7.8 kpc, with the exception of the dominant central galaxy of the cluster, which has an effective radius Re = 12.8 kpc. The Sérsic index varies in the range 2.1 - 6, while the total magnitude varies in the range 20.78 - 23.47 mag.
We have tested the reliability of the surface brightness profile fitting and we have estimated the uncertainties on the structural parameters by using simulated galaxies, as described in Appendix A.1.
4 Colour gradients
ID 358 0.20.1 0.30.2 – – -0.2 – 595 0.40.2 0.40.2 -0.10.1 -0.20.2 -0.2 0.1 684 0.60.1 0.60.2 -0.30.1 -0.50.2 -0.4 0.2 692 0.20.2 0.20.2 -0.30.1 -0.50.3 -0.1 0.2 837 0.40.3 0.40.3 -0.30.2 -0.30.2 -0.3 0.2 1284 0.20.1 0.20.2 -0.30.1 -0.30.2 -0.1 0.2 1539 0.50.2 0.40.2 – – -0.1 – 1740 0.00.2 0.00.2 0.050.10 0.060.2 0.02 -0.2 1747 0.70.2 0.80.3 -0.40.1 -0.60.2 -0.4 0.3 1758 0.40.2 0.50.2 -0.70.2 -0.70.3 -0.1 0.2 1782 0.60.1 1.00.3 -0.30.2 -0.40.2 -0.3 0.2 1790 0.20.1 0.20.2 0.00.1 -0.040.02 -0.1 0.2 2054 0.50.1 0.40.2 -0.20.2 -0.20.2 -0.2 0.1 2147 0.30.2 0.30.3 -0.60.3 -0.70.3 -0.1 0.1 2166 0.30.1 0.30.2 – – -0.2 – 2429 0.50.1 0.60.1 0.000.04 0.00.1 -0.1 0.4 2809 0.50.1 0.40.2 – – -0.2 –


For each of the 17 galaxies of the sample we have derived F775W - F850LP and F850LP - F160W colour gradients, corresponding to (UV-U) and (U-R) in the rest-frame. The transformations to obtain the rest-frame colours are: UV-U= (F775W-F850LP) - 0.8 mag and U-R = (F850LP-F160W) - 1.1 mag.
We have used three different methods to estimate the colour gradients: the logarithmic slope of the deconvoluted colour profiles, the ratio of the effective radii as measured in the three different filters and through the observed colour profiles. Our results are broadly independent of the method used and are in good agreement with previous work (see Section 8).
4.1 Intrinsic colour gradients
We first derived the colour gradient as the logarithmic slope of the colour profile (e.g. Peletier et al., 1990)
| (2) |
where (R) and (R) are the surface brightness profiles of the galaxy in the generic X and Y bands, respectively.
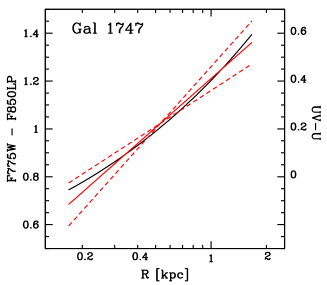
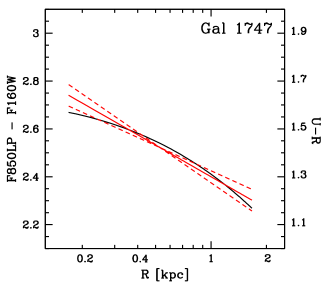
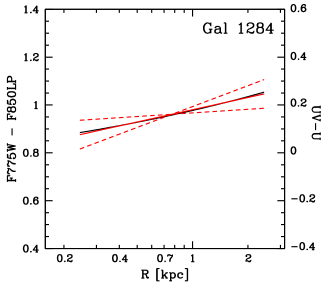
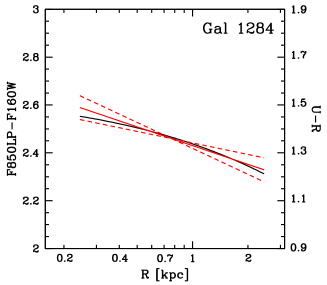
We fitted the slope of the colour profile between 0.1Re, and 1Re to be consistent with previous works. In Fig. 3 we show as an example the F775W - F850LP and F850LP-F160W colour gradients for two galaxies of our sample (1747 and 1284). The colour gradients of all other galaxies are shown in Appendix B. The black curves represent the deconvolved colour profiles, whereas the red lines are the best fitting slopes. The 1 error around the fit is shown as red dashed lines. The values of the colour gradients and their relative errors are reported in Table 5. We assigned as error on the colour gradient the error on the observed colour estimated within a thin circular annulus of width 0.1 arcsec and centred at 1Re (if the colour gradients are fitted between 0.1Re and 1Re) or at 2Re (if the colour gradients are fitted between 0.1Re and 2Re). This represents an upper limit to the error on the colour gradient. Indeed, we verified that, due to the lower signal-to-noise ratio (S/N), the error at 1Re is, on average, approximately three times the error at 0.1Re.
Ellipticals in our sample have positive or null rest-frame UV-U gradients. Indeed, three galaxies have a colour gradient comparable with zero at 1, whereas the remaining galaxies present a significant positive gradient showing the presence of a bluer stellar population towards the centre in this colour. On the contrary, these galaxies have negative or null rest-frame U-R colour gradients. In particular, four galaxies have a U-R colour gradient comparable with zero at 1, whereas the remaining ones present a significant negative gradient showing that the stellar populations are redder towards the centre in this colour. These results do not depend on the region over which the fit is carried out. The intrinsic profile from galfit well reproduces our observed profile up to 2Re for the majority ( 80 per cent) of the sample (see Appendix A). Hence, we have estimated the colour gradients at most up to this distance from the centre confirming the UV-U and U-R gradients for all the galaxies of our sample. At larger radii, we cannot reliably fit the galaxy profile as the surface brightness of galaxies falls below the level of the sky noise (see below).
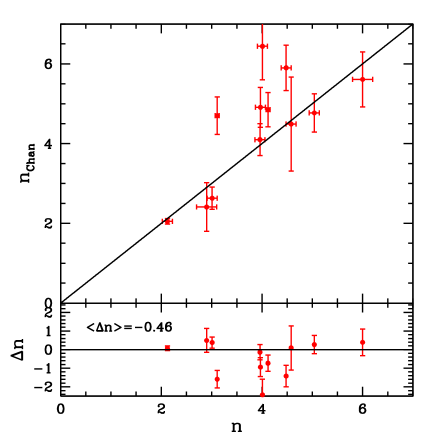
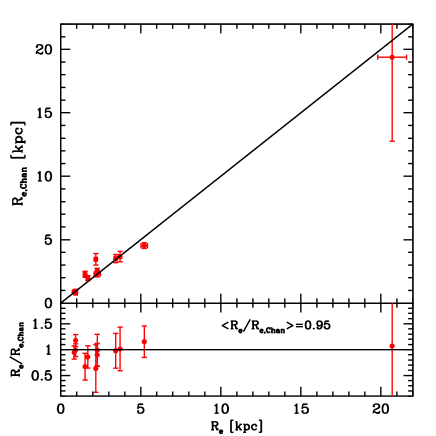
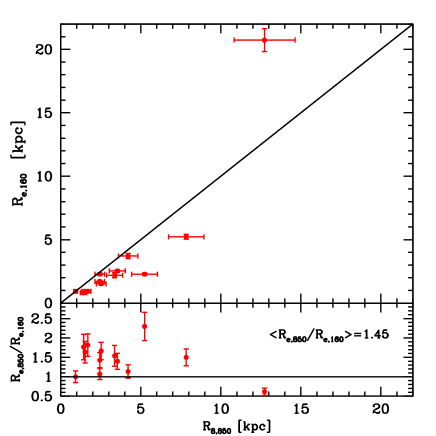
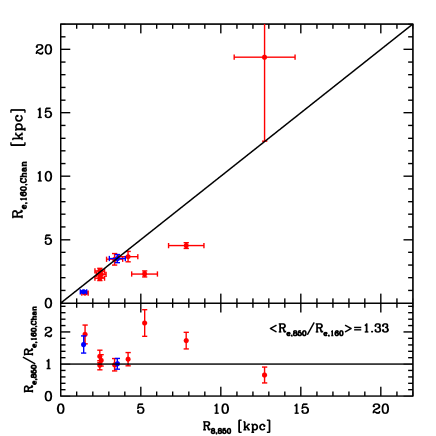
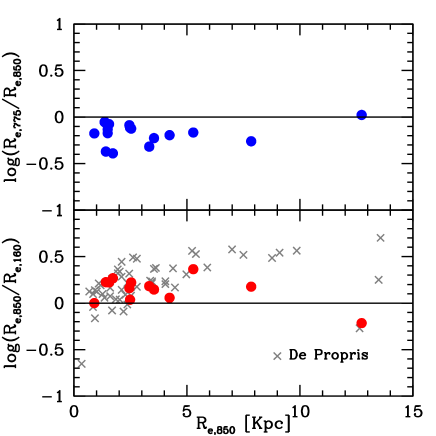
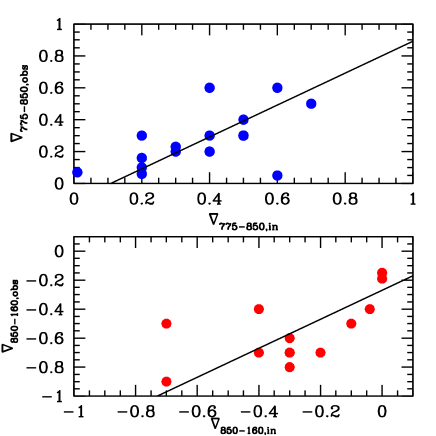
We also derived the colour gradients from the ratio of the effective radii as measured in the F775W, F850LP and F160W: (La Barbera et al., 2003; De Propris et al., 2015), where stands for the bluer band and stands for the redder band. As shown in Fig. 4 most of the high-redshift cluster galaxies show significant negative and simultaneously significant positive . This implies positive UV-U and negative U-R colour gradients for most of the galaxies in agreement with the previous method. The ratios log(Re) are also shown in Table 5.
4.2 Observed colour gradients
As a test for the robustness of our results derived by fitting the brightness profiles with galfit, we also derived the observed surface brightness profiles, and hence the colour profiles, by measuring the fluxes in each HST band within circular apertures centered on the galaxy. This method is not based on any fit of the surface brightness profile; hence, no dependence either on any assumption on the analytic function of the profile or on the fitting procedure is present. Since ACS F850LP images and WFC3 F160W images have a different resolution, in order not to introduce spurious gradients, we have degraded the F850LP image to the same PSF of the F160W image before deriving the F850LP - F160W observed colour profiles. In Fig. 5 we report as an example the observed colour profiles for the same galaxies 1747 and 1284 of Fig. 3 up to 1Re.
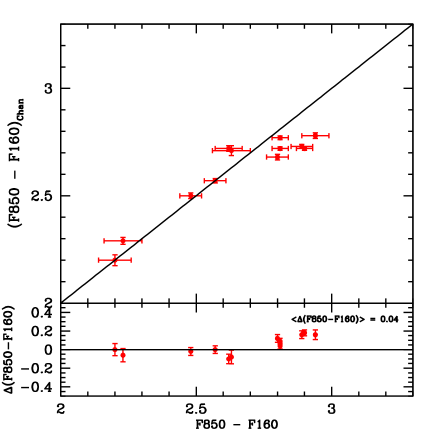
These gradients cannot be easily compared to the results in the previous subsection, as they depend on the PSF. However, both the methods provide the same systematics for all the galaxies as shown in Fig. 6, where we compare the ‘intrinsic’ and ‘observed’ F775W-F850LP (upper panel) and F850LP-F160W (lower panel) colour gradients out to 1Re. The ‘observed’ F775W-F850LP gradients are, on average, slightly less steep than the ‘intrinsic’ gradients (with an offset < 0.1 mag) due to the PSF that smooths both the profiles. The ‘observed’ F850LP-F160W colour gradients, instead, are, on average, steeper with an offset of 0.3 mag. This is mainly due to the PSF-match procedure. Indeed, degrading the F850LP image to the same PSF of the F160W image, the same amount of flux of the F850LP image has been redistributed over a larger area. This implies a decrease of the flux in the inner region in favour to the outer region and, consequently, the gradients become steeper.
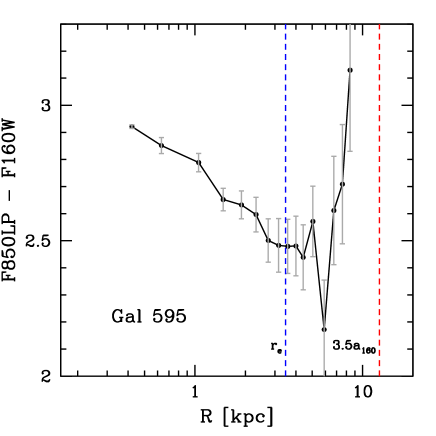
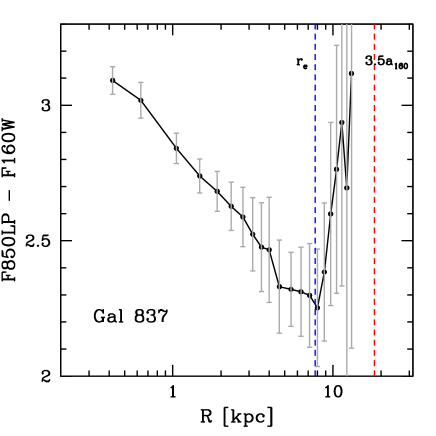
We have also checked the effect of estimating colour gradients beyond 2Re. Fig. 20 shows as example the observed F850LP-F160W colour profiles up to 3Re for galaxies 595 and 837, with effective radius 3.5 and 7.8 kpc, respectively. We can see that at R 1.5-2Re the colour profiles reverse because the sky noise dominates the surface brightness profiles in the F850LP band image (see Fig. 13), introducing a spurious colour gradient. This artificially flattens the colour gradient from the steeper one measured within 2Re (and with galfit). In agreement with what we previously found with the galfit fitting, estimates of the colour gradients for R 2Re are not reliable for most of the galaxies ( per cent of the sample) since they are dominated by the background of the ACS images.
These three different methods used to derive colour gradients are mutually consistent, implying that our results are independent of the method used. We conclude that the UV-U colour gradients are systematically positive (80 per cent) or null (20 per cent), never negative. On the contrary, the U-R colour gradients are systematically negative (70 per cent) or null (30 per cent), never positive.
5 Investigating the nature of the observed colour gradients
The presence of colour gradients implies that one or more properties of the stellar population vary radially. In this section we test whether a radial gradient of a single parameter (age, metallicity or dust) can account for the opposite slopes of the observed UV-U and U-R colour gradients.
5.1 Age, metallicity and dust variation
In the local Universe, colour gradients are usually interpreted as metallicity gradients, with the possible role of age gradients being still controversial. On this basis, we first tested whether the colour gradients we measure at high redshift can be reproduced by a pure metallicity gradient.
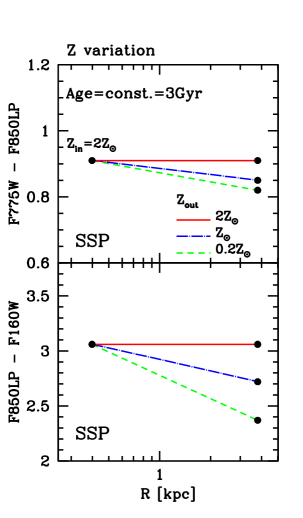
In the left-hand panel of Fig. 7 the predicted UV-U and U-R colour gradients are shown as a function of metallicity. We modelled the central region of the galaxy with a 3 Gyr old simple stellar population (SSP) (the results are independent on this assumption) with supersolar metallicity (2 Z⊙), while we modelled the outer region with the same SSP (i.e., we assume no radial age variation), but with metallicity 2 Z⊙, Z⊙ and 0.2 Z⊙. It can be seen that a metallicity gradient affects the derived U-R colour gradient more strongly than the UV-U gradient, but the slope is always negative (e.g for the extremes of the range, where the central region has Zin=2 Z⊙ and the outer region Zout=0.2 Z⊙, we find mag and mag). Therefore, we cannot explain both gradients at z=1.4 with a simple metal abundance gradient as in the local Universe.
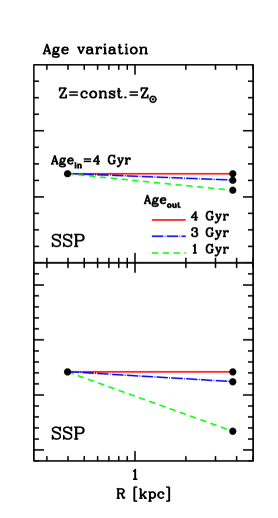
We repeated the same exercise in the case of a pure age (Fig. 7, central panel) and dust gradient (Fig. 7, right-hand panel). To investigate the effect of a pure age variation, we have modelled the central region of the galaxy with a SSP with solar metallicity and age 4 Gyr, and the external region with a SSP with the same metallicity and age 4 Gyr, 3 Gyr and 1 Gyr. Also in this case we observe that the U-R colour is more sensitive to age variation and that the variation of a single parameter is not able to reproduce both the negative U-R gradient and the positive UV-U gradient (e.g., for a galaxy whose centre has Agein=4 Gyr and Ageout=1 Gyr in the outskirts we obtain mag and mag).
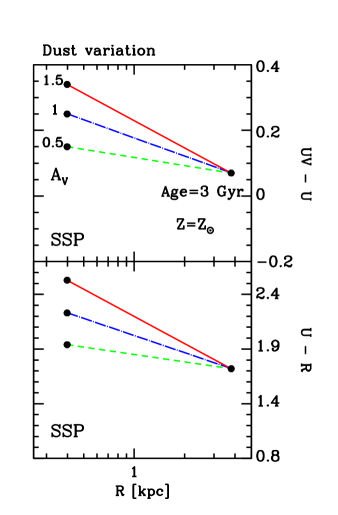
Finally, we considered a radial change in extinction. To model the dust variation, we fixed both the metallicity and the age and we assumed a more dusty core. The dust extinction produces an attenuation of the intrinsic flux of the galaxy that depends on the wavelength: , where and are the observed and the intrinsic fluxes, respectively, and is the extinction at a wavelength , is the Calzetti law and = 4.050.80 (Calzetti et al., 2000). In the right-hand panel of Fig. 7 it is shown how the two colour gradients vary as a function of the dust extinction for three different values of : 0.5, 1 and 1.5. Also in this case, the radial variation of dust produces concordant UV-U and U-R gradients, which become steeper for increasing values of .
Therefore, simple radial trends in age, metallicity or dust in their own cannot reproduce the observed UV-U and U-R gradients at the same time. Radial trends in metallicity, age or dust (with the metal abundance, age or extinction decreasing outwards) always produce negative UV-U and U-R gradients (and opposite if the metallicity, age or extinction decrease inwards). Furthermore, Fig. 7 shows also that the UV-U colour is much less sensitive to metallicity and age variation than the U-R colour. In fact, we find that while the U-R colour variations induced by the age/metallicity variations are comparable to those observed in our galaxies, the same age/metallicity variations do not produce UV-U colour variations as large as those observed (see Fig. 15).
To verify whether this result is just related to our choice of the input values of metallicity/age in the toy model of Fig. 7, in the next section we check whether an age or a metallicity variation is able to reproduce the amplitude of the observed gradients or it is easier to reproduce a certain colour gradient than the other one.
5.2 Modelling of the real data
Following the analysis technique proposed by Gargiulo et al. (2012), we model the stellar content of a galaxy as composed of two main stellar populations, one population dominating towards the centre and the other one dominating towards the outskirts. We model the two populations using BC03 composite stellar populations. To test for the radial age (metallicity, Z) variation as origin of the observed colour gradients, we fixed Z (age), AV and of the two populations to those derived from the fit to the global SED and leave age (Z) as free parameter of the fit. The best fitting age of the central (external) stellar population is the one that better reproduces both the UV-U and U-R colours observed in the inner (outer) region of the galaxy. We also required that the sum of the stellar populations matches the global SED.
On the basis of the colour profiles (see Appendix 13), we have chosen as inner region the one enclosed within the FWHM, that is within a radius of arcsec (0.5 kpc) and, as outer region, a circular annulus 1 kpc width centred at 1.5Re. We verified that for each galaxy 1.5Re corresponds to at least approximately three times the radius of the PSF.
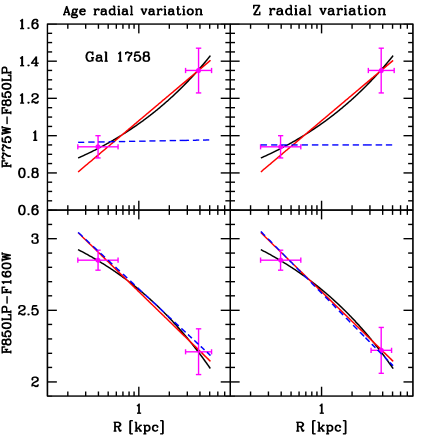
In Fig. 8, we show as an example the result obtained for the galaxy 1758, the one showing the most extreme colour gradients. In the left-hand panels we show the colour gradients from a pure age variation, whereas in the right-hand panels we show those obtained by considering a pure metallicity gradient, where we have adopted a grid of metallicity values as follows: 0.2 Z⊙, 0.4 Z⊙, Z⊙ and 2 Z⊙. The black curves represent the colour profiles of the galaxy, whereas the red lines are the observed colour gradients. The blue dashed lines represent the best fitting colour gradients as resulting from the two-component model.
What we found is that the best fitting procedure finds a solution to the observed U-R colour gradients ( mag; see Table 5) both in the case of an age gradient and a metallicity gradient. The resulting metallicity gradients (at fixed age) are in the range log(Z)/log(R)<-0.8, with a median value of -0.4, consistent with the metallicity gradients derived in local and intermediate redshift ellipticals, where ranges from -0.2 to -0.4 (e.g. Saglia et al., 2000; Wu et al., 2005; La Barbera & de Carvalho, 2009). The resulting age gradients (at fixed metallicity), instead, are in the range log(age)/log(R) -0.4. Such age gradients would be barely detectable locally. For instance, = -0.3 due to an age variation of 2 Gyr corresponds at =0 to a colour gradient of -0.07 mag, smaller than the typical errors on colour gradients. On the contrary, the procedure does not find a solution for the observed large UV-U colour gradients and for the opposite slopes shown by the two gradients.
It is worth noting that, in the case of dust variation, to reproduce even the mean amplitude (-0.3 mag) of the U-R gradients an mag would be needed in the inner regions, values never obtained from the fitting to the global SED of our galaxies. Hence, dust can play only a marginal role, if it has one, in the origin of the observed colour gradients.
Hence, it is easier to reproduce the negative U-R colour gradients rather than the positive UV-U colour gradients. UV-U colour gradients can not be accounted for by age and/or by metallicity variations. Actually, what the data show is that galaxies are bluer in the centre when the UV-U colour is considered. Hence, there is an UV excess towards the galaxy central regions with respect to the external ones. Starting from this evidence, in the next section, we try to constrain the scenario that best reproduces simultaneously both the colour gradients, focusing on the nature of the bluer UV-U colour in the galaxy central regions.
6 The key information stored in the galaxy central regions
While an age gradient or a metallicity gradient, as the one observed in local elliptical galaxies (e.g. Saglia et al., 2000; Wu et al., 2005; La Barbera et al., 2005; Tortora et al., 2010) can account for the U-R colour gradients, the same gradient cannot produce the opposite (positive) UV-U gradients. To reproduce the positive UV-U colour gradient without affecting the observed negative U-R gradient, a mechanism able to efficiently enhance UV emission without altering the spectrum at longer wavelengths has to be hypothesized in the galaxy central regions. Possible mechanisms able to fulfil these requirements are the star formation, the presence of a QSO, stars in the He-burning phase or He-rich stars. In the following, we discuss each of these mechanisms.
6.1 A steady mild star formation?
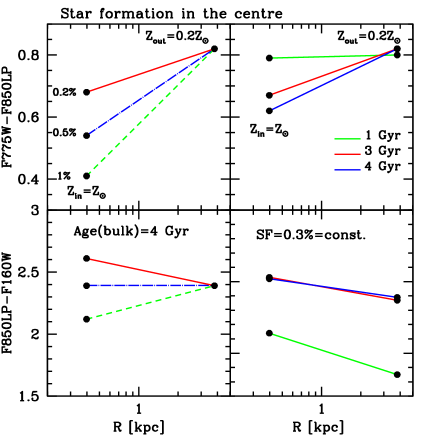
One mechanism that produces UV emission is the star formation. In order to test whether weak star formation can produce positive UV-U gradients without affecting the negative U-R gradients, we have added in the centre a young stellar component seen while it is forming most of its stars, i.e. characterized by =0.1 Gyr and an age of 0.1 Gyr. The results are shown in Fig. 9. In particular, in the left-hand panel, we fixed the age of the bulk of stellar population (4 Gyr) and varied the metallicity from the centre (Z⊙) to the external region (0.2 Z⊙) and added different percentages (in terms of stellar mass) of star formation towards the centre. In the right-hand panel, instead, we show the same model of the left panel (metallicity varies from the central region to the outer region with different percentages of star formation in the centre) but for different constant age of the bulk of the stellar population.
We found that, although the radial decrease of metallicity (at constant age) would reflect in negative UV-U colour gradient (e.g. see Fig. 7 ), the presence of a very weak star formation in the centre is able to reverse the UV-U gradient turning it from negative to positive. Moreover, the older the mean age of the stellar population the easier to produce positive UV-U colour gradients. This is because the UV emission of the star-forming component tends to dominate the UV and U emission of the stellar population when it is old, enhancing the gradient with respect to the outer regions. For instance, the ratio between the UV emission of 0.3 per cent (in stellar mass) of star-forming component and the UV emission of 1 Gyr old component is 0.08. This ratio increases to 0.7 in the case of a 4 Gyr old component.
In order not to affect the negative U-R colour gradients, the percentage in stellar mass of this star forming component must be less than 0.5 per cent of the total stellar mass.
We applied this model to our galaxies. We built a grid where the percentage of the star forming component ranges from 0.1 to 3 per cent with a step of 0.2. At fixed percentage of the star forming component, we varied the age and the metallicity of the stellar population in the centre and in the outer region. The ages considered range from 1 to 4 Gyr (the age of the Universe at =1.39 is 4.5 Gyr) with a step of 0.5. Metallicity variation has been modelled on a grid of subsolar and supersolar metallicity values: 0.2 Z⊙, 0.4 Z⊙, Z⊙ and 2 Z⊙. We found that 0.7 per cent represent an upper limit to the percentage of the star-forming component, since larger percentages produce flat or even positive U-R gradients.
Six galaxies (595, 1740, 1790, 2054, 2429, 837) present U-R colour gradients consistent with a null gradient at 1. However, these galaxies present positive UV-U gradients at 1. The only addition of star formation towards the centre produces positive UV-U gradients, but also slightly positive U-R gradients. The best solutions provide for these galaxies a contribution of 0.2 per cent in mass of star formation together with either a negative age gradient of -0.3 (Agein= 4 Gyr and Ageout= 2 Gyr) or a metallicity gradient of -0.4 (Zin = Z⊙ and Zout= 0.4 Z⊙), consistent with the metallicity gradients found in local ellipticals.
Four galaxies (692, 1284, 1782, 2147) show opposite colour gradients at 1. For them, the best fitting model producing simultaneously both the observed colour gradients is composed of 0.2 per cent of star-forming component in the centre superimposed to an age gradient of -0.3 (Agein= 4 Gyr and Ageout= 2 Gyr) and a metallicity gradient of -0.4 (Zin = Z⊙ and Zout= 0.4 Z⊙).
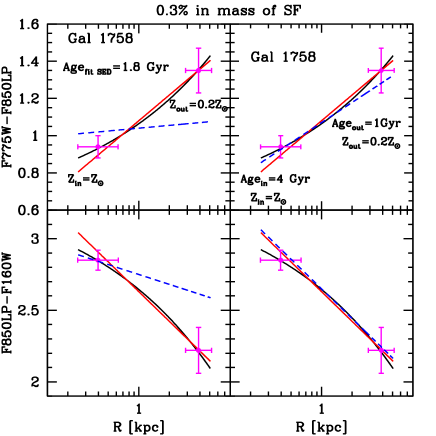
Galaxy 1758 presents an extreme value of the U-R gradient at 1 (= -0.55 mag). In order to produce such steep U-R gradient, it is needed to consider an even lower metallicity towards the external region (Zout= 0.2 Z⊙). This would imply a steeper metallicity gradient ( -0.7) not observed in the local ellipticals. For this galaxy, we simultaneously produce both the colour gradients by adding 0.3 per cent of star formation together with both an age gradient (Agein= 4 Gyr and Ageout= 2 Gyr) and a metallicity gradient (Zin = Z⊙ and Zout= 0.2 Z⊙). This galaxy is shown in Fig. 10 as an example. The upper panel shows the F775W-F850LP colour profile (black line) with the best fitting slope (red line), while the lower panel the F850LP-F160W colour profile. The blue dashed line is the colour gradient including star formation in the centre for an underlying metallicity gradient (left) and both a metallicity and an age gradient (right).
Finally, two galaxies (684 and 1747) present an extreme value of the UV-U gradients at 1 (= 0.47, 0.58 mag, respectively). For these galaxies, we are not able to simultaneously produce both the colour gradients. Indeed, in order to produce the steep observed UV gradients, 1 per cent in mass of star formation is needed, but this produces positive U-R gradients, even if we consider the lowest metallicity available in the external region (Zout= 0.2 Z⊙). These galaxies are isolated; they are not the faintest in the sample and their structural parameters are not extreme. Hence, we have no reason to suppose that the colour gradients of these galaxies are overestimated.
In conclusion, by applying a model with star formation in the centre together with a metallicity and/or an age gradient, we are able to simultaneously produce at 1 both the colour gradients for 11 out of the 13 ellipticals ( 85 per cent of the sample). On the basis of this model, these ellipticals would be composed by an older and more metal-rich population in the centre, a younger and more metal-poor population in the outskirts and a small star-forming component in the core.
Taking as reference the mean value of the stellar mass (<M∗> 3 1010 M⊙) of the galaxies of our sample, this young star-forming component would contribute in stellar mass for just 2.7 108 M⊙. Since the BC03 models are normalized at 1 M⊙ and a stellar population of 0.1 Gyr with =0.1 Gyr is characterized by a SFR = 3.6 10-9 M⊙ yr-1, the SFR associated with the young central star forming component would be SFR1 M⊙ yr-1. It is worth noting that this SFR is rather stable with respect to the assumptions made: at fixed SFH (e.g. Gyr) a younger stellar population (<0.1 Gyr) would be characterized by a stronger UV emission and, consequently, the required mass percentage would be lower (<0.5 per cent) leaving nearly unchanged the resulting SFR.
Following the relation
| (3) |
(Kennicutt, 1998), the flux [0II]3727 associated with a SFR of 1 M⊙ yr-1 in a galaxy at =1.39 would be [0II] erg cm-2 s-1. Such faint fluxes are barely detectable even at a 10 m class telescope. For instance, Cimatti et al. (2008) report the detection of such faint fluxes in three passive galaxies in the GMASS survey, all of them observed for more than 30 hr. Thus, we could not directly confirm whether such a weak star formation activity is actually present in the galaxies of our sample, since it is too low to be detectable with the current instrumentations. However, some works find indirect evidence of the presence of star formation in early-type galaxies both at high- and in the local universe. For instance, Lonoce et al. (2014), measuring the spectral indices of a sample of early-type galaxies at 0.7 < zspec < 1.1, found that, in some cases, the measured H+K (Ca II) index is consistent with the presence of a small mass percentage (<1 per cent) of a young stellar component (< 1 Gyr) with recent weak star formation. Also Wagner et al. (2015), studying a sample of massive (M > M⊙) cluster early-type galaxies at 1.0 < z < 1.5, found that 12 per cent of them are likely experiencing star formation activity. In the local Universe, Kaviraj et al. (2008), studying 2100 early-type galaxies in the SDSS DR3, found that at least per cent of them have UV to optical (NUV - r) colour consistent with recent star formation.
If the star formation is the origin of the UV excess in the galaxy central regions of our sample, this scenario requires a certain degree of fine-tuning. The fact that we observe positive UV-U (or null) gradients in all the galaxies implies that all of them are experiencing star formation in their centre, otherwise we would have observed negative UV-U gradients in some of them at least. This implies, in turn, that the star formation cannot be either episodic or short, but that it protracts over time in a steady fashion at low levels to allow us to observe it as it is (low) in all the galaxies. Being protracted over long time (say Gyr, being at ), this SF even if weak, needs to be supplied with gas. The fuel cannot come from inflows of intracluster medium (ICM), since galaxies are in thermal equilibrium with the ICM. By the way, this kind of supplying would flatten the metallicity gradient and, consequently, the U-R gradient being the ICM less metal-rich. On the contrary, such star formation should be feeded by the residual processed gas in the galaxies (closed box). This process would efficiently enhance the metallicity towards the centre (e.g. Peng et al., 2015) producing naturally the observed negative U-R gradients.
As already said, this scenario requires a fine-tuning in term of synchronism and duration of the star formation as possible origin of the observed UV excess in the centre of our galaxies. However, apart from this, we have no evidence to exclude it. Moreover, it is worth considering that this model gives rise to the observed colour gradients simultaneously reproducing both the UV-U and the U-R gradients (see Fig. 10 ) and that it would naturally produce the metallicity gradient observed also in the local ellipticals.
6.2 A possible QSO contribution?
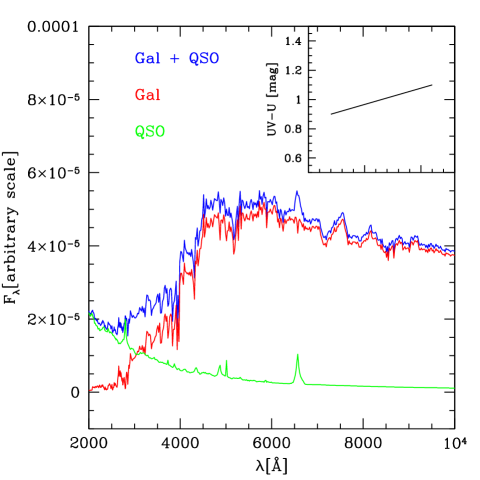
Quasars are known to have a SED characterized by strong UV emission, peaking at 1500 Å (the so-called big blue bump; Shields, 1978). To verify whether the UV excess in the galaxy central regions is the sign of the blue bump, we have added in the centre a QSO component instead of the star-forming one. We have considered the composite spectrum of Francis et al. (1991). In Fig. 11 is shown, as example, the case of the QSO component needed to produce a UV-U colour gradient of mag. In terms of absolute magnitude, this QSO is 2 mag fainter than the galaxy in the B band rest-frame. In this case, the U-R gradient is not significantly affected and we can reproduce simultaneously gradients in the range mag and mag, assuming a radial decrease of metallicity and age. For instance, for galaxies 692 and 1284, having gradients in the above ranges, the QSO would have an absolute magnitudes of MB -18.7 mag and MB -19.7 mag (Seyfert like), respectively. However, higher values of the UV-U gradient cannot be accounted for by further increasing the QSO luminosity. Indeed, in this latter case, the integrated UV-U and U-R colours of the galaxy would be affected resulting in significantly bluer (>0.3 mag in UV-U and in U-R) than those observed. Hence, a QSO could be present in the galaxies and contribute to the observed UV excess but cannot be the only cause. It should be superimposed to, e.g. star formation to account for the observed gradients without altering the colours of the galaxies.
6.3 Or, rather, a population of He-rich stars?
In the local Universe it has long been known that elliptical galaxies can present an UV excess in their SED, stronger at wavelengths shortwards of 2100 Å (e.g. Code & Welch, 1979; O’Connell et al., 1992; O’Connell, 1999), with a tail extending up to 3200 Å (see e.g., Greggio & Renzini, 1990; Ponder et al., 1998; Dorman et al., 1995). This was unexpected since ellipticals were supposed to contain mainly old and cold stellar populations. Since its discovery, the UV upturn phenomenon in elliptical galaxies has generated a big discussion about its origin. From the shape of the SED in the UV, it derives that the temperature of the stars, which give rise to the UV excess, is in the range 20000 3000 K (Brown et al., 1997). This effectively ruled out young stars as the main driver of the UV upturn. The main mechanisms that are supposed to be responsible for the UV upturn are He-burning stars (e.g. Han et al., 2002, 2003; Han et al., 2007; Han, 2008) and He-rich stars (e.g. Yi et al., 2011; Carter et al., 2011). We have considered these scenarios to test if they can explain the blue excess we observe towards the centre of our ellipticals at . Indeed, even though the emission peak of the UV upturn is at wavelengths < 2100 Å, its tail extends up to 3200 Å, affecting the F775W band (filter range 2700 Å 3600 Å).
6.3.1 He-burning stars
He-burning stars are stars that have already stopped burning hydrogen in their cores and they are burning helium. Assuming for the stellar population a formation redshift , at z=1.39 the population would be 4 Gyr old. Hence, at z = 1.39, only stars with 1.2 M M 1.5 M⊙ would be in the He-burning phase since their lifetime in the Main Sequence (MS) is 3-4 Gyr (Iben, 1967). Stars with M<1.2 M⊙ would still be in the MS (lifetime in MS phase yr), whereas stars with M>1.4M⊙ have already evolved (lifetime in MS phase yr). The He-burning phase is characterized by a very short time-scale if compared to the MS phase and, for stars with 1.2 M⊙<M<1.5 M⊙ it lasts just yr. Hence, this very short time makes highly unlikely that the UV excess seen in the galaxy central regions is due to an excess of intermediate mass stars in the He-burning phase.
6.3.2 He-rich stars
One other possibility is that the cores of elliptical galaxies host a He-rich subpopulation of stars. These stars are formed from the gas enriched by the evolution of very high mass stars. In the cold dark matter model the first stars are predicted to be composed principally by hydrogen (see e.g. Blumenthal et al., 1984; Komatsu et al., 2009). The absence of metals disadvantaged the formation of low and intermediate mass stars, since the cooling is less efficient. Results from recent numerical simulations of the collapse and fragmentation of primordial gas clouds suggest that the first stars were predominantly very massive, with typical masses M M⊙ (Bromm et al., 1999, 2002; Nakamura & Umemura, 2001; Abel et al., 2000, 2002). These stars would evolve very quickly and the supernova (SN) explosions that ended their lives would enrich efficiently the ISM with heavy elements (see e.g. Ostriker & Gnedin, 1996; Gnedin & Ostriker, 1997; Ferrara et al., 2000; Madau et al., 2001). These metals would fall towards the centre of the galaxies due to the potential well naturally explaining the observed negative metallicity gradients resulting from the subsequent generations of stars.
We know that these stars exist in local ellipticals, where they contribute to the classical UV upturn (e.g. O’Connell, 1999). Moreover, the UV gradients observed in Coma galaxies by Carter et al. (2011) imply that there exists an He abundance gradient, established at very early times. He-enriched stars are known to be bluer than their counterparts with standard metal abundance (see, e.g., Chantereau et al. 2015). This is observed in the bluer UV colours of He-enriched red giants in Lardo et al. (2012) and in the bluer secondary MSs of several globular clusters (e.g. Piotto et al., 2005).
Since these stars will be bluer, they will naturally produce an excess in the UV in the centre, but they will not strongly affect optical colours, as also shown by the above observations in globular clusters. Thus, an He abundance gradient, which is known to exist in the local Universe, would reproduce the observed positive UV-U gradients without fine-tuning. Unfortunately, we lack population synthesis models for He-enriched populations to study this issue in detail.
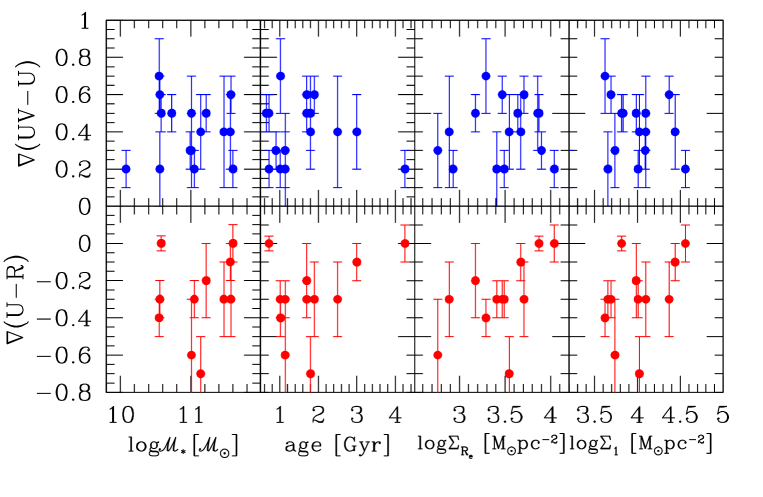
7 Colour gradients and global properties of galaxies
To further investigate on the origin of the UV excess towards the centre and on the mechanisms producing the observed colour gradients in our galaxies, we have looked for the presence of correlations between gradients and global properties of galaxies. We considered the stellar mass , the mean age as derived by the SED fitting, the effective stellar mass density and the central stellar mass density within 1 kpc radius, as derived in Saracco et al. (2017). Fig. 12 shows the relation between colour gradients and global properties of galaxies. The U-R colour gradient seems to be weakly correlated with the effective stellar mass density of galaxies in the sense that the larger the gradient the lower the density. However, the Spearmen rank test provides a probability of just 90 per cent significance. Actually, no correlation was detected with the global properties of galaxies, both considering the UV-U (upper panel) and the U-R (lower panel) colour gradients. This is not surprising since colour gradients trace principally the variation of the stellar component dominating the galaxy within 1-2Re while the other properties are derived considering the whole galaxy mass. Similar results are also found by De Propris et al. (2015, 2016) for cluster red sequence galaxies at a comparable redshift and by Gargiulo et al. (2012) for a sample of field early-type galaxies at 0.9 < < 1.92. We have also verified if the amplitude of the colour gradients depends on the position of the galaxy inside the cluster, namely on the radial distance from the cluster centre (i.e. on the local density). Also in this case we did not detect a correlation. The low statistics does not allow us to establish whether the local environment has affected the colour gradients of these galaxies.
8 Comparison with previous works
In this section we compare our results with those present in literature. Although colour gradients are largely studied in the local universe, still few works are focused on gradients in cluster and field galaxies at .
8.1 Cluster environment
Our results are in agreement with those of De Propris et al. (2015), who studied the F850LP - F160W colour gradients of red sequence galaxies belonging to four clusters (one of which in common with us) at using the ratio of their effective radii measured in the two bands. They found that the galaxies in their sample present significant positive , hence negative colour gradients, larger than those observed locally (e.g. in Virgo cluster). The authors divide their red sequence galaxies in red discs (<2) and red spheroids (>2). Since 16 out to the 17 ellipticals of our sample have >3, for a proper comparison, in Fig. 4 we plotted with grey crosses the galaxies of De Propris et al. (2015) sample with >3. The median value of the of their cluster galaxies with >3 is 0.18, consistent with the median value (0.21) of our cluster ellipticals. The authors interpret the negative F850LP - F160W gradients in term of metallicity gradients plus radial age gradients, with a younger stellar population towards the outskirts, due to the fact that star formation may have continued for a longer time in the outer regions of the galaxies (e.g. Tacchella et al., 2016). Our interpretation, as resulting from the analysis shown in Section 6.1, does not exclude a contribution of age gradient, specially to justify the most extreme U-R gradients. However, it seems that the major role is played by the metallicity, as also seen in the local ellipticals. Anyway, the similarities in the colour gradients, independently found in the range , suggest that cluster galaxies have experienced similar evolutionary processes in their past.
Colour gradients in cluster and field galaxies were also derived by Allen et al. (2015) at . The authors selected a mass-complete sample of 59 cluster galaxies at z = 2.095 and 478 field galaxies at with log. Galaxies in both samples are separated in quiescent and star-forming galaxies using the UVJ rest-frame colour - colour diagram (e.g. Williams et al., 2009, 2010; Wuyts et al., 2009; Wild et al., 2014). The authors stacked galaxy images both for cluster and field sample to measure average F814W - F160W () radial colour profiles as a function of the mass. They found no colour gradients either in field or in cluster quiescent galaxies. Unlike Allen et al. (2015), we find that most of our cluster elliptical galaxies presents significative colour gradients. This suggests that from 2 to 1.4 cluster galaxies may have experienced some evolutionary processes, which have increased the amplitude of their colour gradients producing a significant radial variation of their stellar population properties.
We also compared our results with Chan et al. (2016), who studied a sample of 36 passive galaxies selected in the same cluster considered in our analysis, XMMUJ2235-2557. They base their analysis only on the rest-frame U-R gradient. Since we selected elliptical galaxies, only 12 galaxies are in common (for a detailed comparison see Appendix C). They derived U-R colour gradients from the observed colour profile up to 3.5 ( is the major axis), whereas we derived colour gradients from the intrinsic colour profile and up to 2 effective radii. For the 12 galaxies in common we found a median value of the F850LP-F160W colour gradients of -0.3 mag, consistent with the median value ( -0.4 mag) found by Chan et al. (2016). Anyway, for one (595) out of the 12 galaxies in common, they derive a positive gradient, whereas we measured a negative gradient. We will discuss the possible origin of this difference in Appendix C. They explain the evolution of the colour gradients from = 1.39 to 0 through the presence of an age gradient () besides a metallicity gradient (). In agreement with Chan et al. (2016), we also found that the rest-frame U-R gradients can be produced by the radial variation of age and metallicity. However, our analysis shows that relevant information is stored in the UV-U gradient. As pointed out in Section 6, the rest-frame ultraviolet gradient is a very important key to correctly interpret the properties of the stellar population of galaxies and to constrain their history of mass accretion.
8.2 Cluster versus field
For field elliptical galaxies we first compare our results with those of Gargiulo et al. (2012). The authors have derived the F850LP - F160W colour gradients for 11 morphologically selected ellipticals at in the GOODS-South region. Structural parameters and gradients have been derived as in this work. They found significant negative within 1Re in per cent of the galaxies, a fraction that rises up to 100 per cent when R>Re is considered, as for our sample. By considering the eight galaxies of their sample in redshift range , to avoid evolutionary effects, we found that our cluster ellipticals show U-R (F850LP - F160W) colour gradients of amplitudes (0.2 mag) comparable to those of field ellipticals (0.3 mag).
In a previous work (Gargiulo et al., 2011), the authors studied the F606W - F850LP () for 20 early-type galaxies at 0.9 < < 1.92, only four of these in common with the other study. They detected significant radial UV-U colour variation in 10 out of the 20 galaxies, five showing negative gradients and the remaining ones showing positive gradients. Hence, contrary to cluster galaxies, field galaxies at similar redshift () seem to present both positive and negative ultraviolet gradients. Their analysis shows that, for a minor fraction, the observed gradients can be well reproduced by a pure radial age variation or by a pure metallicity variation while, for the remaining galaxies, more than one property of the stellar population must simultaneously vary to account for the observed gradients. Hence, although the small statistic, this comparison may suggest that the environment could have already influenced the evolution of elliptical galaxies.
Finally, we compared our results with those of Guo et al. (2011), who studied the F850LP - F160W colour gradients for six massive ( M⊙) early-type galaxies selected at redshift for their early-type morphology and low SSFRs (SSFR = SFR/ yr-1). By deriving colour gradients in concentric annular apertures up to 10 Re, they found, concordantly with our results, that the inner regions are redder than the outskirts. A radial variation of a single stellar parameter (age/metallicity) does not account for the observed colour gradients. The authors found a correlation between the dust and the observed colour gradients: the redder the inner region the higher the central dust obscuration. Like Guo et al. (2011) we also found that the radial variation of a single stellar parameter can not account for the observed colour gradients, but we do not confirm the correlation between the observed colour gradients and the dust content. However, their analysis considered only the (U-R) colour gradients.
9 Summary and conclusions
In this paper, we investigated the radial variation of the stellar population properties in a sample of 17 ellipticals belonging to the cluster XMMU J2235.3-2557 at =1.39. The galaxies have been selected on the basis of their elliptical morphology that we assigned through a visual inspection of their ACS-F850LP images.
Making use of the ACS images in the F775W and F850LP bands and of the WFC3 images in the F160W band, we derived their rest-frame UV-U (F775W-F850LP) and U-R (F850LP-F160W) colour gradients using three different methods: the logarithmic slope of the deconvoluted colour profiles, the ratio of the effective radii as measured in the three different filters and through the observed colour profiles. While the first two methods are both dependent on the best fitting procedure of the colour profiles, the third method does not involve any fit of the light profiles of the galaxies.
Our main results are as follows.
-
(i)
The UV-U colour gradients are systematically positive (80 per cent) or null (20 per cent), never negative. On the contrary, the U-R colour gradients are systematically negative (70 per cent) or null (30 per cent), never positive. The mean value of the UV-U gradients is 0.40.2 mag, slightly larger than the mean value of the U-R gradients (-0.30.2 mag) in spite of the much narrower wavelength interval of the UV-U gradient.
-
(ii)
The results do not depend on the method used to derive the colour gradients.
We then investigated the origin of the observed colour gradients using BC03 stellar population models. Our results are the following:
-
(i)
The opposite slopes of the observed colour gradients cannot be accounted for by the radial variation of a single parameter (age, metallicity or dust). A variation of these parameters produces ever gradients with concordant slopes. In particular, a radial decrease in metallicity/age/dust from the central to external regions produces negative UV-U and U-R colour gradients and vice versa.
-
(ii)
The amplitude of the U-R colour variations observed in our galaxies can be easily accounted for by an age or by a metallicity radial decrease. On the contrary, we are not able to reproduce the amplitude of the observed UV-U colour gradients through age or metallicity variation.
The UV-U colour gradients we detected show the presence of an UV excess towards the centre of the galaxies with respect to the outer regions and call into question other mechanisms able to efficiently produce UV and U emission in the galaxy central regions. We considered these possible UV and U emission sources: star formation, the presence of a QSO, stars in the He-burning phase and He-rich stars.
We found that a weak star formation ( M⊙ yr-1) superimposed to an old stellar component towards the centre and to a negative metallicity gradient can reverse the UV-U colour gradient simultaneously reproducing the amplitude and the opposite slopes of the UV-U and U-R colour gradients. The required central star-forming component should not exceed 0.5 per cent in stellar mass not to affect the U-R gradient. In this way, we are able to reproduce both the colour gradients for 10 out of the 13 ellipticals ( 85 per cent of the sample), for which both colour gradients are available. However, if this is the cause of the bluer UV-U colour towards the centre, this implies that all the galaxies are currently experiencing SF in the centre since all of them have positive or null UV-U gradients. This in turn implies that the star formation should be steady and protracted over a long time ( Gyr) and not episodic and/or erratic.
We found that the presence of a QSO could contribute to the UV excess, but it cannot justify alone the observed UV-U gradient unless flattening the U-R gradient and significantly altering the integrated colours of the galaxies.
We found that it is highly unlikely that the observed UV excess we observed is due to the abundance of He-burning stars towards the centre of the galaxies. Indeed, at =1.39, only stars with 1.2 M M 1.5 M⊙ would be in the He-burning phase. Since the He-burning time-scale for stars in this range of mass is very short ( yr), it would require a very strong fine-tuning in term of synchronism to justify the UV excess observed in almost all the galaxies of our sample.
Finally, we also found that an excess of He-rich stars towards the centre of the galaxies would qualitatively explain the positive UV-U gradients and the negative metallicity U-R gradients as well, without introducing any fine-tuning. It is worth noting that the presence of a population of He-rich stars in the centre of elliptical galaxies would be in agreement with the NUV-UV colour gradients observed in some ellipticals in the local universe. Unfortunately, we cannot test this scenario since no suited models are available.
acknowledgments
FC wishes to thank Paola Severgnini for the helpful comments and suggestions for the QSO discussion. We thank the anonymous referee for the useful and constructive comments. This work is based on observations collected at the European Organisation for Astronomical Research in the Southern Hemisphere under ESO programmes 60.A-9284 and 079.A-0758. This work is also based on observations made with the NASA/ESA Hubble Space Telescope, obtained from the data archive (ID 10698, 10496 and 12051) at the Space Telescope Science Institute, which is operated by the Association of Universities for Research in Astronomy, and with the Spitzer Space Telescope, which is operated by the Jet Propulsion Laboratory, California Institute of Technology under a contract with NASA.
References
- Abadi et al. (1999) Abadi M. G., Moore B., Bower R. G., 1999, MNRAS, 308, 947
- Abel et al. (2000) Abel T., Bryan G. L., Norman M. L., 2000, ApJ, 540, 39
- Abel et al. (2002) Abel T., Bryan G. L., Norman M. L., 2002, Science, 295, 93
- Allen et al. (2015) Allen R. J., et al., 2015, ApJ, 806, 3
- Bertin & Arnouts (1996) Bertin E., Arnouts S., 1996, A&AS, 117, 393
- Blumenthal et al. (1984) Blumenthal G. R., Faber S. M., Primack J. R., Rees M. J., 1984, Nature, 311, 517
- Bolzonella et al. (2000) Bolzonella M., Miralles J.-M., Pelló R., 2000, A&A, 363, 476
- Bromm et al. (1999) Bromm V., Coppi P. S., Larson R. B., 1999, ApJ, 527, L5
- Bromm et al. (2002) Bromm V., Coppi P. S., Larson R. B., 2002, ApJ, 564, 23
- Brown et al. (1997) Brown T. M., Ferguson H. C., Davidsen A. F., Dorman B., 1997, ApJ, 482, 685
- Bruzual & Charlot (2003) Bruzual G., Charlot S., 2003, MNRAS, 344, 1000
- Calzetti et al. (2000) Calzetti D., Armus L., Bohlin R. C., Kinney A. L., Koornneef J., Storchi-Bergmann T., 2000, ApJ, 533, 682
- Carter et al. (2011) Carter D., Pass S., Kennedy J., Karick A. M., Smith R. J., 2011, MNRAS, 414, 3410
- Cattaneo et al. (2008) Cattaneo A., Dekel A., Faber S. M., Guiderdoni B., 2008, MNRAS, 389, 567
- Chabrier (2003) Chabrier G., 2003, PASP, 115, 763
- Chan et al. (2016) Chan J. C. C., et al., 2016, MNRAS, 458, 3181
- Chantereau et al. (2015) Chantereau W., Charbonnel C., Decressin T., 2015, A&A, 578, A117
- Chiosi & Carraro (2002) Chiosi C., Carraro G., 2002, MNRAS, 335, 335
- Cimatti et al. (2008) Cimatti A., et al., 2008, A&A, 482, 21
- Clemens et al. (2009) Clemens M. S., Bressan A., Nikolic B., Rampazzo R., 2009, MNRAS, 392, L35
- Code & Welch (1979) Code A. D., Welch G. A., 1979, ApJ, 228, 95
- Cowie & Songaila (1977) Cowie L. L., Songaila A., 1977, Nature, 266, 501
- De Lucia et al. (2006) De Lucia G., Springel V., White S. D. M., Croton D., Kauffmann G., 2006, MNRAS, 366, 499
- De Propris et al. (2015) De Propris R., Bremer M. N., Phillipps S., 2015, MNRAS, 450, 1268
- De Propris et al. (2016) De Propris R., Bremer M. N., Phillipps S., 2016, MNRAS, 461, 4517
- Dekel & Birnboim (2006) Dekel A., Birnboim Y., 2006, MNRAS, 368, 2
- Dorman et al. (1995) Dorman B., O’Connell R. W., Rood R. T., 1995, ApJ, 442, 105
- Drake et al. (2000) Drake N., Merrifield M. R., Sakelliou I., Pinkney J. C., 2000, MNRAS, 314, 768
- Dressler & Gunn (1983) Dressler A., Gunn J. E., 1983, ApJ, 270, 7
- Eggen et al. (1962) Eggen O. J., Lynden-Bell D., Sandage A. R., 1962, ApJ, 136, 748
- Ferrara et al. (2000) Ferrara A., Pettini M., Shchekinov Y., 2000, MNRAS, 319, 539
- Francis et al. (1991) Francis P. J., Hewett P. C., Foltz C. B., Chaffee F. H., Weymann R. J., Morris S. L., 1991, ApJ, 373, 465
- Fujita (1998) Fujita Y., 1998, ApJ, 509, 587
- Gargiulo et al. (2011) Gargiulo A., Saracco P., Longhetti M., 2011, MNRAS, 412, 1804
- Gargiulo et al. (2012) Gargiulo A., Saracco P., Longhetti M., La Barbera F., Tamburri S., 2012, MNRAS, 425, 2698
- Gnedin & Ostriker (1997) Gnedin N. Y., Ostriker J. P., 1997, ApJ, 486, 581
- Greggio & Renzini (1990) Greggio L., Renzini A., 1990, ApJ, 364, 35
- Gunn & Gott (1972) Gunn J. E., Gott III J. R., 1972, ApJ, 176, 1
- Guo et al. (2011) Guo Y., et al., 2011, ApJ, 735, 18
- Han (2008) Han Z., 2008, A&A, 484, L31
- Han et al. (2002) Han Z., Podsiadlowski P., Maxted P. F. L., Marsh T. R., Ivanova N., 2002, MNRAS, 336, 449
- Han et al. (2003) Han Z., Podsiadlowski P., Maxted P. F. L., Marsh T. R., 2003, MNRAS, 341, 669
- Han et al. (2007) Han Z., Podsiadlowski P., Lynas-Gray A. E., 2007, MNRAS, 380, 1098
- Iben (1967) Iben Jr. I., 1967, ARA&A, 5, 571
- Kauffmann (1996) Kauffmann G., 1996, MNRAS, 281, 487
- Kaviraj et al. (2008) Kaviraj S., et al., 2008, MNRAS, 388, 67
- Kennicutt (1998) Kennicutt Jr. R. C., 1998, ARA&A, 36, 189
- Khochfar & Silk (2006) Khochfar S., Silk J., 2006, ApJ, 648, L21
- Kobayashi (2004) Kobayashi C., 2004, MNRAS, 347, 740
- Koekemoer et al. (2003) Koekemoer A. M., Fruchter A. S., Hook R. N., Hack W., 2003, in Arribas S., Koekemoer A., Whitmore B., eds, HST Calibration Workshop : Hubble after the Installation of the ACS and the NICMOS Cooling System. p. 337
- Komatsu et al. (2009) Komatsu E., et al., 2009, ApJS, 180, 330
- La Barbera & de Carvalho (2009) La Barbera F., de Carvalho R. R., 2009, ApJ, 699, L76
- La Barbera et al. (2003) La Barbera F., Busarello G., Massarotti M., Merluzzi P., Mercurio A., 2003, A&A, 409, 21
- La Barbera et al. (2005) La Barbera F., de Carvalho R. R., Gal R. R., Busarello G., Merluzzi P., Capaccioli M., Djorgovski S. G., 2005, ApJ, 626, L19
- Lardo et al. (2012) Lardo C., Pancino E., Mucciarelli A., Milone A. P., 2012, A&A, 548, A107
- Larson et al. (1980) Larson R. B., Tinsley B. M., Caldwell C. N., 1980, ApJ, 237, 692
- Lidman et al. (2008) Lidman C., et al., 2008, A&A, 489, 981
- Lidman et al. (2013) Lidman C., et al., 2013, MNRAS, 433, 825
- Lonoce et al. (2014) Lonoce I., Longhetti M., Saracco P., Gargiulo A., Tamburri S., 2014, MNRAS, 444, 2048
- Madau et al. (2001) Madau P., Ferrara A., Rees M. J., 2001, ApJ, 555, 92
- Merlin & Chiosi (2006) Merlin E., Chiosi C., 2006, A&A, 457, 437
- Merlin et al. (2012) Merlin E., Chiosi C., Piovan L., Grassi T., Buonomo U., Barbera F. L., 2012, MNRAS, 427, 1530
- Merritt (1983) Merritt D., 1983, ApJ, 264, 24
- Merritt (1984) Merritt D., 1984, ApJ, 276, 26
- Mihos (1995) Mihos J. C., 1995, ApJ, 438, L75
- Mullis et al. (2005) Mullis C. R., Rosati P., Lamer G., Böhringer H., Schwope A., Schuecker P., Fassbender R., 2005, ApJ, 623, L85
- Naab et al. (2007) Naab T., Johansson P. H., Ostriker J. P., Efstathiou G., 2007, ApJ, 658, 710
- Nakamura & Umemura (2001) Nakamura F., Umemura M., 2001, ApJ, 548, 19
- Nonino et al. (2009) Nonino M., et al., 2009, ApJS, 183, 244
- O’Connell (1999) O’Connell R. W., 1999, ARA&A, 37, 603
- O’Connell et al. (1992) O’Connell R. W., et al., 1992, ApJ, 395, L45
- Oser et al. (2010) Oser L., Ostriker J. P., Naab T., Johansson P. H., Burkert A., 2010, ApJ, 725, 2312
- Ostriker & Gnedin (1996) Ostriker J. P., Gnedin N. Y., 1996, ApJ, 472, L63
- Peacock (1999) Peacock 1999, Nature, 399, 322
- Peletier et al. (1990) Peletier R. F., Valentijn E. A., Jameson R. F., 1990, A&A, 233, 62
- Peng et al. (2002) Peng C. Y., Ho L. C., Impey C. D., Rix H.-W., 2002, AJ, 124, 266
- Peng et al. (2015) Peng Y., Maiolino R., Cochrane R., 2015, Nature, 521, 192
- Piotto et al. (2005) Piotto G., et al., 2005, ApJ, 621, 777
- Pipino & Matteucci (2004) Pipino A., Matteucci F., 2004, MNRAS, 347, 968
- Ponder et al. (1998) Ponder J. M., et al., 1998, AJ, 116, 2297
- Rawle et al. (2010) Rawle T. D., Smith R. J., Lucey J. R., 2010, MNRAS, 401, 852
- Rosati et al. (2009) Rosati P., et al., 2009, A&A, 508, 583
- Saglia et al. (2000) Saglia R. P., Maraston C., Greggio L., Bender R., Ziegler B., 2000, A&A, 360, 911
- Saracco et al. (2014) Saracco P., et al., 2014, A&A, 567, A94
- Saracco et al. (2017) Saracco P., Gargiulo A., Ciocca F., Marchesini D., 2017, A&A, 597, A122
- Shields (1978) Shields G. A., 1978, Nature, 272, 706
- Sommer-Larsen & Toft (2010) Sommer-Larsen J., Toft S., 2010, ApJ, 721, 1755
- Tacchella et al. (2016) Tacchella S., Dekel A., Carollo C. M., Ceverino D., DeGraf C., Lapiner S., Mandelker N., Primack J. R., 2016, MNRAS, 458, 242
- Tamura & Ohta (2000) Tamura N., Ohta K., 2000, AJ, 120, 533
- Tortora et al. (2010) Tortora C., Napolitano N. R., Cardone V. F., Capaccioli M., Jetzer P., Molinaro R., 2010, MNRAS, 407, 144
- Wagner et al. (2015) Wagner C. R., et al., 2015, ApJ, 800, 107
- Wild et al. (2014) Wild V., et al., 2014, MNRAS, 440, 1880
- Williams et al. (2009) Williams R. J., Quadri R. F., Franx M., van Dokkum P., Labbé I., 2009, ApJ, 691, 1879
- Williams et al. (2010) Williams R. J., Quadri R. F., Franx M., van Dokkum P., Toft S., Kriek M., Labbé I., 2010, ApJ, 713, 738
- Wu et al. (2005) Wu H., Shao Z., Mo H. J., Xia X., Deng Z., 2005, ApJ, 622, 244
- Wuyts et al. (2009) Wuyts S., et al., 2009, ApJ, 700, 799
- Yi et al. (2011) Yi S. K., Lee J., Sheen Y.-K., Jeong H., Suh H., Oh K., 2011, ApJS, 195, 22
Appendix A Surface Brightness Profiles
ID R R (b/a)850 R [mag] [kpc] [mag] [kpc] [mag] [kpc] 358 6.00.4 24.50.2 1.10.1 6.00.4 23.50.1 1.50.2 0.60.1 — — — 595 5.70.3 22.90.1 2.10.3 5.60.3 21.60.1 3.50.5 0.90.1 4.50.1 19.20.1 2.50.1 684 6.00.4 24.10.2 0.60.1 6.00.4 22.90.1 1.40.2 0.60.1 4.00.1 20.90.1 0.80.1 692 4.00.2 24.70.2 1.30.1 4.10.2 23.50.2 1.50.2 0.70.1 3.00.1 21.00.1 0.90.1 837 6.00.2 23.30.1 4.30.6 6.00.4 21.90.1 7.81.1 0.70.1 6.00.2 19.40.1 5.20.2 1284 4.30.3 23.40.1 2.00.3 4.30.2 22.30.1 2.40.3 0.90.1 4.00.1 20.00.1 1.70.1 1539 4.80.3 23.70.2 1.10.1 3.50.2 22.70.1 1.50.2 0.60.1 — — — 1740 3.30.2 21.80.1 13.32.0 3.30.2 20.80.1 12.81.9 0.60.1 4.60.1 17.80.1 20.70.9 1747 4.30.2 24.70.2 0.70.1 4.80.3 23.30.1 1.70.2 0.60.1 4.00.2 21.10.1 0.90.1 1758 2.90.2 23.90.2 1.90.2 2.90.2 22.60.1 2.50.3 0.80.1 2.900.04 20.30.1 1.50.1 1782 2.60.2 23.50.1 1.60.1 3.60.2 22.50.1 3.40.5 0.60.1 3.110.04 19.50.1 2.20.1 1790 4.40.3 23.10.1 1.90.2 4.40.3 21.90.1 2.40.3 0.60.1 4.10.1 19.30.1 2.30.1 2054 5.00.3 23.20.1 2.70.4 4.40.3 21.90.1 4.20.6 0.70.1 5.00.1 19.50.1 3.70.2 2147 5.40.3 23.50.1 3.60.5 5.30.3 22.20.1 5.30.8 0.70.1 4.00.1 20.00.1 2.30.1 2166 3.60.2 22.60.1 1.20.1 3.00.2 21.50.1 1.40.1 0.60.1 — — — 2429 2.10.4 24.30.2 0.60.1 2.10.2 23.00.1 0.90.1 0.60.1 2.10.1 21.00.1 0.90.1 2809 4.80.3 23.30.1 1.20.1 3.20.2 22.70.1 1.40.2 0.60.1 — — —
As described in Section 3.2 we have derived the surface brightness profiles by fitting a Sérsic law (equation 1).
The fitting was performed over a box of 7.5 7.5 arcsec2 centred on the centroid of each galaxy derived by SExtractor. To fix the fitting box and the convolution box sizes (7.5 7.5 arcsec2), we repeatedly fitted the surface brightness profiles by increasing the boxes size until the best-fitting parameters values converged. We masked sources distant from our targets using the segmentation image generated by SExtractor, while we fitted simultaneously the sources close to the target galaxies in order to avoid the overlapping of the light profiles. For few galaxies (two in the F775W and in the F850LP images, two in the F160W band and one in all the three images), the fitting procedure was not able to converge. Hence, we re-performed the fit in that band several times for different fixed values of and for each of them we obtained a set of structural parameters as output. We chose as best solution the set of structural parameters for which the was the lowest and the residual map was lacking of residual structures. The structural parameters obtained through the fit are shown in Table 6. The goodness of the fits is shown in Fig. 13, where the observed surface brightness profiles of the galaxies are compared with the best-fitting models generated by galfit. The surface brightness has been measured within circular annuli centred on each galaxy and it is plotted in blue (F775W), red (F850LP) and green (F160W). The error bars are obtained by propagating the errors on fluxes measured within the concentric annuli. In all the cases, a range of at least five magnitudes in surface brightness has been covered in the profiles of the galaxies which extend up to at least 2 for the largest galaxies. For the galaxies with a small ( arcsec) the observed brightness profiles extend up to 3 - 4 .
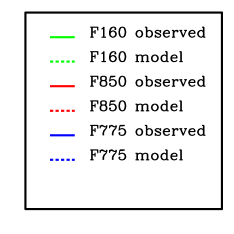
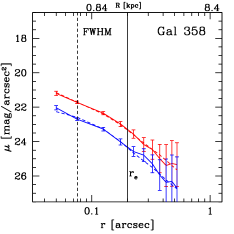
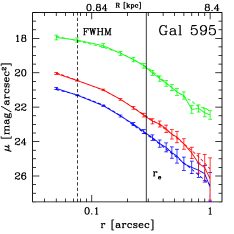
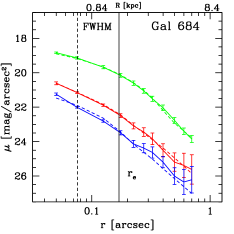
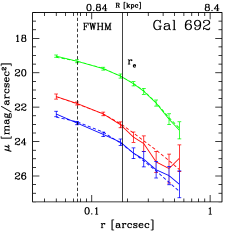
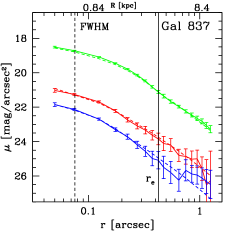
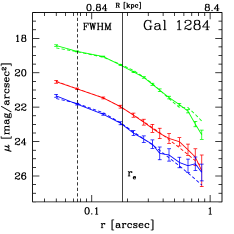
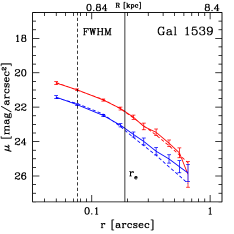
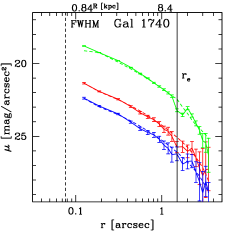
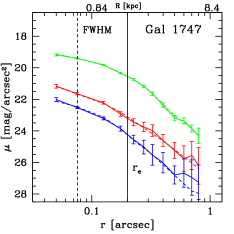
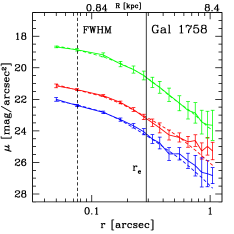
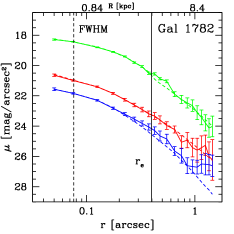
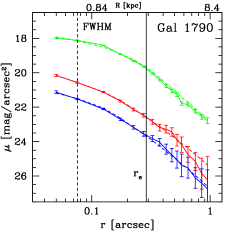
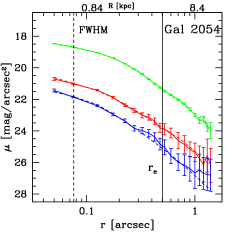
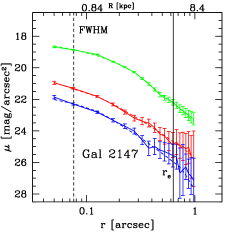
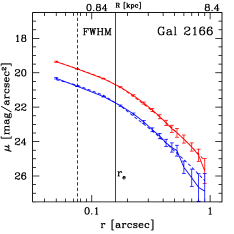
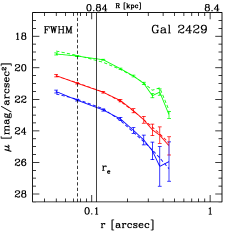
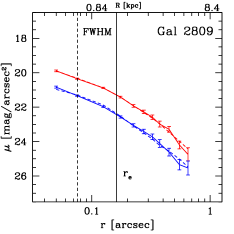
A.1 Simulations
In order to test for the absence of possible systematics introduced by the fitting algorithm and to derive reliable statistical errors for the structural parameters, we performed the same fitting procedure used for real galaxies to a set of simulated galaxies. In particular, to test for the absence of systematics, we generated with galfit a set of galaxies described by a Sérsic profile with effective radius , index of concentration and magnitude assigned in the ranges arcsec, and mag. The simulated galaxies have been convolved with the ACS-F850LP PSF and embedded in the real background, constructed by cutting different portions devoid of sources from the real image. For each structural parameters we verified how the output values vary as a function of the input values, keeping fixed the other two structural parameters. In Fig. 14 we show the output values and versus the input values and (left panel and right panel, respectively). For and arcsec galfit recovers exactly the input values. For and arcsec the output and are, on average, underestimated of 8 per cent and 15 per cent, respectively. These underestimates are negligible compared to the statistical errors and they are possibly due to the fact that, for galaxies having larger surface brightness profile tails, we miss a fraction of the profile since it is dominated by the background. This would drop the brightness profile and favour lower values of in the fitting. Since the galaxies of our sample have arcsec and , we did not apply any correction to the values of the structural parameters obtained by the fitting.
We also verified for each structural parameter whether a dependence of the output values on the input values of the other structural parameters was present (e.g., output versus input and ) and no systematics were found.
To derive the statistical uncertainties of each parameter, that is how the background RMS affects the estimates of the structural parameters, we have considered a subsample of the simulated galaxies and we embedded each of them in 10 different real backgrounds. Then, for each galaxy, we have run galfit to derive the best-fitting parameters for the 10 different backgrounds. The standard deviation of the mean has been adopted as indicator of the statistical fluctuations.
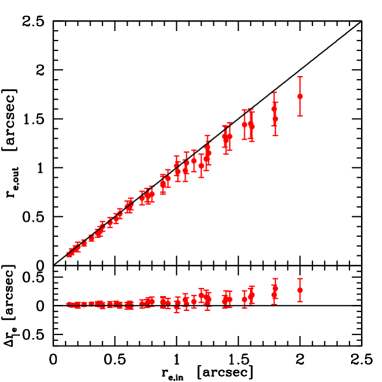
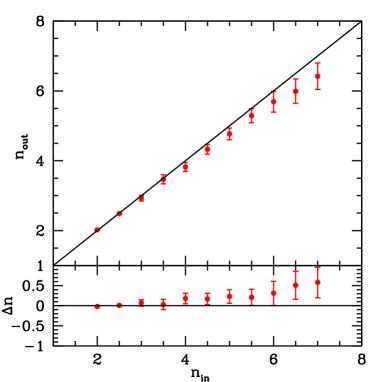
Appendix B Colour Gradients
In this section, we show the colour gradients derived for the whole sample. In particular, in Fig. 15 we show the F775W - F850LP colour gradients and in Fig. 16 we show the F850LP - F160W colour gradients. In all the figures, the variation colour on the y-axis is 1 mag for the F775W-F850LP colour and it is 0.9 mag for the the F850LP-F160W colour.
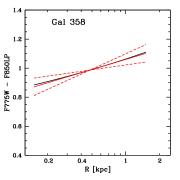
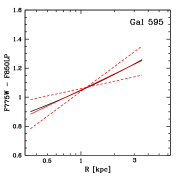
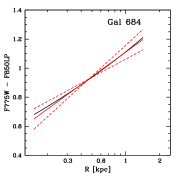
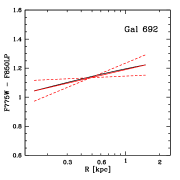
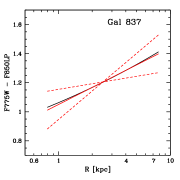
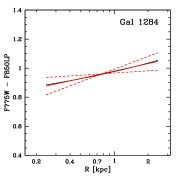
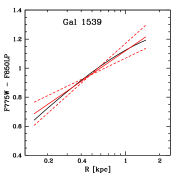
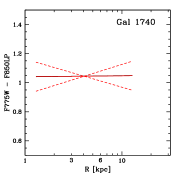
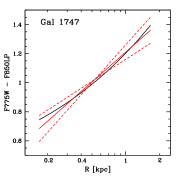
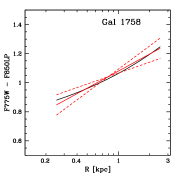
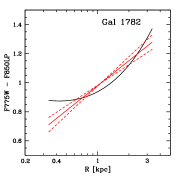
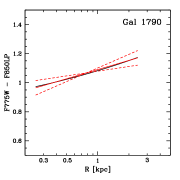
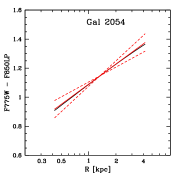
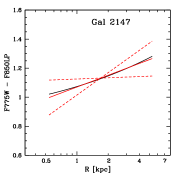
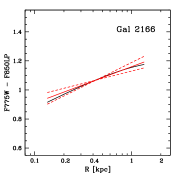
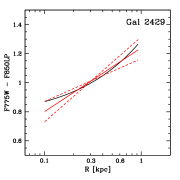
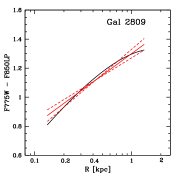
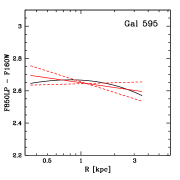
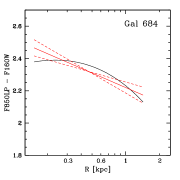
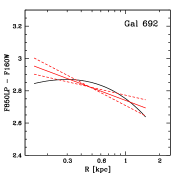
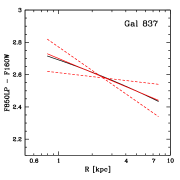
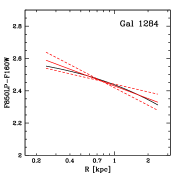
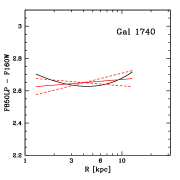
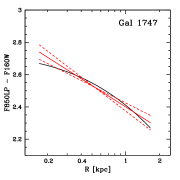
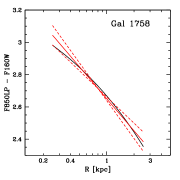
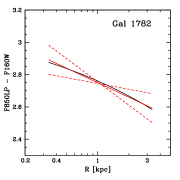
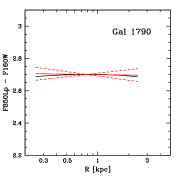

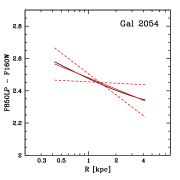
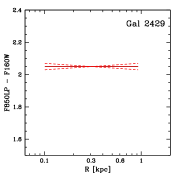
Appendix C Comparison with Chan et al. 2016
In this Appendix we compare our sample with the one by Chan et al. (2016). The criteria adopted to select the two samples are different. In our analysis, we adopted the ACS-F850LP image for the object detection with SExtractor and as reference in the morphological and structural analysis, given its high resolution ( arcsec) and small pixel scale (0.05 arcsec pixel-1) when compared to the WFC3-F160W image (FWHM arcsec; 0.123 arcsec pixel-1). Furthermore, we selected galaxies (see Section 2.2) at magnitudes F850LP, where the sample is 100 per cent complete, according to their F775W-F850LP colour and on the basis of their elliptical morphology. Chan et al., instead, used the WFC3-F160W image for object detection with SExtractor and as reference, and selected 36 passive galaxies according to their red sequence colour from the colour-magnitude diagram ((F850LP-F160W) versus F160W). They also applied a magnitude cut of < 22.5 mag, which corresponds to a completeness of 95 per cent.
We verified that 12 out to the 17 ellipticals of our sample are in common with Chan et al. Four of our galaxies (358, 1539, 2166, 2809) are not included in their sample since they fall outside the smaller field covered by the WFC3 (5 arcmin2 instead of 11 arcmin2 of the ACS). Moreover, also galaxy 1747 is not included in their sample. We verified that its F850LP-F160W colour would be consistent with their colour selection. However, its magnitude (F160W = 22.6 mag, in our sample) seems to be slightly fainter than the cut they applied. This could be the reason why it is not included in their sample. In Fig. 17 we show the comparison between the F850LP-F160W colour of the 12 galaxies in common, after having transformed their colours from AB to Vega magnitudes. We find that our F850LP-F160W colours (mean value 2.660.25 mag) are consistent with those derived by Chan et al. (mean value 2.620.19 mag).
The structural parameters of the galaxies have been derived, in both the analyses, using the software galfit. Since the authors do not report the structural parameters derived in the F775W and F850LP bands, we only compare the structural parameters derived in the F160W band. The results are shown in Fig. 18, where in the left panel we compare the Sérsic indices and in the right panel we compare the effective radii Re. We found a good agreement between our and their estimate of the effective radii (<Re/R1) and also between the indices . For three galaxies (595, 684 and 837) we obtained from the fit a smaller value of the index (< - > = -1.78). However, we verified through the simulations that an eventual underestimate of does not affect the estimate of the effective radii and, hence, of the colour gradients.
Finally, we compared the colour gradients. Chan et al. derived only the F850LP-F160W gradients from the observed colour profiles up to 3.5 (=major axis), whereas we derived colour gradients through three different methods. Actually, we can not properly compare their observed colour gradients with ours since they used elliptical apertures taking as reference the F160W image, whereas we measured the fluxes within circular aperture starting from F850LP image. The different apertures used can affect the estimates of the colour gradients, causing a scatter between the measured colour gradients. Most importantly, as discussed in Section 4, reliable estimates of colour gradients can be derived within the region where the S/N is high in all the bands considered. Fig. 20 shows the observed F850LP - F160W colour profiles up to 3.5 for galaxies 595 and 837, having effective radius of 3.5 and 7.8 kpc. Blue dashed line represents the effective radius of the galaxies as derived in the F850LP band, while red dashed line represents 3.5 as derived in the F160W band by Chan et al. We can see that for R 1.5Re the colour profiles of the two galaxies are dominated by the sky noise of the F850LP band, which introduces a spurious contribution in the estimate of the colour gradients. This is the reason why we derived the colour gradients at most up to 2Re. For R 2Re, the estimates of the colour gradients are not reliable given the depth reached by the ACS image.
For two galaxies (595 and 684) Chan et al. derived a positive gradient, whereas we measured a negative gradient. Actually, as can be seen, one of the two (684 in our sample) is affected by a large uncertainty that makes it consistent even also with a negative gradient. In Fig. 13 we show the surface brightness profiles we derived for these galaxies in the three HST bands (third and fourth panels, respectively) and in Fig. 16 we show their colour profiles, which clearly present a negative trend. Since the authors do not report the effective radii in the F850LP band, to investigate why they derived positive gradients for these two galaxies, we compare our Re in the F850LP with their Re in the F160W image. The results are shown in Fig. 19 (right panel). We plotted in blue the effective radii of galaxies 595 and 684. These galaxies have a ratio Re,850/Re,160 > 1, so they should present a negative colour gradient. Indeed, if this ratio is , the light is more concentrated in the reddest band considered and the colour gradient is negative; the opposite happens for values of the ratio. Since, instead, Chan et al. measured a positive gradient for these two galaxies, it follows that the Re they derived in the F850LP image is smaller than the Re they derived in the F160W image. However, as shown in Fig. 19 (left panel), we find that systematically all the galaxies (with the exception of the central one) have the Re in the F160W smaller than the Re in the F850LP: . We are not able to explain the reason why the radii of 595 and 684 should deviate from this behaviour.