Selection bias in dynamically-measured super-massive black hole samples: dynamical masses and dependence on Sérsic index
Abstract
We extend the comparison between the set of local galaxies having dynamically measured black holes with galaxies in the Sloan Digital Sky Survey (SDSS). We first show that the most up-to-date local black hole samples of early-type galaxies with measurements of effective radii, luminosities, and Sérsic indices of the bulges of their host galaxies, have dynamical mass and Sérsic index distributions consistent with those of SDSS early-type galaxies of similar bulge stellar mass. The host galaxies of local black hole samples thus do not appear structurally different from SDSS galaxies, sharing similar dynamical masses, light profiles and light distributions. Analysis of the residuals reveals that velocity dispersion is more fundamental than Sérsic index in the scaling relations between black holes and galaxies. Indeed, residuals with could be ascribed to the (weak) correlation with bulge mass or even velocity dispersion. Finally, targetted Monte Carlo simulations that include the effects of the sphere of influence of the black hole, and tuned to reproduce the observed residuals and scaling relations in terms of velocity dispersion and stellar mass, show that, at least for galaxies with and , the observed mean black hole mass at fixed Sérsic index is biased significantly higher than the intrinsic value.
keywords:
(galaxies:) quasars: supermassive black holes – galaxies: fundamental parameters – galaxies: nuclei – galaxies: structure – black hole physics1 Introduction
The scaling relations between supermassive black holes and their host galaxies have been a very hot topic in the last thirty years (see, e.g., Ferrarese & Ford, 2005; Shankar, 2009; Graham, 2016, for reviews). This is because such scalings may be the smoking gun of a “co-evolution” between the two systems (e.g., Silk et al., 2013), although the physical processes involved are still highly debated, ranging from quasar feedback to black hole mergers, clumpy accretion, and/or galaxy-scale gravitational torques (e.g., Silk & Rees, 1998; Vittorini et al., 2005; Jahnke & Macciò, 2011; Bournaud et al., 2011b; Anglés-Alcázar et al., 2015). Besides the well-known correlations with velocity dispersion (Ferrarese & Merritt, 2000; Gebhardt & et al., 2000) and (bulge) stellar mass (e.g., Marconi & Hunt, 2003; Lauer et al., 2007; Kormendy & Ho, 2013; Läsker et al., 2014; Saglia et al., 2016), correlations with the light concentration and Sérsic index have also been measured (e.g., Graham et al., 2001; Graham & Driver, 2007; Savorgnan, 2016, and references therein).
The correlation between black hole mass and Sérsic index, in particular, has been the subject of numerous studies in recent years. Some groups (e.g., Sani et al., 2011; Beifiori et al., 2012) have not detected any significant correlation, while more recently Savorgnan (2016), by compiling a larger galaxy sample with accurate and uniform photometric decompositions, has claimed a significant correlation characterized by a slope of and an intrinsic scatter of dex. The scatter is comparable to, or even smaller than, the one in the scaling with velocity dispersion, paving the way for its use as a black hole mass indicator in galaxies (e.g., Graham et al., 2007; Mutlu Pakdil et al., 2016).
Unveiling the actual existence of the black hole-Sérsic index relation could be a key piece of evidence for some important galaxy evolutionary patterns. For example, more or less violent disc instabilities in gas-rich, high-redshift discs could feed both an inner bulge and a central black hole (e.g., Bournaud et al., 2011a). A progressively more prominent bulge component, possibly characterized by a proportionally increasing galaxy Sérsic index, may then be able to halt star formation in the host galaxy (e.g., Martig et al., 2009; Dekel & Burkert, 2014). An initial correlation between black hole mass and Sérsic index could have thus been established by these high-redshift dissipative processes. If galaxy mergers have been the actual drivers behind the origin of the large sizes and high Sérsic indices in present-day massive galaxies (e.g., Hilz et al., 2013; Nipoti, 2015), then black holes should have necessarily followed in some degree their host galaxy mergers to preserve a correlation with Sérsic index.
On the other hand, both disc instabilities and repeated black hole mergers should also induce the build-up of a closer link between black hole mass and stellar mass (e.g., Jahnke & Macciò, 2011), at variance with the recent results by our group (Shankar et al., 2016, Paper I hereafter) and others (Bluck et al., 2016; van den Bosch, 2016). In Paper Iwe showed that, following a number of previous claims (e.g., Bernardi et al., 2007; van den Bosch et al., 2015), the local sample of galaxies with dynamically-measured supermassive black holes is highly biased with respect to an unbiased large sample of galaxies of similar stellar mass. In particular, black hole galactic hosts appear to have significantly higher velocity dispersion (and slightly lower sizes) at fixed stellar mass. Paper I used Monte Carlo simulations and residual analysis to show that such biases can result if the sample of local galaxies is preselected with the requirement that the black hole sphere of influence must be resolved to measure black hole masses with spatially resolved kinematics. The same simulations and statistical analysis clearly point to velocity dispersion being more fundamental than stellar mass or effective radius, and predict significantly lower normalizations for the intrinsic scaling relations. The latter partly solves the systematic discrepancy between dynamically-based black hole-galaxy scaling relations versus those of active galaxies (e.g., Reines & Volonteri, 2015), favouring proportionally lower virial calibration factors for estimating black hole masses in active galaxies (e.g., Ho & Kim, 2014).
However, it is possible that some of the bias may be induced by real structural differences, i.e., physical effects could also be playing a role. One of the two aims of this Letter is to address the question of structural differences between local galaxies with dynamically-measured black holes and their counterparts in large unbiased samples of galaxies. After briefly introducing the data adopted in this work in Section 2, we focus on dynamical masses and (bulge) Sérsic distributions in Section 3. We then move to the second aim of this work, which is to compare the importance of Sérsic index with other variables in the black hole scaling relations, in order to determine if plays a fundamental role. We use dedicated Monte Carlo simulations to interpret our results and present our conclusions in Section 4. Two Appendices provide details of our analysis. Appendix A describes how our analysis accounts for statistical measurement errors, and Appendix B shows how the slopes of correlations involving three variables are related to slopes of pairwise regressions.
2 Data
Following Paper I, we use the Savorgnan et al. (2016) sample of galaxies having dynamically measured black holes, with self-consistent111The same surface brightness profile fitting procedure has been adopted for each of the 66 galaxies in the sample. measurements of Sérsic luminosities, effective radii and Sérsic indices of the spheroidal components, as well as estimates of the total host galaxy luminosities and effective radii. Central velocity dispersions are from Hyperleda, while stellar masses are obtained by applying to the 3.6m (Spitzer) luminosities a constant mass-to-light ratio of from Meidt et al. (e.g. 2014). As detailed in Paper I, from the original sample of 66 galaxies we remove 18 objects with uncertain black hole mass and/or surface brightness, or unavailable central velocity dispersion, or because they are ongoing mergers. We checked that our results are not affected by the removal of these sources. The errors quoted by Savorgnan et al. (2016) on the photometric parameters include systematics (e.g., from comparison with different authors and analysis methods). However, since we will be interested in scaling relations - the estimate of which includes accounting for errors - we do not include the systematic contribution to the error on at this point. Specifically, we only account for random errors when estimating the intrinsic slope, zero-point and scatter. We assess the influence of systematics as follows. When a different analysis method is used to estimate the photometric parameters, then we use these new values to estimate scaling relations in the same way as before (i.e., accounting only for the random errors associated with these new values). The differences between the inferred scaling relations contribute to the systematic error on the inferred scaling relation. In practice, we used as the “other values” the sample of Läsker et al. (2014), which also includes accurate photometric analysis from the WIRcam imager at the Canada France Hawaii Telescope, with Sérsic-based light profile fitting routines. We retain 28 galaxies from their original sample, containing the most secure dynamical black hole mass measurements according to Kormendy & Ho (2013).
To represent the full galaxy sample, we use objects in the Sloan Digital Sky Survey (SDSS) DR7 spectroscopic sample (Abazajian et al., 2009) in the redshift range with the photometric measurements from Meert et al. 2015. Throughout this paper, we restrict the analysis to galaxies whose probability of being elliptical or lenticular (E–S0) is greater than , based on the Bayesian automated morphological classifier by Huertas-Company et al. (2011); we refer to this as the SDSS E-S0 sample222Following Paper I, when dealing with bulges we preferentially adopt E-S0 galaxies with (E–S0) as our reference SDSS comparison sample, because determining the central velocity dispersion of spirals from the SDSS spectra (which are not spatially resolved) is not possible. We checked, however, that none of our results depends on the exact cut in (E–S0).. When dealing with total stellar masses we will instead refer to only ellipticals with (E). Stellar masses are derived by combining the SerExp estimates of the luminosity from Meert et al. (2015) with mass-to-light ratios detailed in Bernardi et al. (2010, 2013) and Chabrier (2003) Initial Mass Function (IMF). Systematic differences in can be of order 0.1 dex (e.g. Bernardi et al., 2016). SDSS velocity dispersions are converted from to the 0.595 kpc aperture of the Hyperleda 333From here onwards, unless otherwise stated, velocity dispersions will always be defined at the aperture of Hyperleda. database (Paturel et al., 2003), using the mean aperture corrections (e.g., Jorgensen et al., 1996; Cappellari et al., 2006)
| (1) |
We note that blurring by seeing effects could potentially reduce central velocity dispersion measurements (e.g., Graham et al., 1998), however we do not foresee any major difference in the seeing affecting ground-based measurements of in SDSS and those catalogued in Hyperleda. Strictly speaking, the Sérsic index we will adopt in this work is always referred to the galaxy spheroidal component extracted from a SerExp luminosity profile fitting in both the SDSS and the Savorgnan et al. (2016) and Läsker et al. (2014) samples. The half-light radii and are defined as the radii containing half of the bulge and total galaxy luminosity, respectively. In the following, we will label the total galaxy stellar mass, galaxy bulge stellar mass, total galaxy dynamical mass, and galaxy bulge dynamical mass as , , , and , respectively. In the next sections, unless otherwise noted, we will compute median instead of mean quantities. While this makes little difference when dealing with stellar/dynamical masses or velocity dispersions, it matters more with the (non-Gaussian) Sérsic distributions at fixed stellar mass, for which medians are more appropriate.
3 Results
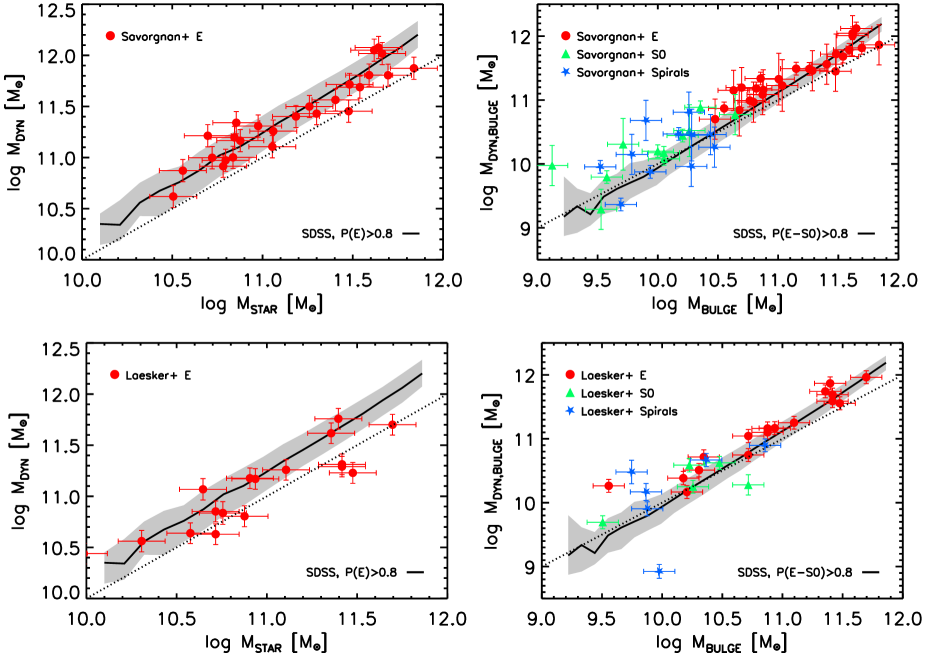
To test the hypothesis that galaxies with dynamically-measured black holes are a structurally different subset of the full galaxy population – represented by the SDSS – Figure 1 shows the mean dynamical mass (solid lines), along with its 1 dispersion (grey bands), for the SDSS E-S0 galaxies as a function of total (left panels) and bulge (right panels) stellar mass. The SDSS E-S0s are compared to the Savorgnan et al. (2016) and Läsker et al. (2014) samples (top and bottom panels, respectively), divided into ellipticals, lenticulars/S0, and spirals, as labelled. Here dynamical mass is always computed for both samples as , with the Sérsic index-dependent virial constant taken from Prugniel & Simien (1997). It is clear that the bulge dynamical mass of all galaxy types in the Savorgnan et al. (2016) and Läsker et al. (2014) samples broadly agree with those of SDSS E-S0s galaxies of similar stellar mass. The data tend to show slightly larger dynamical bulge masses at lower stellar bulge masses (right panels in Figure 1), most probably induced by the very large velocity dispersions characterizing the low mass galaxies with dynamical measurements of black holes, as emphasized in Paper I. However, most of the Savorgnan et al. (2016) and Läsker et al. (2014) data are still broadly consistent with SDSS galaxies within the quoted uncertainties. In line with a number of previous studies (e.g., Forbes et al., 2008; Shankar & Bernardi, 2009; Bernardi et al., 2011b; Cappellari et al., 2013, and references therein), it is also interesting to note that in both the SDSS and Savorgnan et al. (2016) samples all ellipticals have a dynamical mass a factor of higher than their total stellar mass (left); this ratio is smaller but still greater than unity if only the bulge component is used (right; compare solid and dotted lines, the latter marking the one-to-one relations).
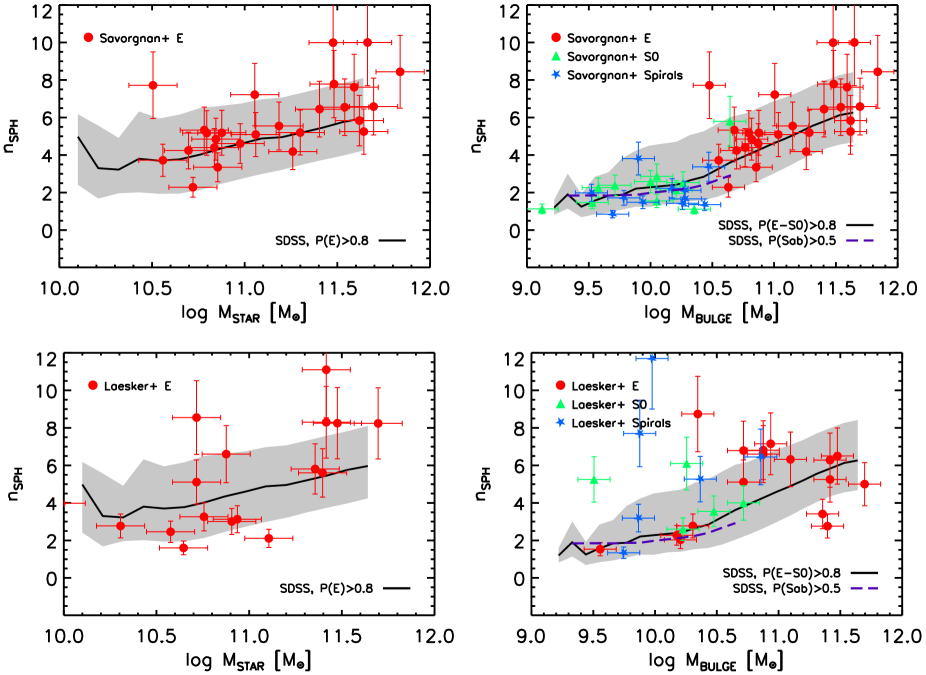
Figure 2 shows the correlation between Sérsic and total (left) or bulge (right) stellar mass. Solid lines and grey regions mark the median and 1 dispersions for the SDSS only E (left) or E-S0s (right). Symbols show the hosts from Savorgnan et al. (2016, top panels) and Läsker et al. (2014, bottom panels). The panels on the left show that ellipticals (red circles) match the SDSS Sérsic index distributions. The match is extended to lenticulars (green triangles) when switching to bulge stellar masses (right panel). Spirals (blue stars) in the Savorgnan et al. (2016) sample (top, right) tend to fall slightly below the median traced by the SDSS E-S0 galaxies, but are within the median Sérsic distributions of E-S0 and consistent with the Sab (purple long-dashed line) SDSS galaxies. Thus, the top panels of Figure 2 suggest that local galaxies with black hole mass measurements are not, on average, structurally different from SDSS galaxies of similar stellar mass.
The bottom panels show a similar analysis of the Läsker et al. (2014) sample. In both panels, the correlations are much noisier than before. Spirals tend to lie somewhat above the median SDSS Sérsic index of SDSS galaxies. In fact, the symbols in the bottom right panel suggest that decreases as increases; this is opposite to the trend in the Savorgnan et al. (2016) sample, and will be important in what follows. This difference shows how challenging accurate determinations of Sérsic indices can be. Finally, we also verified that, for the early-type galaxies in our black hole mass samples, the projected mass density within a few kpc are similar to, if not lower than those of SDSS galaxies of similar bulge mass or velocity dispersion.
Figure 3 shows that the mean velocity dispersion as a function of Sérsic index for early-type galaxies in our SDSS sample (long-dashed purple line) is rather flat444In contrast, the mean Sérsic index is a steeper function of velocity dispersion, though the scatter is large. at . A direct fit to the data by Savorgnan et al. (2016), reported in the left panel of Figure 3 and labelled per morphological type, yields a systematically higher and steeper correlation with (black thick dotted line). We interpret this as another sign of existing biases in the local sample of galaxies with dynamical measurements of black holes, in line with Paper I. The Läsker et al. (2014) sample instead (right panel of Figure 3) appears broadly consistent with SDSS data, with a negligible dependence on Sérsic index, especially at high , as in our SDSS data. In Figure 3 we only show galaxies with , to make a fair comparison with our (selection biased) SDSS E-S0 mock sample, described in the next section, which can reliably probe only above this lower limit in bulge mass.
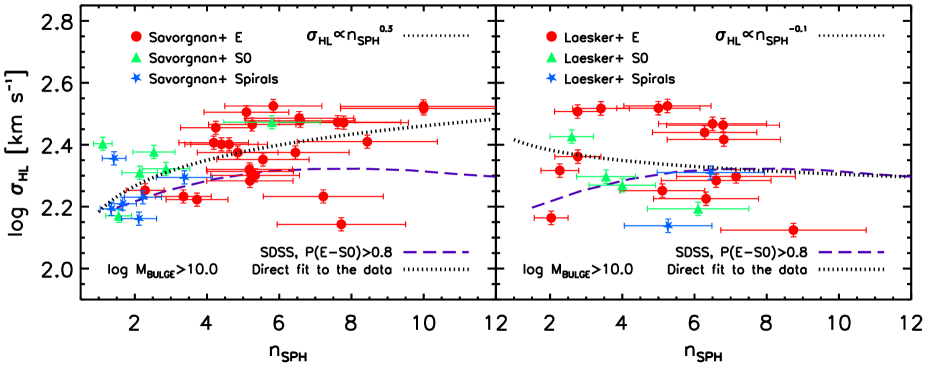
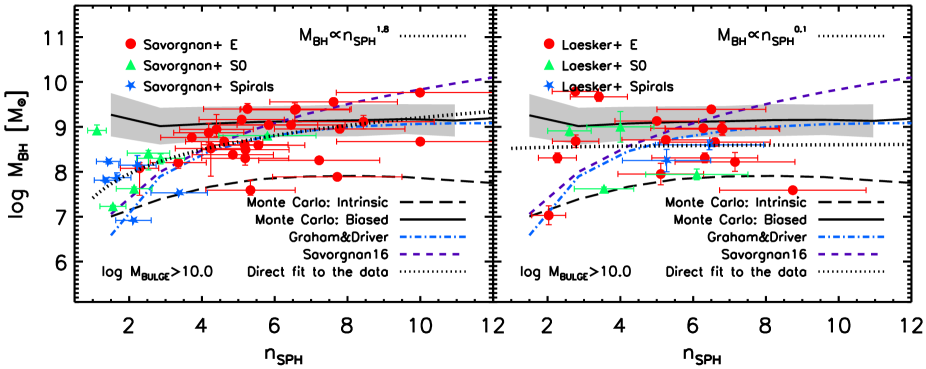
Figure 4 shows the correlation between black hole mass and bulge Sérsic index . Symbols show the galaxies in the Savorgnan et al. (2016) and Läsker et al. (2014) samples (left and right panels respectively) having . Blue dot-dashed and purple dotted lines are the curved relations described by Graham & Driver (2007) and Savorgnan (2016), respectively. We describe the grey regions and other curves later. A direct fit to the Savorgnan et al. (2016) and Läsker et al. (2014) data yields and , respectively. The Appendix addresses the question of whether or not such (different) behaviours would be expected if black hole mass is closely correlated with velocity dispersion, as emphasized in Paper I, but the - trends for the two samples are ery different (as shown in Figure 3).
For this purpose, we now test if the correlation between black hole mass and Sérsic index, evident at least in the Savorgnan et al. (2016) sample, is fundamental, or merely a consequence of others. Correlations between the residuals of scaling relations are an efficient way of addressing this question (Sheth & Bernardi, 2012, and Paper I).
The original errors assigned to the Savorgnan (2016) sample include both the statistical as well as the systematic errors that affect photometric decompositions. This is a particularly relevant issue for Sérsic indices. The quoted errors in are in fact of the order of , while typical statistical errors amount to at most , i.e., 0.1 dex (Bernardi et al., 2014). As discussed in Section 2, when computing residuals with respect to , we will always consider only the statistical dex errors. The difference in the measured slopes from different samples should then provide an indication of the impact of additional systematic uncertainties. We note that the impact of systematic uncertainties should not be included in any single measurement simply by inflating the measured statistical uncertainties. For similar reasons we adopt typical average errors for the bulge stellar masses of 0.13 dex, i.e., 30% (see, e.g., Meert et al., 2013), instead of their reported average value of dex. Appendix A describes in some detail how we account for statistical measurement errors, and assign error bars in the analysis which follows.
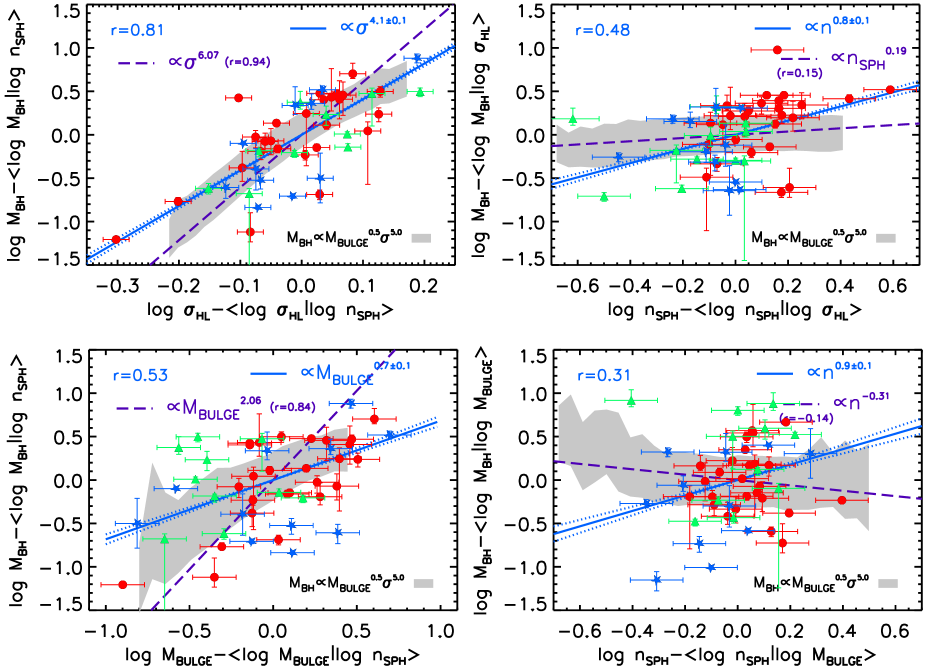
The upper left panel of Figure 5 shows that residuals in the Savorgnan (2016) sample from the - relation correlate very well with those from the - relation: the Pearson coefficient is . In contrast, the upper right panel shows that residuals from the - relation show a much weaker correlation with those from the - correlation (). Together, the two upper panels imply .
Similarly, the two lower panels imply . However, the correlation with bulge mass at fixed (lower left panel) tends to be tighter than the one in Sérsic index at fixed (lower right panel has ). Both slope and Pearson correlation coefficient drop to about zero when considering only E-S0 galaxies, suggesting that most of the correlation in Figure 4 between black hole mass and Sérsic index could be induced by the relation between Sérsic index and stellar (bulge) mass. If barred galaxies are excluded from the Savorgnan et al. (2016) sample, then the Pearson coefficients in the two right hand panels of Figure 5 decrease to (top) and (bottom). Our analysis thus strongly suggests that velocity dispersion is more fundamental than Sérsic index, further supporting and extending the results in Paper I.
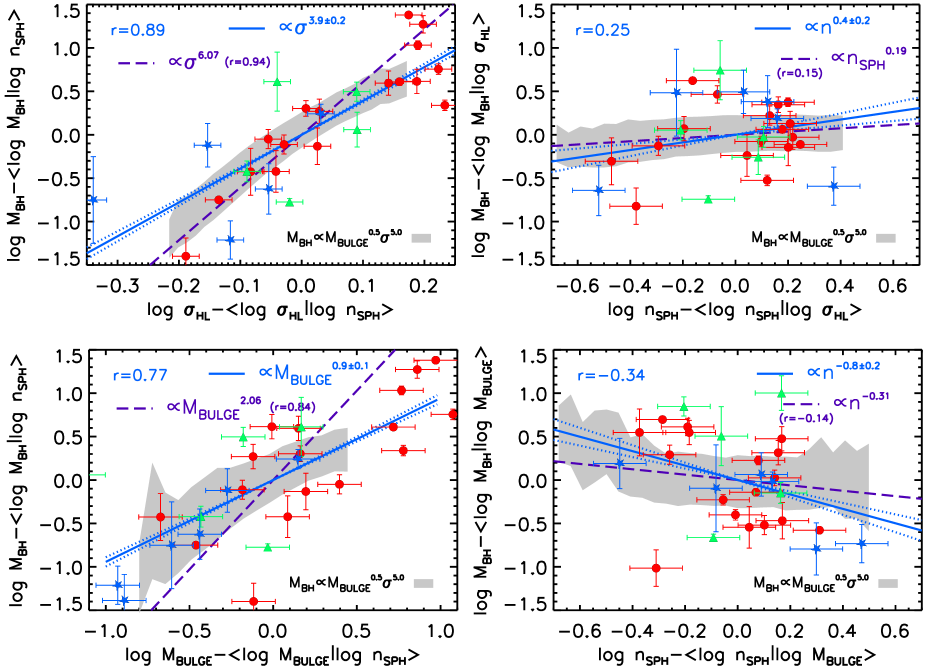
A similar analysis of the Läsker et al. (2014) sample, reported in Figure 6, also yields a tight correlation with velocity dispersion ( in upper left panel), and extremely weak correlations with Sérsic index ( in top and bottom right panels). Using only E-S0 galaxies yields even stronger dependence on velocity dispersion and nearly no dependence on Sérsic index. Even assuming substantially larger statistical uncertainties in still yields very weak correlations in the panels on the right. Finally, note that Läsker et al. (2014) also provide Sérsic indices derived allowing for a core in some galaxies (see Läsker et al., 2014, for details). Using these instead yields results consistent with Figure 6.
In the analyses above, the errors on velocity dispersions were taken to be 5% (e.g., Tremaine et al., 2002; Graham & Scott, 2013), in line with what is quoted in the Hyperleda data base. However, larger errors in velocity dispersion for these same galaxies have been reported in the literature (e.g., Ferrarese, 2002), in line with those measured for SDSS galaxies (e.g., Bernardi et al., 2011a). Larger errors in velocity dispersion would strengthen our main result that velocity dispersion is more fundamental than Sérsic index.
| X | ||||
|---|---|---|---|---|
| 2.05 | 0.36 | |||
| Y | 0.33 | 0.16 | ||
| 0.19 | 0.55 |
4 Discussion
In the previous section we showed that velocity dispersion is more fundamental than Sérsic index for determining . Indeed, the - correlation seems to be mostly induced by the - and - relations. However, because the sample is biased (to large ) by the way in which the sample was selected, we must make sure that the relations defined by the symbols in Figure 5 are not affected by the selection effect. We use targetted Monte-Carlo simulations to do so: details are given in Paper I, so here we briefly summarize the main points.
To each SDSS galaxy in our sample555The simulations are based on the SDSS sample from Meert et al. (2013) which is magnitude limited, though all mock residuals are weighted through . We have further verified that none of our conclusions are changed if we adopted a full mock case extracted from the stellar mass function and to which velocity dispersions, bulge fractions and Sérsic indices are assigned via empirically-based correlations. we associate a supermassive black hole following the favoured model in Paper I
| (2) |
with and a total (Gaussian) scatter of 0.25 dex (inclusive of observational errors). We repeat the above procedure several times to create a “full” black hole sample, and retain only those objects for which the gravitational sphere of influence is greater than the typical resolution of the Hubble Space Telescope, i.e., .
First, we note that the selection-biased mock residuals predicted by our Monte Carlos (gray bands in Figures 5 and 6), predict strong correlations, especially in velocity dispersion, at fixed Sérsic index (left panels), and weak correlations with Sérsic index, in agreement with the Läsker et al. (2014) sample, but not with the Savorgnan et al. (2016) one. It is interesting to note that the predictions of the Monte Carlos without selection bias (purple long dashed lines) would predict significantly steeper residuals at fixed Sérsic index (see the Appendix for further details).
The long-dashed black lines in Figure 4 shows the intrinsic - relation in our SDSS E-S0 sample predicted by Equation 2. It is remarkably flat, because velocity dispersion is a weak function of Sérsic index (Figure 3; see Appendix for more discussion.) The solid black line and associated grey region show the mean and dispersion in the predicted - relation of the selection biased sample (i.e., after selecting objects with large enough ). Notice that it lies almost an order of magnitude above the intrinsic relation at .
For completeness, blue dot-dashed and purple dotted lines in Figure 4 show fits to the observed - relation from Graham & Driver (2007) and Savorgnan (2016), respectively. At least for relatively massive, large early-type galaxies, these fits and the measurements are in broad agreement with the grey region defined by our selection-biased Monte Carlos. Hence, we conclude that at least some of the difference between the intrinsic relation (black long-dashed line) and the data at large can be ascribed to selection effects.
At smaller and lower the data by Savorgnan et al. (2016) tend to curve downwards as indicated by the fits, whereas our Monte Carlos do not. Including an intrinsic dependence between and , despite not being favoured by the residuals in Figure 5, still produces a flat biased - relation. It may be that other, possibly mass-dependent, selection effects should be included in our Monte Carlos to account for the Sérsic index distribution of the galaxies in the local samples of galaxies with dynamically measured black holes. See the Appendix for further discussion of the expected slopes of the grey regions in Figures 4–6.
To summarize, in this work we have compared SDSS early-type galaxies with the local sample of galaxies with dynamically-measured black holes from the Savorgnan et al. (2016) and Läsker et al. (2014) samples with self-consistent estimates of bulge luminosities, effective radii, and Sérsic indices. We find the latter sample to be consistent with SDSS galaxies in terms of dynamical mass and Sérsic index distributions. Analysis of the residuals in Figures 5 and 6, reveals that velocity dispersion is more fundamental than Sérsic index in the scaling relations between black holes and galaxies. Indeed, residuals with could be ascribed to the underlying correlations with and . Our conclusions are supported by targetted Monte Carlo tests that include the effects of the sphere of influence of the black hole. They show that, at least for galaxies with and , the observed median black hole at a given is biased higher than the intrinsic value by up to an order of magnitude, i.e., black hole masses are over-predicted at the high-mass end, as was also revealed for the - and - relations (Paper I).
Acknowledgments
We warmly thank Alister Graham, Giulia Savorgnan, and Ronald Läsker for providing their data in electronic format and for useful discussions.
Appendix A Accounting for measurement errors
To include errors in the determination of the correlations, especially those between residuals, we follow Bernardi et al. (2003) and Sheth & Bernardi (2012). For any set of measurements and (normalized) weights , we first compute the linear relations with slope and zero point given by
| (3) |
and
| (4) |
with the weighted averages and . The other quantities are
| (5) |
| (6) |
| (7) |
and
| (8) |
The terms and in Equation 7 represent the unknown measurement errors in the variables and ; only their variances and are known. The factor in Equation 8 accounts for correlation between the measurement errors and . We will always set except when calculating the slopes and residuals in the and correlations, for which we set (Meert et al., 2013), as the Sérsic index and galaxy luminosity are derived from the same fitting procedure.
In order to determine the final slope and correlation coefficient of the residual for each set of variables we proceed as follows. Suppose we have three variables, say, , , and . We first calculate the correlation coefficient for each pair as
| (9) |
and then compute the slope and correlation coefficient of the residual as
| (10) |
and
| (11) |
For each panel in Figures 5 and 6 we ran 200 iterations following the steps outlined above and, in a bootstrap fashion, each time eliminating three objects at random from the original samples. From the full ensemble of realizations we then compute the mean slope of the correlation and its 1 uncertainty, which we report in the right, upper corner of each panel, while the upper left corner reports the mean value of the Pearson coefficient . The analytic methodology described above is mainly intended for symmetric errors. To take into account the asymmetry in black hole mass uncertainties, for each correlation we ran 100 iterations considering only the positive error, and 100 iterations considering only the negative one. Considering instead the average or squared error in black hole mass yields consistent results within the uncertainties.
Appendix B Relation between coefficients in pairwise correlations and correlations between residuals
The main text addresses the question of whether or not the - correlation shown in Figure 4 is fundamental. We do so following Sheth & Bernardi (2012). Namely, we start with Equation 2 in the main text, with , and around which there is 0.25 dex scatter that does not depend on .
Averaging this expression over all at fixed yields
| (12) |
If is the slope of the relation, then we have that
| (13) |
which suggests defining
| (14) |
Similarly, averaging over all at fixed instead yields
| (15) |
where is the slope of the relation. This shows explicitly that and , but that the relation between the two depends on the two projections of the - correlation. In our SDSS sample, and , making when . These values of and are in agreement with those reported in the left panels of Figures 5 and 6 (long-dashed purple lines).
Of course, these relations should hold in the full sample: selection effects may modify these relations and introduce curvature. This is indeed what we observe in the residuals at fixed Sérsic index (left panels of Figures 5 and 6). Our Monte Carlos, inclusive of the selection bias in the black hole’s gravitational sphere of influence, predict significantly flatter, and in fact curved, residuals, roughly consistent with .
Similarly, if the 0.25 dex scatter around Equation 2 does not depend on , we expect correlations such as those in the top panels of Figures 5 and 6 to satisfy
| (16) |
whereas those in the bottom panels should scale as
| (17) |
These expressions show that, if the - correlation is driven by the correlation between and , and their correlations with , then the coefficients of correlations between residuals depend both on the black-hole parameters , and on the -- correlations. Specifically, in the top panels, the parameters which matter are those for , whereas it is which matters in the bottom panels. Averaging Equation 16 over at fixed yields
| (18) |
and this equals the result of averaging Equation 17 over at fixed :
| (19) |
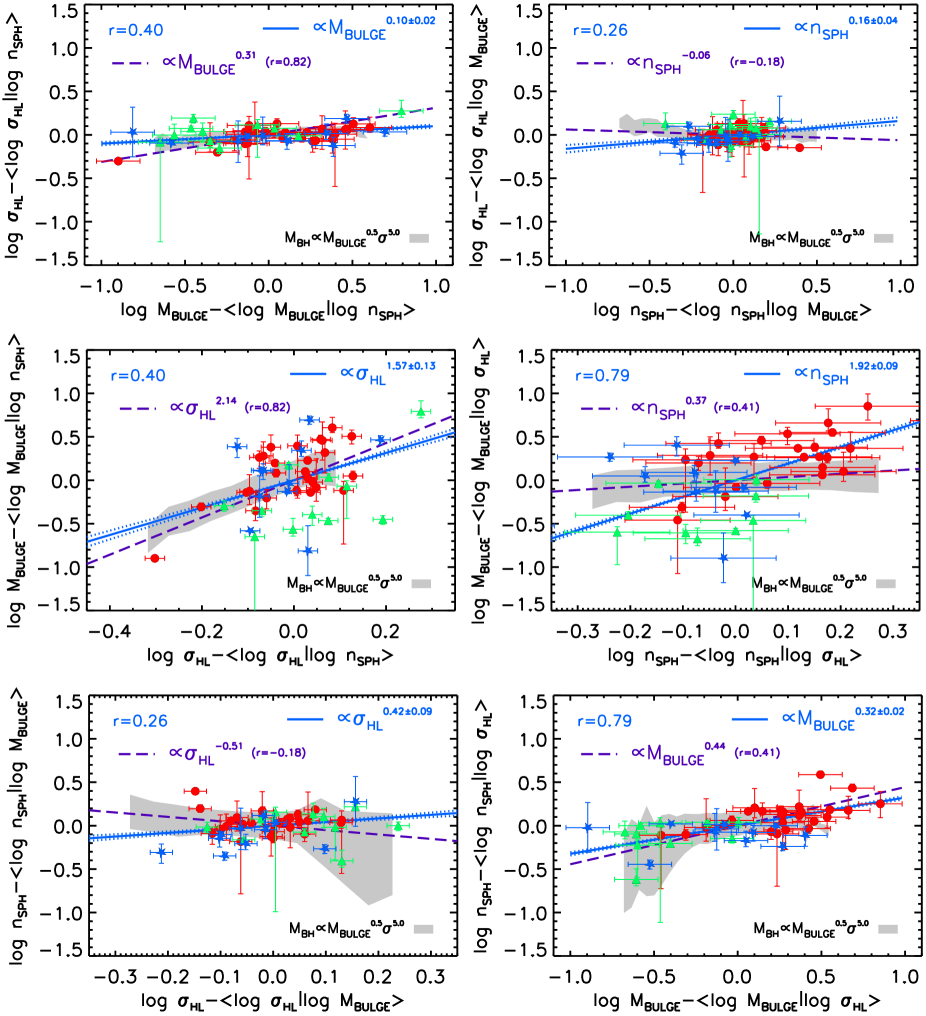
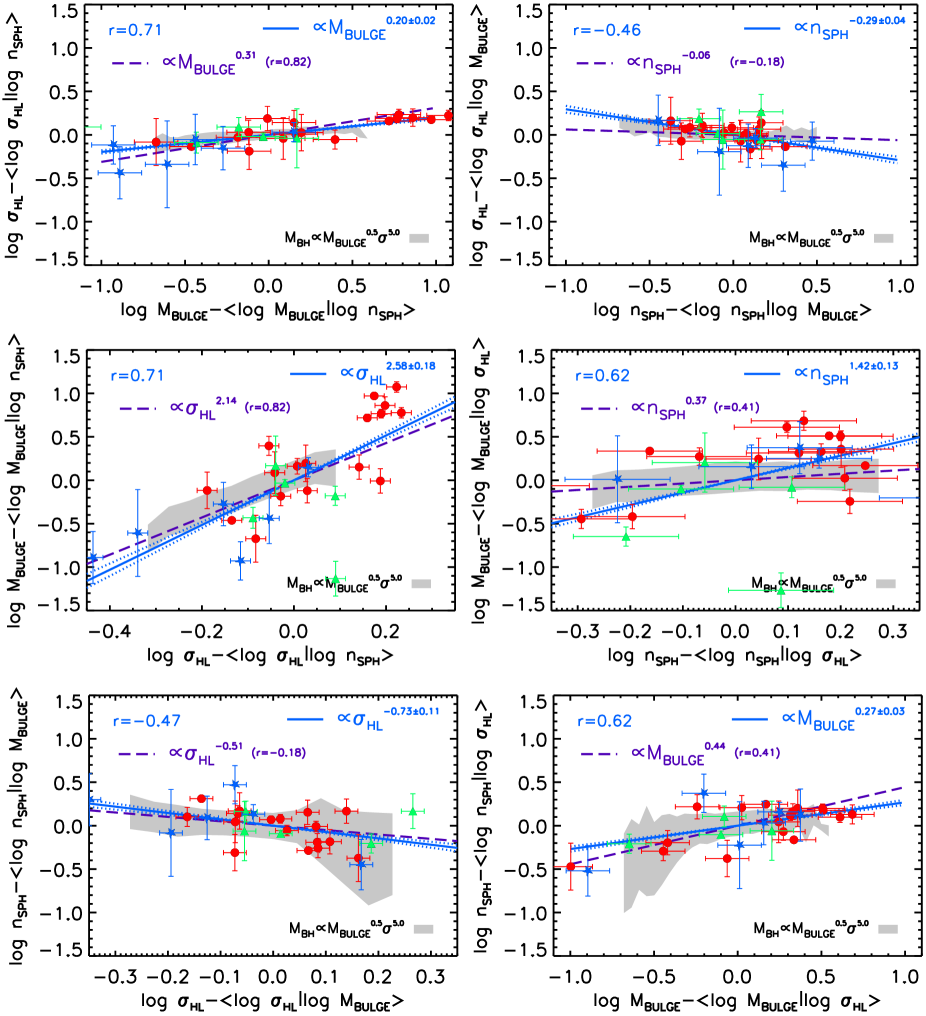
These final expressions, show how the slope of the relation depends on the black-hole parameters , and on the scaling relations between , and . The latter are reported in Figures 7 and 8 for the Savorgnan et al. (2016) and Läsker et al. (2014) samples, respectively. In each Figure the residual correlations of velocity dispersion (top panels), bulge stellar mass (middle panels), and Sérsic index (bottom panels) are plotted against the the other two variables. The gray band in each panel marks the results from the Monte Carlo simulations based on the Meert et al. (2013) SDSS sample inclusive of bias on the black hole gravitational sphere of influence.
Inserting from Table 1 in Equation 18, and the slopes of the SDSS residuals and from, respectively, the middle right and middle left panels of Figures 7 and 8, we would get , implying a significant correlation between black hole mass and Sérsic index, even though Equation 2 does not explicitly depend on Sérsic index. On the other hand, setting (Table 1), (upper right panels) and (upper left panels) in Equation 19 yields . This is weaker than the expected value of ; the discrepancy may be a consequence of the fact that is so close to zero.
Except for this, all of the other self-consistency conditions are satisfied in the mocks before we apply the sphere of influence selection. However, there is no guarantee that they will be satisfied in the selection-biased mocks or in the (selection-biased) data.
Nevertheless, the top panels of Figure 5 suggest in the selection biased sample. Using these values in Equation 18, along with the fact that (left panel of Figure 3) says that we expect . This is close to the we see in the left panel of Figure 4. Using Equation 19 instead means we should use the values in the bottom panels of Figure 5 along with (note that Figure 2 shows the inverse relation, ). This yields , which is somewhat lower than the slope of 1.8, perhaps again because the correlation with is so weak. Since these scalings are satisfied in the full mocks, we conclude that these differences are due to the selection bias.
If we use the values in the top panel of Figure 6 instead, we find , where we have used the fact that for this sample (right panel of Figure 3). This is close to the scaling of the direct relation shown in the right hand panel of Figure 4, despite the fact that this slope is very different from that in the left hand panel of Figure 4. We conclude that these very different scalings are indicating that systematics in the determination of prevent a definitive determination of some aspects of the -- relation. However, the main uncertainties are related to the fact that correlations with are not strong: our finding that the - correlation is stronger is very likely to be correct.
References
- Abazajian et al. (2009) Abazajian K. N. et al., 2009, ApJS, 182, 543
- Anglés-Alcázar et al. (2015) Anglés-Alcázar D., Özel F., Davé R., Katz N., Kollmeier J. A., Oppenheimer B. D., 2015, ApJ, 800, 127
- Beifiori et al. (2012) Beifiori A., Courteau S., Corsini E. M., Zhu Y., 2012, MNRAS, 419, 2497
- Bernardi et al. (2016) Bernardi M., Meert A., Sheth R. K., Fischer J.-L., Huertas-Company M., Maraston C., Shankar F., Vikram V., 2016, ArXiv:1604.01036
- Bernardi et al. (2013) Bernardi M., Meert A., Sheth R. K., Vikram V., Huertas-Company M., Mei S., Shankar F., 2013, MNRAS, 436, 697
- Bernardi et al. (2014) Bernardi M., Meert A., Vikram V., Huertas-Company M., Mei S., Shankar F., Sheth R. K., 2014, MNRAS, 443, 874
- Bernardi et al. (2011a) Bernardi M., Roche N., Shankar F., Sheth R. K., 2011a, MNRAS, 412, 684
- Bernardi et al. (2011b) Bernardi M., Roche N., Shankar F., Sheth R. K., 2011b, MNRAS, 412, L6
- Bernardi et al. (2010) Bernardi M., Shankar F., Hyde J. B., Mei S., Marulli F., Sheth R. K., 2010, MNRAS, 404, 2087
- Bernardi et al. (2003) Bernardi M. et al., 2003, AJ, 125, 1817
- Bernardi et al. (2007) Bernardi M., Sheth R. K., Tundo E., Hyde J. B., 2007, ApJ, 660, 267
- Bluck et al. (2016) Bluck A. F. L. et al., 2016, MNRAS, 462, 2559
- Bournaud et al. (2011a) Bournaud F. et al., 2011a, ApJ, 730, 4
- Bournaud et al. (2011b) Bournaud F., Dekel A., Teyssier R., Cacciato M., Daddi E., Juneau S., Shankar F., 2011b, ApJ, 741, L33
- Cappellari et al. (2006) Cappellari M. et al., 2006, MNRAS, 366, 1126
- Cappellari et al. (2013) Cappellari M. et al., 2013, MNRAS, 432, 1862
- Chabrier (2003) Chabrier G., 2003, PASP, 115, 763
- Dekel & Burkert (2014) Dekel A., Burkert A., 2014, MNRAS, 438, 1870
- Ferrarese (2002) Ferrarese L., 2002, in Current High-Energy Emission Around Black Holes, Lee C.-H., Chang H.-Y., eds., pp. 3–24
- Ferrarese & Ford (2005) Ferrarese L., Ford H., 2005, Space Science Reviews, 116, 523
- Ferrarese & Merritt (2000) Ferrarese L., Merritt D., 2000, ApJ, 539, L9
- Forbes et al. (2008) Forbes D. A., Lasky P., Graham A. W., Spitler L., 2008, MNRAS, 389, 1924
- Gebhardt & et al. (2000) Gebhardt K., et al., 2000, ApJ, 539, L13
- Graham (2016) Graham A. W., 2016, Galactic Bulges, 418, 263
- Graham et al. (1998) Graham A. W., Colless M. M., Busarello G., Zaggia S., Longo G., 1998, A&AS, 133, 325
- Graham & Driver (2007) Graham A. W., Driver S. P., 2007, ApJ, 655, 77
- Graham et al. (2007) Graham A. W., Driver S. P., Allen P. D., Liske J., 2007, MNRAS, 378, 198
- Graham et al. (2001) Graham A. W., Erwin P., Caon N., Trujillo I., 2001, ApJ, 563, L11
- Graham & Scott (2013) Graham A. W., Scott N., 2013, ApJ, 764, 151
- Hilz et al. (2013) Hilz M., Naab T., Ostriker J. P., 2013, MNRAS, 429, 2924
- Ho & Kim (2014) Ho L. C., Kim M., 2014, ApJ, 789, 17
- Huertas-Company et al. (2011) Huertas-Company M., Aguerri J. A. L., Bernardi M., Mei S., Sánchez Almeida J., 2011, A&A, 525, A157
- Jahnke & Macciò (2011) Jahnke K., Macciò A. V., 2011, ApJ, 734, 92
- Jorgensen et al. (1996) Jorgensen I., Franx M., Kjaergaard P., 1996, MNRAS, 280, 167
- Kormendy & Ho (2013) Kormendy J., Ho L. C., 2013, ARA&A, 51, 511
- Läsker et al. (2014) Läsker R., Ferrarese L., van de Ven G., Shankar F., 2014, ApJ, 780, 70
- Lauer et al. (2007) Lauer T. R. et al., 2007, ApJ, 662, 808
- Marconi & Hunt (2003) Marconi A., Hunt L. K., 2003, ApJ, 589, L21
- Martig et al. (2009) Martig M., Bournaud F., Teyssier R., Dekel A., 2009, ApJ, 707, 250
- Meert et al. (2013) Meert A., Vikram V., Bernardi M., 2013, MNRAS, 433, 1344
- Meert et al. (2015) Meert A., Vikram V., Bernardi M., 2015, MNRAS, 446, 3943
- Meidt et al. (2014) Meidt S. E. et al., 2014, ApJ, 788, 144
- Mutlu Pakdil et al. (2016) Mutlu Pakdil B., Seigar M. S., Davis B. L., 2016, ArXiv e-prints
- Nipoti (2015) Nipoti C., 2015, ApJ, 805, L16
- Paturel et al. (2003) Paturel G., Petit C., Prugniel P., Theureau G., Rousseau J., Brouty M., Dubois P., Cambrésy L., 2003, A&A, 412, 45
- Prugniel & Simien (1997) Prugniel P., Simien F., 1997, A&A, 321, 111
- Reines & Volonteri (2015) Reines A. E., Volonteri M., 2015, ApJ, 813, 82
- Saglia et al. (2016) Saglia R. P. et al., 2016, ApJ, 818, 47
- Sani et al. (2011) Sani E., Marconi A., Hunt L. K., Risaliti G., 2011, MNRAS, 413, 1479
- Savorgnan (2016) Savorgnan G. A. D., 2016, ApJ, 821, 88
- Savorgnan et al. (2016) Savorgnan G. A. D., Graham A. W., Marconi A., Sani E., 2016, ApJ, 817, 21
- Shankar (2009) Shankar F., 2009, New Astron. Rev., 53, 57
- Shankar & Bernardi (2009) Shankar F., Bernardi M., 2009, MNRAS, 396, L76
- Shankar et al. (2016) Shankar F. et al., 2016, MNRAS, 460, 3119
- Sheth & Bernardi (2012) Sheth R. K., Bernardi M., 2012, MNRAS, 422, 1825
- Silk et al. (2013) Silk J., Di Cintio A., Dvorkin I., 2013, ArXiv e-prints
- Silk & Rees (1998) Silk J., Rees M. J., 1998, A&A, 331, L1
- Tremaine et al. (2002) Tremaine S. et al., 2002, ApJ, 574, 740
- van den Bosch (2016) van den Bosch R., 2016, ArXiv:1606.01246
- van den Bosch et al. (2015) van den Bosch R. C. E., Gebhardt K., Gültekin K., Yıldırım A., Walsh J. L., 2015, ApJS, 218, 10
- Vittorini et al. (2005) Vittorini V., Shankar F., Cavaliere A., 2005, MNRAS, 363, 1376