A time dependent approach to model X-ray and –ray light curves of Mrk 421 observed during the flare in February 2010
Abstract
Strong X-ray and –ray flares have been detected in February 2010 from the high synchrotron peaked blazar Mrk 421 (z=0.031). With the motivation of understanding the physics involved in this flaring activity, we study the variability of the source in X-ray and –ray energy bands during the period February 10-23, 2010 (MJD 55237-55250). We use near simultaneous X-ray data collected by MAXI, Swift-XRT and –ray data collected by Fermi-LAT and TACTIC along with the optical V-band observations by SPOL at Steward Observatory. We observe that the variation in the one day averaged flux from the source during the flare is characterized by fast rise and slow decay. Besides, the TeV –ray flux shows a strong correlation with the X-ray flux, suggesting the former to be an outcome of synchrotron self Compton emission process. To model the observed X-ray and –ray light curves, we numerically solve the kinetic equation describing the evolution of particle distribution in the emission region. The injection of particle distribution into the emission region, from the putative acceleration region, is assumed to be a time dependent power law. The synchrotron and synchrotron self Compton emission from the evolving particle distribution in the emission region are used to reproduce the X-ray and –ray flares successfully. Our study suggests that the flaring activity of Mrk 421 can be an outcome of an efficient acceleration process associated with the increase in underlying non-thermal particle distribution.
keywords:
BL Lacertae objects:individual:Mrk 421-methods:data analysis-radiation mechanisms: non-thermal1 Introduction
Blazars belong to the extreme class of radio-loud active galactic nuclei (AGN) hosting a relativistic jet which is pointed close to the line of sight from the Earth. The blazar emission originating from the jet is observed to be highly variable over all accessible energy bands. The radiation from blazars is dominated by non-thermal emission that spans over the entire electromagnetic spectrum from radio to very high energy (VHE, E100 GeV) –rays. The multi-wavelength radiation observed from blazars is best understood in a paradigm where the emission results from the magnetized plasma ejected with relativistic speeds in a collimated outflow powered by a super massive black hole. The spectral energy distribution (SED) of blazars is characterized by two distinct and broad peaks located in the UV/optical/X-ray and in high energy (HE, E100 MeV) –ray regimes respectively. The low energy component is believed to be originated due to synchrotron radiation from a population of relativistic electrons losing energy in the jet magnetic field. However, the origin of second component peaking in HE –ray regime, is poorly understood and is still under debate. In leptonic models, this emission originates from the inverse Compton (IC) scattering of ambient photons by the same electrons that emit the synchrotron radiation [1, 2]. The ambient photon field can be synchrotron radiation in the emission region or the photons external to the jet. In synchrotron self Compton (SSC) model, only local synchrotron photons serve as seed photons for IC scattering [1, 3]; whereas, in external Compton (EC) models, the target photon fields can be direct accretion disk field [4], the line emission from the broad line emitting region and IR radiation from dusty torus [5]. On the other hand, in hadronic models, hadronic processes such as proton synchrotron and radiation produced by secondary particles are suggested to explain the emission of HE and VHE –ray radiation from blazars [6, 7].
Although, the broad band spectral properties are nearly similar in all blazars, they are further classified into two main subclasses namely BL Lacertae objects (BL Lacs) and flat spectrum radio quasars (FSRQs), on the basis of their optical line features [8]. FSRQs display strong, broad optical absorption/emission lines while BL Lacs are characterized by featureless continuum showing weak/no emission/absorption lines. According to the blazar simplified view, BL Lacs and FSRQs are explained as low excitation radio galaxies (Fanaroff-Riley I) and high excitation (Fanaroff-Riley II) radio galaxies with their jets forming a small angle with respect to the line of sight [8, 9]. This scenario is consistent with the complex observational properties of blazars from the surveys carried out so far in the radio and X-ray energy bands. Besides this, the characteristic peak frequencies of synchrotron and IC components of blazar SED are anti-correlated with respect to bolometric luminosity [10, 11], leading to further classification of blazars. Based on the peak frequency () of the synchrotron component, blazars are divided into three classes: low-synchrotron peaked (LSP: Hz), intermediate-synchrotron peaked (ISP: Hz) and high-synchrotron peaked (HSP: Hz) blazars [12]. Almost all FSRQs detected so far belong to the LSP class of blazars whereas BL Lacs include LSP, ISP and HSP blazars. The ratio of peak frequencies of X-ray and –ray components gives an idea about the characteristic cooling energy of relativistic particles in the jet plasma under the assumption that the emission region is homogeneous in these energy regimes. Recent multi-wavelength observations of 42 radio-loud narrow-line Seyfert 1 (RLNLS1) galaxies have revealed similarities between blazars and these peculiar systems [13]. Detection of –ray emission from RLNLS1 galaxies have strong implications for the presence of blazar-like jets in these objects [14]. The main differences between blazars and RLNLS1s are in the masses of central engines and accretion rates. The blazars generally have larger masses and lower accretion rates whereas –ray emitting RLNLS1s have small masses and high accretion rates [15]. Although RLNLS1s display some peculiar differences with respect to blazars, the physical properties inferred from observations indicate that these sources are low mass tail of blazars. Therefore, blazars and RLNLS1s can be considered as similar objects and the differences in their observed SEDs are attributed to thier masses and accretion rates under the assumption that relativistic jets are formed independently of the host galaxies [14].
The multi-wavelength emission from blazars is also characterized by rapid variability on various time scales ranging from few minutes to years. Based on these time scales, the variability of blazars is classified in three groups namely intra day, short time and long time. The intra day variability (IDV) implies time scales from few tens of minutes to less than a day [16] and it is also known as micro or intra night variability. The short time variability (STV) is characterized by time scales from several days to few months whereas long time variability (LTV) covers changes from several months to many years [17]. The shortest variability time scales from blazar light curves can be used to constrain the size of the emission region through light travel time effects, which inturn probes the location of the emission zone in the self-similar jets.
Mrk 421 (z=0.031, 134 Mpc), an HSP type BL Lac object, was first detected at energies above 100 MeV by EGRET telescope on the Compton Observatory [18]. The source is also the first extragalactic object observed by ground based imaging atmospheric Cherenkov telescope (IACT) at energies in the VHE regime [19]. Mrk 421 has been observed to be a very active blazar with major outbursts about once every year in both X-ray and –ray energy bands with variability time scales from minutes to several days [20, 21]. In February 2010, this source was detected in a state of high activity reaching its maximum around February 16, 2010. During this outburst, the source was the target of a multi-wavelength campaign involving X-ray satellites, –ray satellites, ground based VHE instruments, optical and radio telescopes. Near simultaneous multi-wavelength data from radio to TeV –rays collected during the campaign have been used to perform an extensive study of the source during this flaring activity [22, 23]. X-ray and HE –ray observations of the same flare with Swift and Fermi satellites have also been studied separately [24]. Two X-ray flares from Mrk 421 detected around the same period with MAXI satellite during January and February 2010 are also reported [25, 26]. The VHE observations of the source during this flare have also been reported by various IACT groups like VERITAS [27], HESS [28] and TACTIC [23]. Long term VHE observations of the source during 2009–10 with TACTIC have also been reported [29].
Recently, Zheng et al.(2014) have studied the February 2010 outburst of Mrk 421 considering stochastic acceleration of electrons under strong magnetic turbulences [30]. They studied the flare assuming different indices of the turbulent spectrum and conclude that the observed properties of the flare favour the turbulent index to be 2 (hard sphere approximation). Yan et al.(2013) have investigated the electron energy distribution and acceleration processes in the jet of Mrk 421 through SED fitting in different active states under the framework of one zone SSC model [31]. They assume two electron energy distributions formed via different acceleration processes: the shock accelerated power law with exponential cut-off and the stochastic turbulence accelerated log-parabolic distributions to model the SED of the source. Their results indicate that both the electron energy distributions give good fits for the SED in low state, but log-parabolic distribution gives better fits for the SED in high or flaring state and the VHE variability can be accomodated only in log-parabolic model. The X-ray and TeV variability of Mrk 421 flare observed during March 2001 have been investigated by [32] in leptohadronic single zone model. They find that –ray emission can be attributed to the synchrotron radiation either from protons or from secondary leptons produced via photohadronic processes. These possibilities also imply differences in the variability signatures in X-ray and –ray regime. Chen et al. (2011) have reported a time dependent simulation of multi-wavelength variability of Mrk 421 with a Monte Carlo multizone radiative transfer code [33]. The variability in this code is introduced by the injection of relativistic electrons as a shock front crosses the emission region. The emission is considered to originate from two components: a flaring or active and a quasi-steady state. The later one is completely independent of the former component.
In the present work, we use well sampled X-ray and –ray daily light curves to investigate the temporal properties of Mrk 421 during the flare in February 2010. We show that a time dependent power law injection of electrons in the emission region can be used to understand the outburst of the source in different energy bands within the framework of SSC model. The paper is organized as follows: Section 2 presents the details of Optical, X-ray and –ray data used in this study. In Section 3, we perform the temporal and correlation study of the daily light curves. Modelling of X-ray and –ray light curves using time dependent injection of particles is described in Section 4. In Section 5, we discuss and conclude our results. CDM cosmology with , and is adapted in the present work.
2 Multi-wavelength Data Set
In February 2010, Mrk 421 went into a state of high activity with maximum flux detected around February 16, 2010 (MJD 55243) in X-ray and –ray energy bands. Many instruments world wide have detected this outburst. The near simultaneous multi-wavelength observations during the period February 10-23, 2010 (MJD 55237-55250) have been used in the present study. We have obtained the V-band optical data from the SPOL observations at Steward Observatory, University of Arizona111http://james.as.arizona.edu/ psmith/Fermi/ under Fermi multi-wavelength blazar observing support program. The soft X-ray data in the energy range 0.3-10 keV from X-ray Telescope (XRT) onboard the Swift satellite [34] have been processed with the XRTDAS software package (v.3.0.0) available within HEASOFT package (6.16). We have used standard procedures (xrtpipeline v.0.13.0) for cleaning and calibration of event files with data taken in Window Timing (WT) mode. The spectra are grouped using grppha v.3.0.1 to ensure a minimum of 30 counts in each bin. The daily light curves in the energy range 0.3-10keV are obtained using xrtproducts v.0.4.2. The archival X-ray data in the energy range 10-20 keV during the same period from Monitor of All sky X-ray Image (MAXI) satellite [35] have also been used in this study. We have obtained the daily light curve from MAXI available online from its website222http://maxi.riken.jp/top/index.php.
The –ray observations in HE and VHE bands have been used from Fermi-Large Area Telescope (LAT) [36] and TeV Atmospheric Cherenkov Telescope with Imaging Camera (TACTIC) [39] observations of Mrk 421 during February 10-23, 2010 respectively. The HE measurements from Fermi-LAT over the energy range 0.1-100 GeV are obtained by analysing the data using standard Fermi-ScienceTools. The details of data analysis procedure for generating the daily light curve in HE band with Fermi-LAT are discussed in our earlier work [23]. The one day averaged VHE light curve in the energy range 1.1-12 TeV is obtained from TACTIC observations of the source during the above mentioned period. The procedure for analysis of TACTIC data used in this work has been described in detail in [23, 29]. The VHE flux points have been corrected for extragalactic background light (EBL) absoprtion of TeV photons using the model proposed by [40]. The intrinsic VHE light curve obtained with TACTIC indicates a strong flaring activity on February 16, 2010 (MJD 55243) which is also observed in X-ray and HE –ray bands.
3 Temporal Study
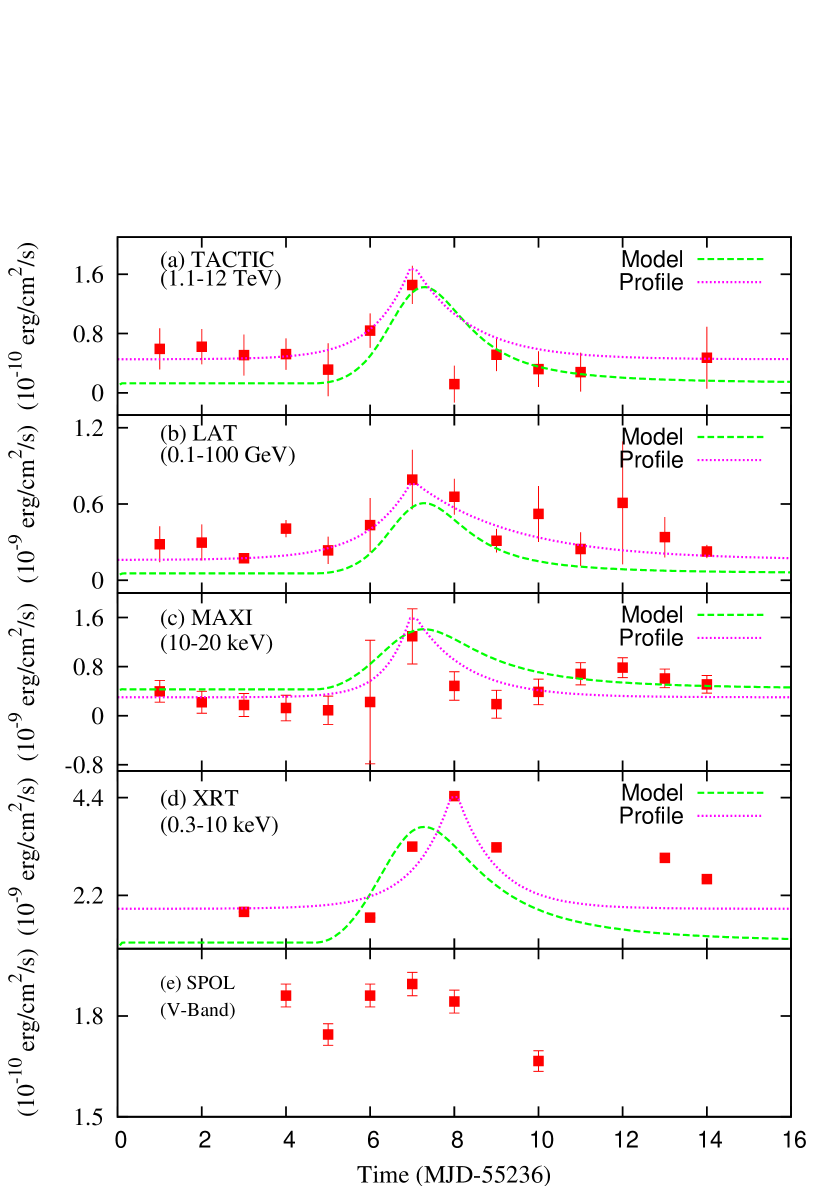
The resulting –ray, X-ray and Optical daily averaged light curves observed by different instruments during February 10-23, 2010 (MJD 55237-55250) are shown in Figure 1(a-e). A significant enhancement of the flux in all energy bands is observed on February 16, 2010 (MJD 55243). To study the nature of this flare in detail, we fit the light curves with an exponential profile defined by
| (1) |
where and are the rise and decay timescales respectively, is the time of maximum flux, and are the constants for determining the quiescent and peak fluxes respectively, and is the Heaviside function. The fitting is performed in X-ray and –ray energy bands over the parameters , , and , whereas is fixed at 55243 MJD. The best fit values of these parameters for different energy bands are presented in Table 1.
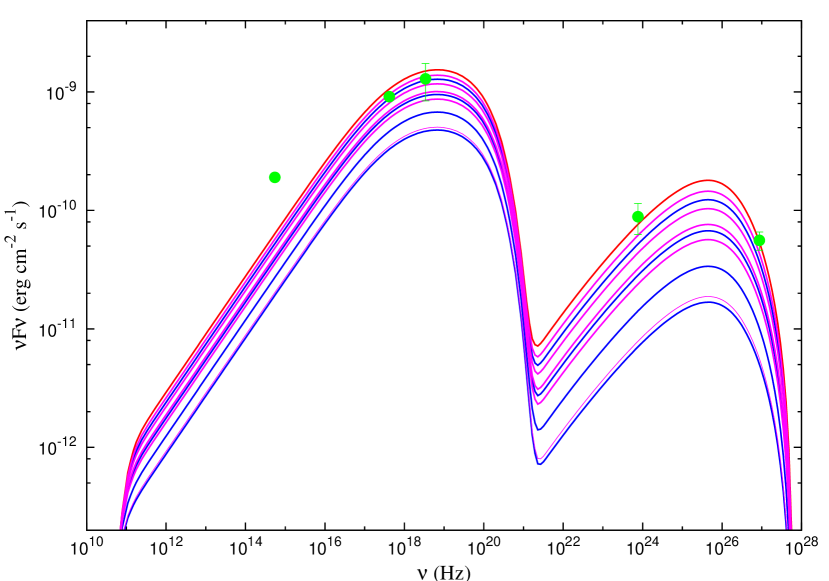
The peak flux point observed with Swift-XRT appears delayed by about one day with respect to MAXI, LAT and TACTIC bservations. It is important to note here that the XRT data is of very short duration (less than an hour) while the data from other instruments are averaged over a day. Also TACTIC observations show a sharp drop just after the flare, which is not observed in other energy bands. Almost similar rise times in all the light curves suggest that the physical process involved in the flare is energy independent. Likewise, almost similar decay times in all energy bands do not favour the flare decay due to radiative loss mechanism [41]. The fitted light curves for four energy bands are shown in Figure 1(a-d) as dotted (magenta) lines. It is quite evident from the Figure 1(a-d) that the flare is asymmetric with fast rise and slow decay. We observe that the optical light curve with a high flux point on February 13, 2010 (MJD 55240) is different from the light curves in other energy bands. In addition, the features in optical light curve are not coincident with those in X-ray and –ray light curves because the optical emission appears to be in high state even before the beginning of the flare. These differences suggest that the optical emission may not be associated with the region responsible for emission in higher energy bands [37, 38]. This claim is further strengthened by the spectral behaviour of the broadband SED during flare maximum (Figure 2) where, the synchrotron spectral component significantly underpredicts the observed optical flux. Due to these reasons, we have not included optical emission in our present study.
.
| Energy | A0 | A | (dof) | ||
|---|---|---|---|---|---|
| (erg cm-2 s-1) | (erg cm-2 s-1) | (days) | (days) | ||
| 1.1-12 TeV | (4.531.52) | (1.300.32) | (0.860.38) | (1.320.48) | 1.46(8) |
| 0.1-100 GeV | (1.610.39) | (6.282.21) | (1.040.80) | (2.371.32) | 1.58(10) |
| 10-20 keV | (3.120.94) | (1.400.57) | (0.600.31) | (1.220.42) | 1.82(10) |
| 0.3-10 keV | (1.900.25) | (2.741.34) | (0.870.72) | (0.940.85) | 5.64(3) |
4 Physical Modeling of Light curves
To obtain the physical parameters governing the broadband emission from the jet of Mrk 421, we assume the emission to arise from a spherical region of radius moving down the jet with Lorentz factor at viewing angle with respect to the line of sight of the observer. The low energy emission from radio to X–rays is interpreted as synchrotron radiation from a power law distribution of non-thermal particles, , losing their energy () in a tangled magnetic field and the high energy emission in –rays is attributed to the SSC scattering process [42]. The observed light curves of Mrk 421 during flaring activity are modelled using the evolution of spectrum from the emission region. The evolution of particle distribution in the emission region can be described by the kinetic equation
| (2) |
where is the energy loss rate and is the particle injection rate from an associated acceleration region. We consider the energy loss rate to be dominated by the synchrotron and inverse Compton emission processes and for the latter we use the exact Klein Nishina cross section [43, 44]. The injection spectrum from the acceleration region is assumed to be a time dependent power law of the form
| (3) |
with a time dependent normalization given by
| (4) |
where is the normalization in quiescent state and is the time when flare attains the peak with as the corresponding normalization, and and decide the rise and decay time scales of the particle injection. The time dependence in the particle injection will result in the inverse Compton target photon density to vary with time and this will lead to time dependent energy loss rate, preventing equation 2 to be solved analytically. Hence, we solve equation 2 numerically using finite difference method [45, 46, 47]. The emission due to synchrotron and SSC processes are obtained by convoluting the single particle emissivity with the evolving particle distribution from the emission region. Finally, the flux received by the observer at frequency at time is transformed considering the relativistic Doppler boosting and cosmological effects [48]
| (5) |
Here is the luminosity distance, is the comoving volume of emission region and is the emissivity of source at frequency at time due to different radiative processes.
We apply this time dependent model on the X-ray and –ray light curves of Mrk 421 observed during its flare on February 16, 2010 (MJD 55243). The energy integrated photon flux obtained from the time dependent particle spectrum is used to reproduce the light curves in four energy bands : 0.3-10 keV, 10-20 keV, 0.1-100 GeV and 1.1-12 TeV. The parameters of the model are further optimized through the multi-wavelength spectral fitting of time averaged SED observed during the flare of the source. The evolution of SED of the source during the flare is shown in Figure 2. The escape time scale is considered to be . The particle injection into the emission region is initiated on MJD 55240 and the time of maximum particle flux injection, is fixed at MJD 55243. We find that increasing the electron injection three times compared to the quiescent level can reproduce the X-ray and –ray light curves satisfactorily. The model light curves in four energy bands (lines with larger dots) along with the observed daily flux points are shown in Figure 1. The source parameters describing the model light curves are summarized in Table 2 and are consistent with the values obtained from the SED modeling [23, 49].
| Parameters | Value |
|---|---|
| R (cm) | 8.0 |
| 18 | |
| p | 2.02 |
| B (G) | 0.60 |
| 12 | |
| 3 | |
| 3.0 | |
| 1.0 | |
| 2.1 | |
| 3.2 |
In addition to the modeling of light curves, we also perform a correlation study between –ray and X-ray energy bands for the emission of the source, since this would provide useful information regarding the processes responsible for the flaring activity. To investigate the possible correlation, we follow the similar procedure as proposed by Katarzyński et al. 2010 [50]. We find that the correlation between the evolution of emissions in the two different energy regimes during the flare of Mrk 421 can be described by a simple power law of the form
| (6) |
where is the index of correlation for the near simultaneous flux measurements and in two independent energy bands. The values of index of correlation for comparision of observations with different instruments are given in Table 3. This suggests strong correlation of the TeV –ray flux with respect to X–ray flux observed with MAXI, which can be understood within the frame work of SSC model. If the flaring activity is predominantly attributed to the variation in non-thermal particle density, the SSC flux (–ray) will vary quadratically with respect to the synchrotron flux (X-ray) due to the second order dependence of the former with the particle density [50]. A linear correlation may be an artifact of the decay of the flare when the emitting region expands and it leads to a decrease in electron density and magnetic field strength.
| Instruments | |
|---|---|
| TACTIC-MAXI | 1.230.72 |
| LAT-MAXI | 0.650.25 |
5 Discussion and Conclusions
In this work, we have performed a detailed temporal study of X-ray and –ray observations on Mrk 421 during the flare in February 2010 to understand the flaring behaviour of the source. We determine the rise and decay characteristic timescales in the daily light curves of the source in four energy bands: 0.3-10 keV, 10-20 keV, 0.1-100 GeV and 1.1-12 TeV. The flux points in light curves before and after the flare are fitted with exponential rise and decay profiles respectively. We obtain almost similar rise time in all the energy bands and this indicates an energy independent physical process operating in the source during the flaring activity. Also, similar characteristic decay times in different energy bands do not support the radiative loss processes involved in the decay of the flare. Based on these studies, we interpret the flare to be a result of enhanced relativistic particle distribution by a putative acceleration process and the emission in the –ray energy regime to be dominated by SSC process. In addition, a strong correlation observed between X-ray and TeV fluxes during the flare supports SSC interpretation of VHE emission.
To further understand the behaviour of the source during the flare, the X-ray and –ray light curves are reproduced using a time dependent model. The evolution of particle distribution in the cooling region is obtained by solving the relevant kinetic equation considering synchrotron and SSC emission processes. The evolution of radiation flux can reproduce the observed daily light curves in X–rays and –rays satisfactorily. The reproduction is better for the –ray light curves than the X-ray ones though the uncertainties in the former are relatively large. The variability in optical V-band is not significant as compared to X-ray and –ray bands and small variations in the flux level may be due to contamination from the host galaxy. We correct the optical data for starlight contribution from the host galaxy using the methodology described in [51]. The effect of contamination from host galaxy of Mrk 421 on V-magnitude in our present study is obtained to be negligible. The optical emission during the flare is probably not related to that in X-ray and –ray energy bands and it is consistent with the results from previous studies of Mrk 421 [37, 38]. In our simplistic model, we attribute the entire flare to the varying particle injection into the emission region. However, this may not be strictly true in a realistic scenario where the flare can be associated with variation in other parameters as well, for example magnetic field, bulk Lorentz factor etc. Reproduction of the light curves can be improved by evolving other parameters along with the particle density. Nonetheless, this will lead to the increased number of parameters and a reasonable conclusion on the physical condition responsible for the flare cannot be derived. Again, we have not considered the light travel time effects [52, 53, 54, 55] since the flare time scale at the source frame () is larger than the light travel time. For instance considering a flare time scale () of 1 day in observer frame, the corresponding time in source frame will be 18 days; whereas the light travel time will be 3 days. Hence, this effect will not be significant in our simple phenomenological model.
Acknowledgment
We are grateful to the anonymous referee for his/her valuable suggestions and comments. We would like to acknowledge the use of TACTIC data and the excellent team work of colleagues in Astrophysical Sciences Division for their contribution to the simulation, observation, data analysis and instrumentation aspects of TACTIC gamma-ray telescope. We acknowledge the use of public data obtained through Fermi Science Support Center (FSSC) provided by NASA. This work made use of data supplied by the UK Swift Science Data Centre at the University of Leicester. This research has made use of the MAXI data, provided by RIKEN, JAXA and the MAXI team. Data from the Steward Observatory spectropolarimetric monitoring project were used. This program is supported by Fermi Guest Investigator grants NNX08AW56G, NNX09AU10G, NNX12AO93G, and NNX15AU81G.
References
- [1] L. Maraschi et al., 1992, ApJ, 397, L5
- [2] M. Böttcher, 2007, ApSS, 309, 95
- [3] F. Tavecchio et al., 1998, ApJ, 509, 608
- [4] C. D. Dermer and R. Schlickeiser, 1993, ApJ, 416, 458
- [5] M. Sikora et al., 1994, ApJ, 421, 153
- [6] K. Mannheim, 1993, A&A, 269, 67
- [7] A. Mücke et al., 2003, APh, 18, 593
- [8] C. M. Urry and P. Padovani, 1995, PASP, 107, 803
- [9] P. Giommi et al., 2012, MNRAS, 420, 2899
- [10] G. Fossati et al., 1998, MNRAS, 299, 433
- [11] G. Ghisellini, 2016, arXiv:1609.08606
- [12] A. A. Abdo et al., 2010, ApJ, 716, 30
- [13] L. Foschini et al., 2015, A&A, 575, 13
- [14] A. A. Abdo et al., 2009, ApJ, 707, L142
- [15] W. Yuan et al., 2008, ApJ, 685, 801
- [16] S. J. Wagner, and A. Witzel, 1995, ARA&A, 33, 163
- [17] A. C. Gupta et al., 2004, A&A, 422, 505
- [18] Y. C. Lin et al., 1992, ApJL, 401, L61
- [19] M. Punch et al., 1992, Nature, 358, 477
- [20] W. Cui, 2004, ApJ, 605, 662
- [21] M. Tluczykont et al., 2010, A&A, 524, 48
- [22] A. Shukla et al., 2012, A&A, 541, 140
- [23] K. K. Singh et al., 2015, APh, 61, 32
- [24] K. K. Singh et al., 2012, New Astro., 17, 679
- [25] N. Isobe et al., 2010, PASJ, 62, L55
- [26] H. Gaur et al., 2012, AJ, 143, 23
- [27] L. Fortson et al., 2012, AIPCS, 1505, 514
- [28] M. Tluczykont, 2011, arXiv:1106.1035
- [29] P. Chandra et al., 2012, J. Phys. G, 39, 045201
- [30] Y. G. Zheng et al., 2014, MNRAS, 442, 3166
- [31] D. Yan et al., 2014, ApJ, 765, 122
- [32] A. Mastichiadis et al., 2013, MNRAS, 434, 2684
- [33] X. Chen et al., 2011, MNRAS, 416, 2368
- [34] D. N. Burrows et al., 2005, Space Sci. Rev., 120, 165
- [35] M. Matsuoka et al., 2009, PASJ, 61, 999
- [36] W. B. Atwood et al., 2009, ApJ, 697, 1071
- [37] J. Aleksić et al., 2015, A&A, 578, A22
- [38] A. Sinha et al., 2013, A&A, 580, A100
- [39] R. Koul et al., 2007, NIM A, 578, 548
- [40] A. Franceschini et al., 2008, A&A, 487, 837
- [41] M. Böttcher, and D. Principe, 2009, ApJ, 692, 1374
- [42] S. Sahayanathan, and S. Godambe, 2012, MNRAS, 419, 1660
- [43] G. B. Rybicki, and A. P. Lightman, 1986, Radiative Processes in Astrophysics
- [44] G. R. Blumenthal, and R. J. Gould, 1970, Rev. Mod. Phys., 42, 237
- [45] M. Chiaberge, and G. Ghisellini, 1999, 306, 551
- [46] J. S. Chang and G. Cooper, 1970, J. Comp. Phys., 6, 1
- [47] W. H. Press et al., 2002, Numerical recipes in C++ : the art of scientific computing
- [48] M. C. Begelman et al., 1984, Rev. Mod. Phys., 56, 255
- [49] V. A. Acciari et al., 2011, ApJ, 738, 25
- [50] K. Katarzyński, and K. Walczewska, 2010, A&A, 510, 63
- [51] K. Nilsson et al., 2007, A&A, 475, 199
- [52] B. Eichmann et al., 2010, A&A, 511, 26
- [53] B. Eichmann et al., 2012, ApJ, 744, 153
- [54] M. Zacharias, and R. Schlickeiser, 2013, ApJ, 777, 109
- [55] M. Zacharias, 2014, MNRAS, 443, 3001