Extremely Red Submillimeter Galaxies: New –6 Candidates Discovered using ALMA and Jansky VLA
Abstract
We present the detailed characterization of two extremely red submillimeter galaxies (SMGs), ASXDF1100.053.1 and 231.1, with the Atacama Large Millimeter/submillimeter Array (ALMA) and the Jansky Very Large Array (VLA). These SMGs were selected originally using AzTEC at 1100 m, and are observed by Herschel to be faint at 100–500 m. Their (sub)millimeter colors are as red as – or redder – than known SMGs; indeed, ASXDF1100.053.1 is redder than HFLS 3, which lies at . They are also faint and red in the near-/mid-infrared: Jy at IRAC 4.5 m and Jy in the filter. These SMGs are also faint in the radio waveband, where Jy for ASXDF1100.053.1 and Jy for ASXDF1100.231.1, suggestive of and for ASXDF1100.053.1 and 231.1, respectively. ASXDF1100.231.1 has a flux excess in the 3.6-m filter, probably due to H emission at –5. Derived properties of ASXDF1100.053.1 for –7.5 and 231.1 for –5.5 are as follows: their infrared luminosities are and ; their stellar masses are and ; their circularized half-light radii in the ALMA maps are and kpc (2–3 kpc for 90% of the total flux). Lastly, their surface infrared luminosity densities, , are and kpc-2, similar to values seen for local (U)LIRGs. These data suggest that ASXDF1100.053.1 and 231.1 are compact SMGs at and can plausibly evolve into compact quiescent galaxies.
Subject headings:
submillimeter: galaxies — galaxies: evolution — galaxies: formation — galaxies: high-redshift1. Introduction
Submillimeter (submm) galaxies (SMGs) with infrared (IR, rest-frame 8–1000 m) luminosities, L⊙, are routinely detected in deep continuum images at –1300 m using ground-based single-dish telescopes. Even out to , there is no significant loss of sensitivity to these SMGs, given the strong negative -correction in the Rayleigh-Jeans tail of their dust spectral energy distributions (SEDs) (e.g. Blain et al., 2002).
Despite 20 years of deep submm surveys since Smail et al. (1997), our knowledge of the upper half of the redshift distribution of SMGs remains incomplete. Early attempts to determine redshifts were conducted towards SMGs with radio counterparts, because low-resolution (sub)mm images obtained with single dishes require high-resolution radio continuum maps from radio interferometers such as the Jansky Very Large Array (VLA) in order to pinpoint source positions (Ivison et al., 1998, 2000, 2002, 2005, 2007; Smail et al., 1999; Borys et al., 2004; Pope et al., 2006; Aretxaga et al., 2011; Biggs et al., 2011; Yun et al., 2012). Intensive studies of radio-bright SMGs were able to yield spectroscopic redshifts for those out to (e.g. Chapman et al., 2003, 2005). However, at that time radio sensitivities could not detect SMGs beyond , and as many as half of SMGs lacked reliable radio counterparts (see e.g. Ivison et al. 2007; Biggs et al. 2011, cf. Lindner et al. 2011). Later attempts to determine SMG positions and redshifts using near- and mid-IR imaging could not fully overcome the bias towards lower redshifts, since the corrections there are no more favorable than those in the radio regime, such that high-redshift sources are much fainter (e.g. Wardlow et al., 2011; Yun et al., 2012). Millimeter spectroscopic surveys toward gravitationally-lensed, dusty, star-forming galaxies, taking advantage of their apparent ultra brightness, revealed a redshift distribution stretching out to (e.g. Vieira et al., 2013; Weiß et al., 2013; Strandet et al., 2016). These surveys suggested a larger fraction of SMGs at than previous studies of unlensed SMGs, perhaps partly because they were selected at 1.3 mm rather than the traditional 0.8–1.1 mm, but also because the requirement for high magnification favors galaxies with a long line of sight. We need to reveal the intrinsic redshift distributions of unlensed SMGs in large contiguous maps to determine their abundance in the early Universe and to study the evolution of the most massive galaxies via abundance matching with other populations, and with cosmological predictions (e.g. Hayward et al., 2013; Cowley et al., 2015).
Early (sub)mm interferometric imaging of intrinsically bright SMGs, conducted with the IRAM Plateau de Bure interferometer (PdBI) and the Submillimeter Array (SMA) (e.g. Gear et al., 2000; Iono et al., 2006; Younger et al., 2007; Dannerbauer et al., 2008; Younger et al., 2009), pinpointed the positions of SMGs, including radio-faint ones, and resulted in the discovery of SMGs at –5 (e.g. Capak et al., 2011). Subsequently, surveys with PdBI and the Combined Array for Research in Millimeter-wave Astronomy (CARMA) indicated that the redshift distribution of intrinsically bright SMGs most likely stretches to (Smolčić et al., 2012).
The capabilities of the Atacama Large Millimeter/submm Array (ALMA) now enable astronomers to rapidly pinpoint the positions of large samples of SMGs, with no strong biases (though see Zhang et al., 2016). ALMA submm continuum imaging surveys towards LABOCA 870-m-selected SMGs (e.g. Hodge et al., 2013; Simpson et al., 2014) and AzTEC 1100-m-selected SMGs (Ikarashi et al., 2015) have uncovered a number of radio-faint SMGs. Some of these radio-faint SMGs have been too faint at optical/near-IR wavelengths to permit estimation of their redshifts using standard techniques (Simpson et al., 2014; Ikarashi et al., 2015). Some could lie at very high redshifts, i.e. ; alternatively, they could be heavily dust-obscured SMGs at more moderate redshifts, –5. The redshifts of these SMGs remains a puzzle, with important implications for our understanding of early galaxy evolution.
ALMA mm-wave continuum imaging of candidate SMGs have revealed surprisingly compact sizes, supporting the idea that SMGs could evolve into compact quiescent galaxies at (Ikarashi et al., 2015). The latest intensive optical/near-/mid-IR extragalactic surveys have reported compact quiescent galaxies up to (Straatman et al., 2015). In order to understand the formation phase of these massive, passive galaxies at , surveys and studies of SMGs –5 are as important today as they ever were.
In this paper, we present a detailed multi-wavelength analysis of two ALMA-identified galaxies, ASXDF1100.053.1 and ASXDF1100.231.1, detected originally in a deep ASTE/AzTEC survey at 1100 m (Ikarashi et al., 2015). These SMGs were selected for further scrutiny on the basis of their secure non-detections in Herschel 100–500-m images, which give the most useful constraints on redness at submm wavelengths (see also Cox et al., 2011; Riechers et al., 2013; Dowell et al., 2014; Asboth et al., 2016; Ivison et al., 2016). Too faint at optical/near-IR wavelengths to allow meaningful estimation of their redshifts using classical photometric techniques, we have instead determined photometric redshifts using deep radio/submm/far-IR images from the Janksy VLA, ALMA, SCUBA-2 and Herschel, respectively, aiming to reveal whether these galaxies are indeed located at very high redshifts — obvious candidate progenitors of the massive passive galaxies at . We adopt throughout a cosmology with km s-1 Mpc-1, and , and all magnitudes refer to the AB system.
2. The targets: ASXDF1100.053.1 and 231.1
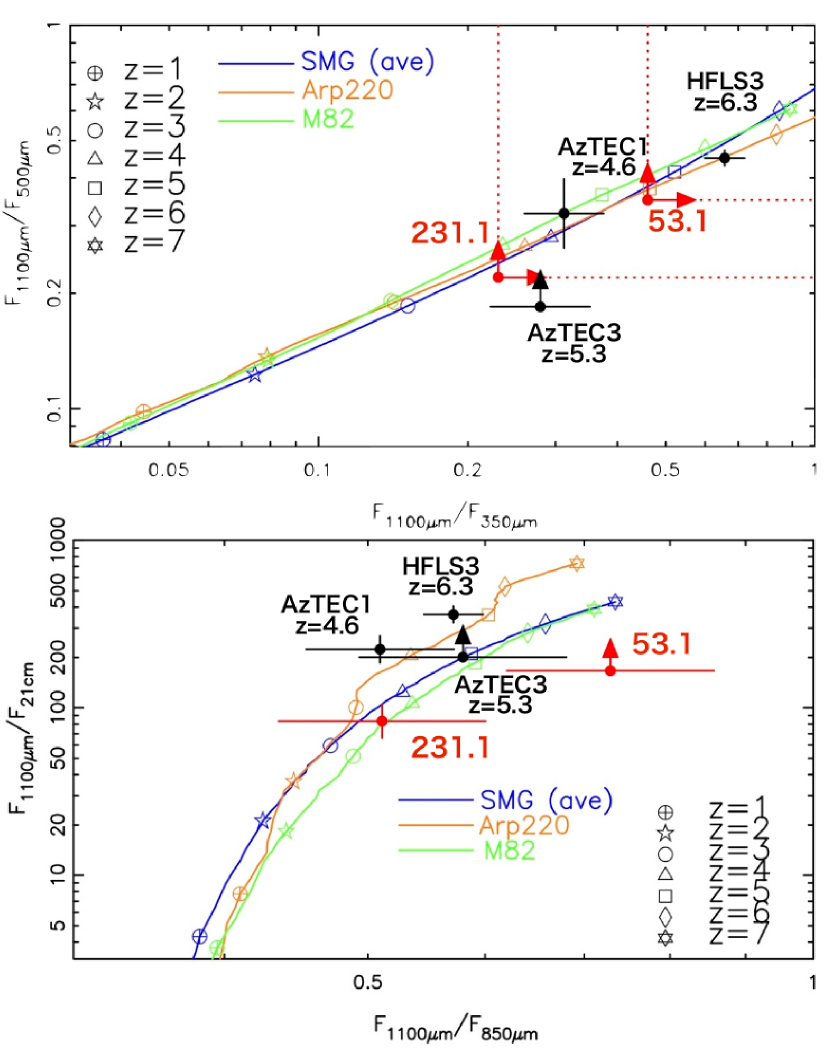
ASXDF1100.053.1 and 231.1 are the brightest and second-brightest 1100-m-selected ALMA-identified SMGs among the candidates discovered in our ALMA Cycle-1 program (2012.1.00326.S: PI. Ikarashi). The parent sample consists of 221 SMGs discovered in a deep AzTEC/ASTE 1100-m map covering 950 arcmin2 of the Subaru/XMM-Newton Deep Field (SXDF) (e.g. Furusawa et al., 2008), which includes the UKIDSS Ultra Deep Survey (UDS) field (e.g. Lawrence et al., 2007). In our ALMA program, we targeted 30 SMGs from this parent sample, selected on the basis of their faintness in 1.4-GHz VLA imaging (Jy, Arumugam et al. 2016) and SPIRE 250-m images ( mJy, Oliver et al. 2012), aiming to reveal the tail of the SMG redshift distribution. The faintness of these two SMGs at optical/near-/mid-IR wavelengths suggests –5 (Ikarashi et al. 2015; Fig. 1). The submm (250, 350, 500 and 850 m)/mm (1100 m)/radio (1.4 GHz) colors of ASXDF1100.053.1 and 231.1 are as red as – or redder – than known SMGs, which suggests that these new SMGs could lie at (Fig. 1). We thus focus on these two SMGs for a pilot study of candidate extremely high-redshift SMGs.
3. Data and photometry
Here we describe the observational data used in this paper. Our images are shown in Figs 2 and 3, and measurements are listed in Table. 1.
3.1. ALMA 1100-m continuum
We first describe the ALMA data taken in Cycle 1 (S. Ikarashi et al. in preparation: see also Ikarashi et al., 2015). These observations were carried out with an array configuration similar to C32-3, with 25 working 12-m antennas covering distances up to k. On-source observation times (per target) were 3.6–4.5 minutes.
The two SMGs were also observed as part of an ALMA continuum imaging survey of 333 bright AzTEC SMGs in Cycle 2 (2013.1.00781: PI. Hatsukade). These observations were carried out in array configurations C34-5 and C34-7, with 37–38 working 12-m antennas covering distances up to k. On-source observation times per source were 0.6 minutes.
We combined the ALMA data obtained in Cycles 1 and 2. Synthesized beams were then 0′′.460′′.35 (PA, 69∘) and 0′′.570′′.48 (PA, 82∘) for ASXDF1100.053.1 and 231.1, respectively, with sensitivities of 70 and 63 Jy beam-1 (1). ASXDF1100.053.1 and 231.1 were detected with 27 and 29, respectively, with total flux densities, and mJy.
Both ASXDF1100.053.1 and 231.1 appear to be single, unblended SMGs, with no signs of multiplicity; their ALMA 1100-m flux densities are consistent (within 1) with those measured by AzTEC/ASTE (S. Ikarashi et al. in preparation).
3.2. Jansky Very Large Array radio continuum
3.2.1 Classic VLA 1.4-GHz continuum
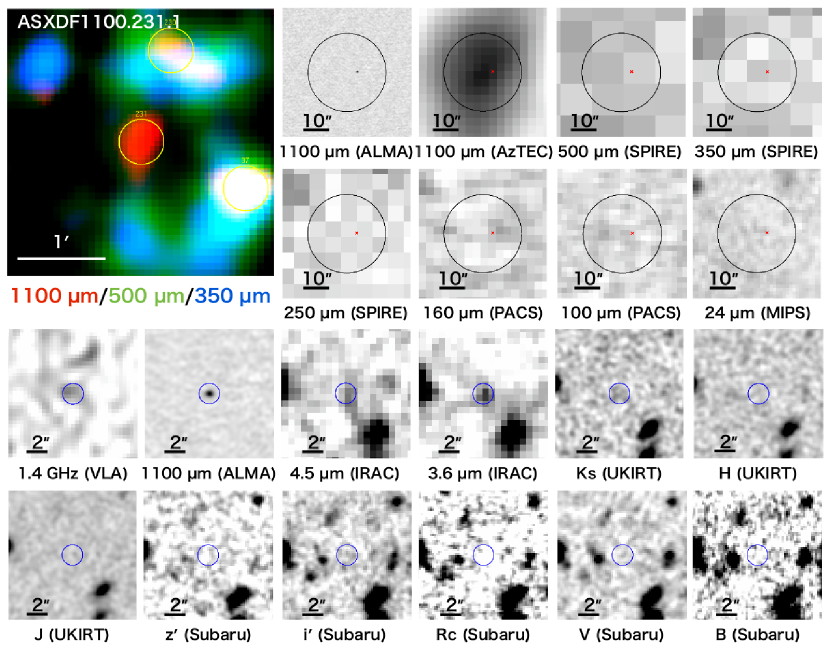
The accurate SMG positions from our ALMA images enable us to exploit existing deep VLA radio continuum maps. ASXDF1100.231.1 was detected at 3.3 in an existing wide, deep VLA 1.4-GHz image of the SXDF field (Arumugam et al., 2016); ASXDF1100.053.1 was not detected. The r.m.s. noise of the map is 6–8 Jy beam-1, and the FWHM synthesized beam is .5.
3.2.2 Jansky VLA 6-GHz continuum
In order to measure the radio flux density of ASXDF1100.053.1, we conducted new extremely deep Jansky VLA observations. The data were obtained from 2015 February to April with the Jansky VLA in its B configuration, using the new 3-bit samplers111We acknowledge funding towards the 3-bit samplers used in this work from ERC Advanced Grant 321302, COSMICISM., with the WIDAR correlator, covering an almost contiguous 4-GHz band across 4–8 GHz (several spectral windows covering a total of GHz were discarded due to radio-frequency interference). The phase center was set to be the position of ASXDF1100.053.1. The FWHM field of view (FoV) covers a circular area of radius 3.7 arcmin in the final map. The total observation time was 14 hr, of which 10.1 hr were spent on-source. We chose J02390234 as the gain calibrator, using 3C 48 as the bandpass calibrator and to set the flux density scale. We reduced the data with CASA and imaged using a natural weighting scheme. The resulting map reaches an r.m.s. noise level of 1.1 Jy beam-1 and has a synthesized beam size of (PA, ). Given the color correction between 1.4 and 6 GHz for a radio spectral index, , the sensitivity of the new Jansky VLA 6-GHz map is more than deeper than the old VLA 1.4-GHz map. In the new 6-GHz map we detect emission at the position of ASXDF1100.053.1: Jy (4.0 ). The source characteristics are summarized in Table 2.
3.3. Herschel/SPIRE 250–500-m continuum
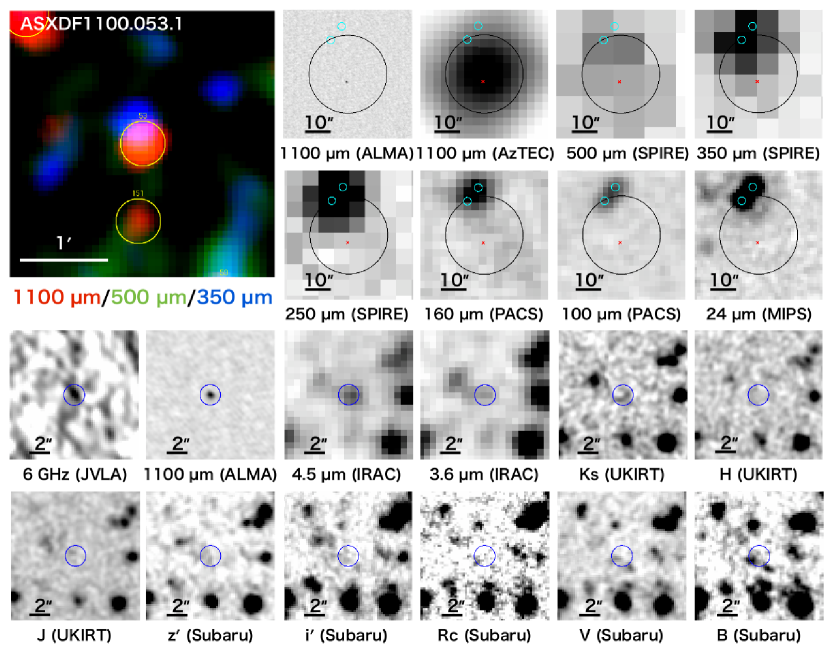
We use the Herschel/SPIRE 250, 350 and 500-m maps in the UKIDSS UDS field, provided as part of the HerMES (Oliver et al., 2012) 2nd data release (DR2). Armed with ALMA positions, accurate to , it is clear that both of ASXDF1100.053.1 and 231.1 were not detected in deep imaging by Herschel PACS and SPIRE images (see Figs 2 and 3): the respective flux densities in the 250-, 350- and 500-m maps are 4.2, 6.3 and 9.5 mJy beam-1, and those at the position of ASXDF1100.231.1 are 0.7, 5.2 and 3.1 mJy beam-1. These values are below the 3- limits measured in residual SPIRE maps of areas around ASXDF1100.053.1 and 231.1, where the residual maps have been deblending based on the positions of known VLA-1.4 GHz and MIPS 24-m sources. The respective 250-, 350- and 500-m flux densities of ASXDF1100.053.1 in the residual images are , 0.1 and 4.3 mJy beam-1, and those of ASXDF1100.231.1 are 0.6, 4.0 and 0.8 mJy beam-1.
3.4. SCUBA-2 850-m continuum
Both ASXDF1100.053.1 and 231.1 are detected in the deep SCUBA-2 850-m map of the SCUBA-2 Cosmology Legacy Survey Data Release 1. In Geach et al. (2016) they are referred to as UDS0186 and UDS0206, with 850-m flux densities of and mJy, respectively. The respective offsets between their ALMA 1100-m and SCUBA-2 850-m positions are 2.5 and 5.7 arcsec, consistent with the SCUBA-2 positional offset distributions (Simpson et al., 2015b).
3.5. Spitzer mid-IR continuum
We use the deep Spitzer IRAC 3.6- and 4.5-m maps from the Spitzer Extended Deep Survey (SEDS; Ashby et al., 2013) and IRAC 5.8- and 8.0-m and MIPS 24-m data from the Spitzer UKIDSS Ultra Deep Survey (SpUDS; PI. J. Dunlop; see e.g. Caputi et al., 2011). IRAC counterparts of ASXDF1100.053.1 and 231.1 were found at (RA, Dec) (02h16m48.19s, 58′59.6′′) and (02h17m59.62s, 46′59.7′′), respectively, with offsets from the ALMA positions of 0′′.2 and 0′′.5. Photometric measurements performed at the IRAC positions with fixed apertures and aperture corrections for 2.4′′-(IRAC 3.6 and 4.5 m); 2.8′′- (IRAC 5.8 and 8.0 m). The MIPS 24-m upper limit () is based on photometry at random positions including an aperture correction for 7′′-. For 2- detections in IRAC maps, we adopt upper limits.
3.6. Optical/near-IR continuum
We use optical/near-IR images at , , , and -bands from the Subaru Telescope (Furusawa et al., 2008) and near-IR images at , and -bands from the UKIRT IR Deep Sky Survey (UKIDSS; Lawrence et al., 2007). We measured fluxes with fixed apertures at the positions of the IRAC counterparts and applied aperture corrections: 2′′- aperture for through . Errors were derived from random aperture photometry. Again, For 2- detections, we adopt upper limits.
4. Radio/mm-wave photometric redshifts
The existence of SMGs which are extremely faint at optical to mid-IR wavelengths has long been recognized (e.g. Hughes et al., 1998; Ivison et al., 2000; Wang et al., 2009; Weiß et al., 2009; Walter et al., 2012) and radio/submm colors have been used to estimate the redshifts of heavily dust-obscured SMGs (e.g. Carilli & Yun, 1999; Hughes et al., 2002; Ivison et al., 2005; Aretxaga et al., 2003, 2005, 2007), exploiting the tight correlation between radio and far-IR luminosities seen for local galaxies (Condon, 1992).
| ASXDF1100.053.1 | ASXDF1100.231.1 | ||
| Wavelength | Flux (Jy) | Flux (Jy) | Reference |
| Suprime Cam -band (0.45 m) | 0.014 | 0.016 | 1 |
| Suprime Cam -band (0.55 m) | 0.023 | 0.021 | 1 |
| Suprime Cam -band (0.66 m) | 0.027 | 0.025 | 1 |
| Suprime Cam -band (0.77 m) | 0.027 | 0.025 | 1 |
| Suprime Cam -band (0.92 m) | 0.064 | 1 | |
| WFCAM -band (1.2 m) | 0.14 | 0.14 | 2 |
| WFCAM -band (1.6 m) | 0.23 | 0.23 | 2 |
| WFCAM (2.2 m) | 0.19 | 0.19 | 2 |
| IRAC 3.6 m | 3 | ||
| IRAC 4.5 m | 3 | ||
| IRAC 5.8 m | 3.5 | 4 | |
| IRAC 8.0 m | 4.7 | 4 | |
| MIPS 24 m | 66 | 66 | 4 |
| PACS 110 m | 2400 | 2400 | 5 |
| PACS 160 m | 5000 | 5000 | 5 |
| SPIRE 250 m | 9600 | 8800 | 5 |
| SPIRE 350 m | 7700 | 9800 | 5 |
| SPIRE 500 m | 10000 | 10000 | 5 |
| SCUBA2 850 m | 6 | ||
| ALMA 1100 m | 7 | ||
| JVLA 6 GHz | 7 | ||
| VLA 1.4 GHz | 17.8 | 8 | |
| Notes. 2- and 3- upper limits are presented for (stellar) emission at 0.45–8.0 m and dust/synchrotron | |||
| emission at 24 m through 1.4 GHz, respectively. | |||
| References: (1) Furusawa et al. (2008); (2) Lawrence et al. (2007); (3) Ashby et al. (2013); (4) Caputi et al. (2011), | |||
| (5) Oliver et al. (2012); (6) Geach et al. (2016); (7) this work; (8) Arumugam et al. (2016). | |||
| Observation date | 2015 February 16 |
|---|---|
| March 2, 9, 17 and 30 | |
| April 2 | |
| Frequency | 4–8 GHz |
| Phase center (J2000) | RA 02h16m48s |
| Dec. 58′59′′ | |
| Gain calibrator | J02390234 |
| Flux density calibrator | 3C 48 |
| Bandpass calibrator | 3C 48 |
| Array configuration | B |
| Projected baselines | 0.2–11 km |
| Primary beam | 7.3 arcmin (FWHM) at 6 GHz |
| Synthesized beam size | (PA, ) |
| Map noise level | 1.1 Jy beam-1 |
4.1. Method
We estimate the radio/submm photometric redshifts of ASXDF1100.053.1 and ASXDF1100.231.1 by fitting dust SED templates to ALMA 1100-m, SCUBA-2 850-m and (J)VLA 6- or 1.4-GHz flux densities.
When making radio/(sub)mm photometric redshift estimates, obtaining strong constraints around the peak of the dust SEDs is important, to exclude spurious SED models which return dubious redshift estimates due to the degeneracy between redshift and dust temperature (e.g. Blain et al., 2002). For most SMGs at –3, the Herschel SPIRE images at 250, 350 and 500 m cover the redshifted dust SED peak. ASXDF1100.053.1 and 231.1 are not detected in the Herschel SPIRE maps (Figs 2 and 3) and we have therefore included -upper limits from the SPIRE data at 250, 350 and 500 m as survival functions (Isobe et al., 1986), as was done for SCUBA 450-m upper limits in radio/submm photometric redshift estimates in Aretxaga et al. (2007). Survival function enables us to derive redshift probability densities in the entire of a redshift range avoiding drastic changes due to upper limits in fluxes.
Radio/submm photometric redshifts typically have larger uncertainties than optical/near-IR photometric redshifts because of the lack of clear SED features, such as continuum breaks. Since redshift estimates using radio/(sub)mm colors depend on the adopted dust SED, we need to use SEDs representative of our target population, i.e. galaxies with similar IR luminosities and similar redshifts.
Here, we adopt the SED template made from of 99 ALMA-identified SMGs, derived from deep Herschel and ALMA submm and VLA radio data presented in Swinbank et al. (2014). The SEDs of ALMA-identified SMGs were fitted with a library of 185 SEDs from Chary & Elbaz (2001), Rieke et al. (2009), Draine et al. (2007), Ivison et al. (2010) and Carilli et al. (2011), adopting optical/near-IR photometric redshifts from Simpson et al. (2014). The dust temperature of the best-fit SED of each ALMA-identified SMG is listed in the paper. We picked SEDs randomly from the parent SED library along with the dust temperature distribution (19–52 K) for the ALMA-identified SMGs derived in Swinbank et al. (2014) 222The reformatted SED templates with dust temperatures used in Swinbank et al. (2014) are distributed at http://astro.dur.ac.uk/~ams/HSOdeblend/templates/, and calculated the redshift probability density distribution for each chosen SED. We bootstrapped this process and combined the derived probability density distributions in order to achieve a redshift probability density distribution weighted by the likelihood of each SED temperature.
The multi-variate Gaussian probability distribution, , for k colors, is given by
| (1) |
where is a covariance matrix. Here we assume that any non-diagonal elements in the covariance matrix are zero, therefore can be substituted by standard . is a survival function (Isobe et al., 1986). The survival function is expressed using an complementary error function as
| (2) |
We assume that the flux density errors follow Gaussian distributions. The final redshift probability distribution, , of any galaxy is the sum of the individual probabilities from the SEDs, or explicitly
| (3) |
where is the normalization constant, such that where . The asymmetric error bars (,) correspond to 68% confidence levels such that d and () is minimized. These calculations follow the methodology presented in Hughes et al. (2002) and that on the survival function.
4.2. Resulting redshift estimates
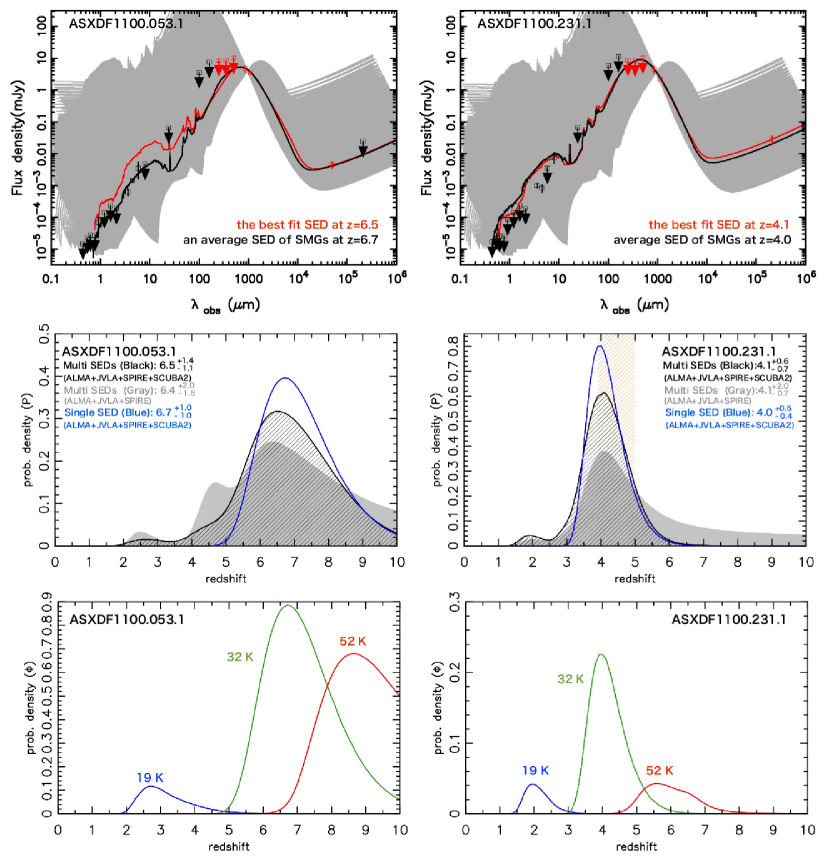
The radio/submm photometric redshift probability distributions for ASXDF1100.053.1 and 231.1 are shown with black curves in Fig. 4 along with fit-SEDs. The resultant photometric redshifts for ASXDF1100.053.1 and 231.1 are and , respectively.
Probability densities, , for each SED with 19, 32 and 52 K given by Equation 1, are shown at the bottom of Fig. 4, with the aim of understanding the contributions of these SEDs to the combined photometric redshift probability distributions. The density plots indicate that the low probabilities of low-redshift solutions in the combined redshift probability distribution, , are due to two factors: (1) the rarity of cold SEDs due to the dust temperature distribution, and (2) the cold SEDs give poor fits. The plots also demonstrate that solutions for cold SEDs are less plausible for the two SMGs, regardless of the rarity or otherwise of cold SEDs.
4.3. Benchmark tests of the redshift estimates
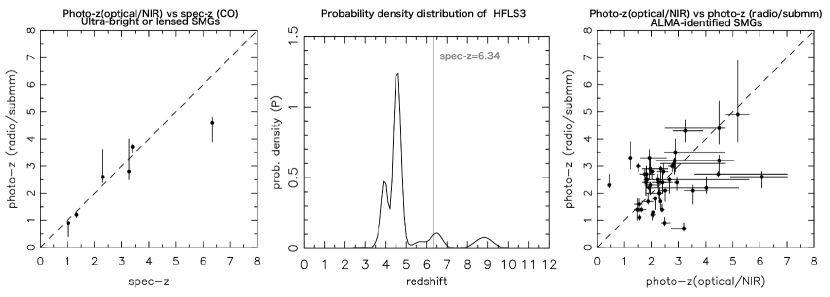
It is informative to perform some benchmark tests, using SMGs with known spectroscopic redshifts to assess whether our method returns sensible values and to evaluate systematics in our photometric redshift estimates. We have found seven bright or lensed SMGs with CO spectroscopic redshifts which have SPIRE, -m and radio photometry in the literature (Ivison et al., 2010; Ikarashi et al., 2011; Riechers et al., 2013; Wardlow et al., 2013; Messias et al., 2014). Fig. 5 shows comparisons of their radio/(sub)mm photometric redshifts and their spectroscopic redshifts. All except HFLS3 show good agreement. The under-estimation of the redshift when using the radio/(sub)mm method for HFLS3 can be explained by its abnormally high dust temperature (56 K). As the probability density distribution shows (see middle in Fig. 5), there is a small local peak around the spectroscopic redshift with a similar to that of HFLS3.
In addition to benchmark tests with a spectroscopic sample, we also conducted another benchmark test using 46 radio-detected ALMA-identified SMGs from ALESS with optical/near-IR photometric redshifts (Simpson et al., 2014; Swinbank et al., 2014). ALESS sources were originally 880-m-selected SMGs and are expected to be drawn from the same population as ASXDF1100.053.1 and 231.1. We estimate radio/submm photometric redshifts using SPIRE 250–500-m, ALMA 880-m and VLA 1.4-GHz flux densities (see these flux densities in Table A1 of Swinbank et al., 2014). A comparison of their radio/submm-estimated photometric redshifts and optical/near-IR estimates is shown in Fig. 5. We derived . Its median and 1 dispersion are 0.01 and 0.27, respectively. We should note that there is no contamination between optical/near-IR photometric redshifts of and radio/(sub)mm photometric redshifts of .
These benchmark tests suggest that our radio/(sub)mm photometric redshifts using multi-SEDs do not suffer strong systematics.
4.4. Cross-checking photometric redshifts
We first derived photometric redshifts using the average SED of 99 ALMA-identified SMGs from Swinbank et al. (2014). This redshift estimate is expected to give us the most reliable redshift for typical SMGs but will under-estimate the uncertainty due to the plausible diversity of SEDs. The derived redshift probability density distributions for ASXDF1100.053.1 and 231.1, based on the average SED, show results consistent with radio/submm-based photometric redshifts (Fig. 4): The respective photometric redshifts based on the average SED are and .
Redshift probability densities based on our redshift estimates without SCUBA-2 850-m data are shown in Fig. 4. The 850-m detection allows a smaller uncertainty and sharpens the redshift probability densities. This implies that the model 850-m flux densities of the SMGs based on photometric redshifts from ALMA 1100-m and (J)VLA radio colors and the upper limits at SPIRE bands are consistent with the observed 850-m flux densities.
4.5. Possible effects of the CMB on redshift estimation
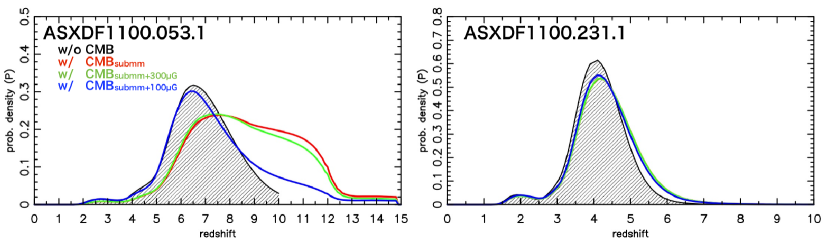
In the very early Universe, the cosmic microwave background (CMB) can have effects on observed submm and radio flux densities (see e.g. Zhang et al., 2016). Here we discuss possible contributions of the CMB to the radio/submm photometric redshifts using toy models for CMB effects.
On the basis of the predictions of CMB effects on observed total submm flux densities (da Cunha et al. 2013 deals with the effect on total flux densities, and Zhang et al. 2016 explores the spatially resolved effects), we took into account two CMB effects on observed submm flux densities: the effect on intrinsic far-IR/submm dust SEDs, and on the detectability of SMGs against the CMB background. We evaluate these effects on the observed flux densities at 1100, 850, 500, 350 and 250 m for the of each SED, in the same manner as da Cunha et al. (2013).
Observed radio flux densities of distant galaxies are expected to get fainter as a function of redshift due to suppression of synchrotron emission by inverse Compton (IC) losses off the CMB (Murphy, 2009). The suppression off radio flux densities by the CMB depends on the strength of the magnetic field () in a galaxy, about which we know very little.
On the basis of observational studies of SMGs in the literature, Murphy (2009) suggested that SMGs can have a strong , potentially G. McBride et al. (2014) reported a minimum strength of –500 G for local (U)LIRGs, based on observed synchrotron flux densities. They expected a stronger , G, based on measurements of Zeeman splitting in OH masers. Given that ASXDF1100.053.1 and 231.1 have compact mm-wave sizes and surface IR luminosity densities similar to those of local ULIRGs (see § 5 and § 6.2), these studies also support a strong for our sample.
In this paper, we investigate how the effect of the CMB on radio emission contributes to radio/mm photometric redshift estimates where and 300 G: 300 G is taken as the value for SMGs, and 100 G is used to examine what happens if the magnetic field is weaker. We determined the predicted suppression of non-thermal emission by the CMB using the equations and assumptions provided in Murphy (2009): we modeled the synchrotron emission by subtracting free-free and dust emission, where we model free-free emission from based on the equation (16) in the literature.
Fig. 6 shows the resulting redshift probability density distribution, including the CMB effects, for both ASXDF1100.053.1 and 231.1: (1) probability density without any CMB effects; (2) with the CMB effect at (sub)mm wavelengths; (3) with both of the CMB effects ( G); (4) with both of the CMB effects ( G). We see that taking the effects of the CMB into account pushes the photometric redshifts to higher values. However, as we do not have spectroscopic redshifts for the two SMGs, we cannot determine how strong this effect really is.
5. ALMA mm-wave source sizes
The first millimetric size measurements of ASXDF1100.053.1 and 231.1 were determined using our ALMA Cycle-1 data, which covered up to a distance of k, with a synthesized beam size of (FWHM – Ikarashi et al., 2015). These visibility data assumed Gaussian profiles and suggested compact millimetric sizes: and arcsec (FWHM) for ASXDF1100.053.1 and 231.1, respectively. In this section, we re-assess their millimetric sizes, combining Cycle-1 and -2 data, which now cover up to 1500 k.
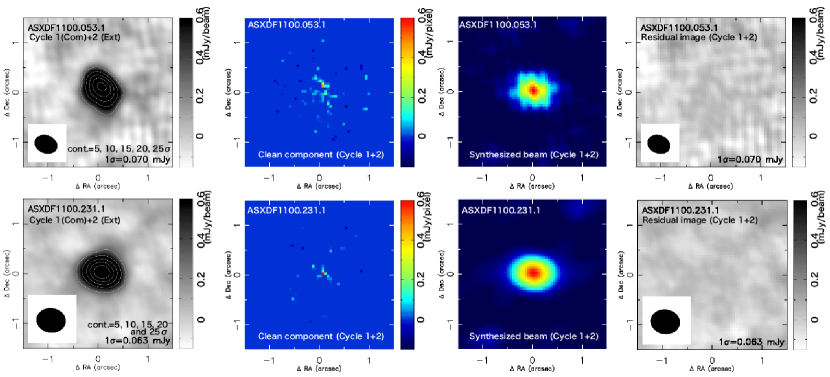
In Fig. 7, ALMA maps for ASXDF11100.053.1 and 231.1 are shown. These maps were generated from the combined ALMA 1100-m data, cleaning down to the 1- depth in a circle with a radius of 1 arcsec using the clean task in CASA. The pixel scale is 0′′.05 pixel-1.
5.1. Mm-Wave size measurements in visibility data
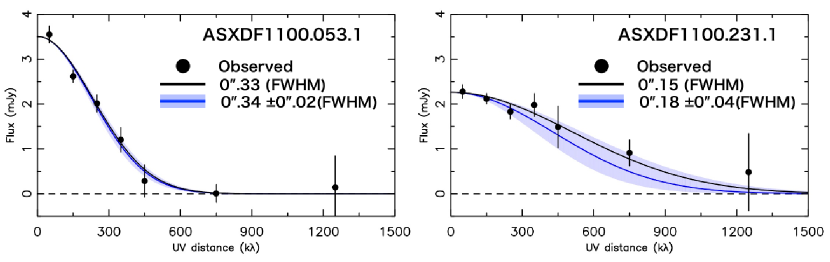
First, we measure mm-wave sizes of ASXDF1100.053.1 and 231.1 with the ALMA visibility data, in the same manner as Ikarashi et al. (2015). We use -distance versus amplitude plots (hereafter -amp plots) for the measurements (Fig. 8). Modelling sources with -amp plots helps us to avoid underestimating their flux densities, since we can interpolate/extrapolate across incomplete visibility coverage. We assume symmetric Gaussian profiles, as is usually done in the literature. Circularized effective radii estimated using plots are useful, even for sources with asymmetric profiles (Ikarashi et al., 2015). Bin sizes adopted in -distance are 100 k out to 500 k and 500 k between 500–1500 k. The estimated sizes of ASXDF1100.053.1 and 231.1 are then 0′′.33 and 0′′.15 (FWHM), respectively (Fig. 8). Correcting these ‘raw’ mm-wave sizes for systematic effects using Monte Carlo simulations, the mm-wave sizes are then 0′′.34 and 0′′.18 for ASXDF1100.053.1 and 231.1, respectively, consistent with our previous measurements.
5.2. Mm-Wave size measurements in clean component maps
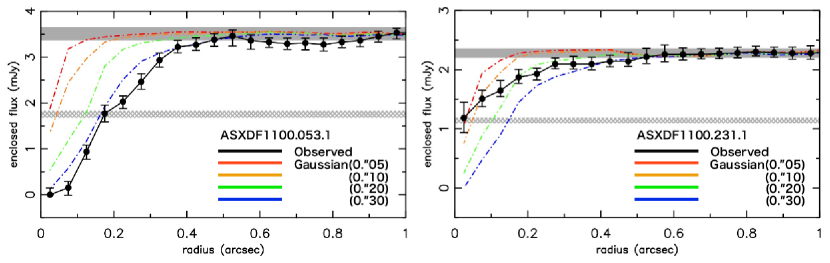
Next, we derive for ASXDF1100.053.1 and 231.1 using ALMA clean component maps, as shown in Fig. 7. These maps were generated from the combined ALMA 1100-m data by running the clean task in CASA. Our motivation is to measure directly, without any assumed model, exploiting the high signal-to-noise ratios of .
Fig. 9 shows enclosed flux densities as a function of radius for ASXDF1100.053.1 and 231.1, measured in the clean component maps. Total flux densities of the two SMGs in the clean component maps are consistent with the fluxes measured in the beam-convolved ALMA continuum images listed in Table 2, despite the potential absence of any components. Flux density errors are estimated based on Monte Carlo simulations using 100 independent sets of visibility data generated from the actual ALMA data. In the simulations, we input a Gaussian model with the same flux as one of the real sources, then imaged these data, generating clean component maps. We then measure the enclosed flux densities in the same manner as that for the real sources. We repeated this process with source sizes between 0′′.025 and 0′′.800 in steps of 0′′.025 (FWHM) to reconstruct observed enclosed flux densities in each bin. We adopted a flux density error in the simulation with an enclosed flux density closest to a real measured flux density in each radius bin as the error for the real measurements. We refer the reader to §A where we describe the simulations in more detail.
For ASXDF1100.053.1, based on the obtained enclosed flux density plot and the total flux density, we determine of 0.17 arcsec. Since the half width half maximum of a symmetric Gaussian is equivalent to , the size obtained from the clean component map is consistent with that from the -amp plot.
For ASXDF1100.231.1, the flux density in the center pixel is mJy beam-1. This corresponds to % of its total flux density. From the obtained enclosed flux density plot, with linear interpolation, we find arcsec, meaning the half light radius of ASXDF1100.231.1 is .04. determined via the clean component map is approximately smaller than that determined from the -amp plot, arcsec.
The enclosed flux density plot suggests that ASXDF1100.231.1 cannot be modeled with single Gaussian profile: ASXDF1100.231.1 appears to comprise a compact, intense mm emitting region, located in its center region, and a fainter, extended region. The different values determined using the -amp plot and the clean component map can thereby be understood.
Monte Carlo simulations of source size measurements in ALMA clean component maps are described in Appendix A. According to these simulations, this method of measuring source sizes is useful down to .025. The simulations show that the measured sizes of ASXDF1100.053.1 and 231.1 are not expected to suffer large systematic errors.
6. On the nature of ASXDF1100.053.1 and 231.1
Here we determine the properties of ASXDF1100.053.1 and 231.1 from multi-wavelength data, adopting the radio/submm photometric redshifts. We discuss the possible role of the two SMGs, which are faint in the Herschel bands, and at optical/near-/mid-IR and radio wavelengths, in the context of galaxy evolution.
6.1. Optical/near-IR SED fitting
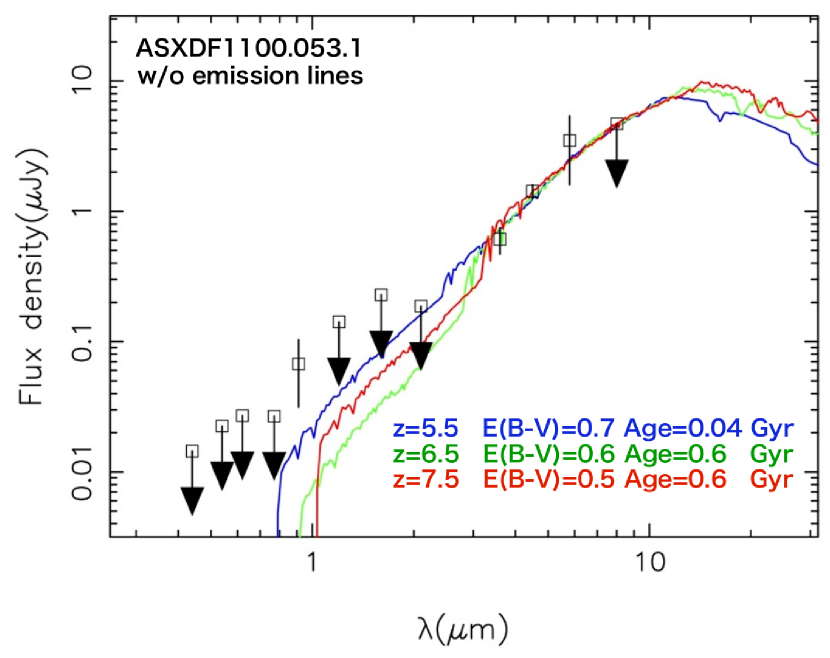
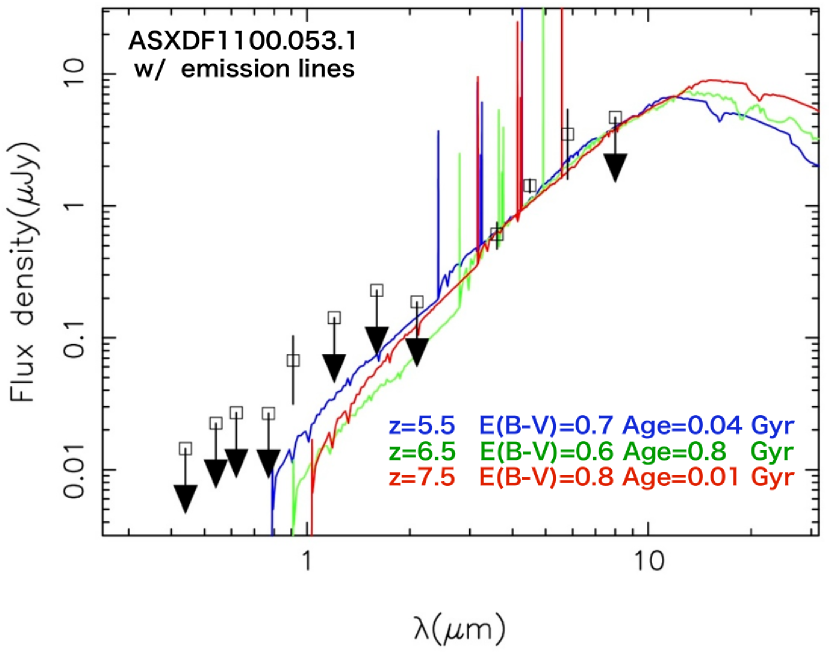
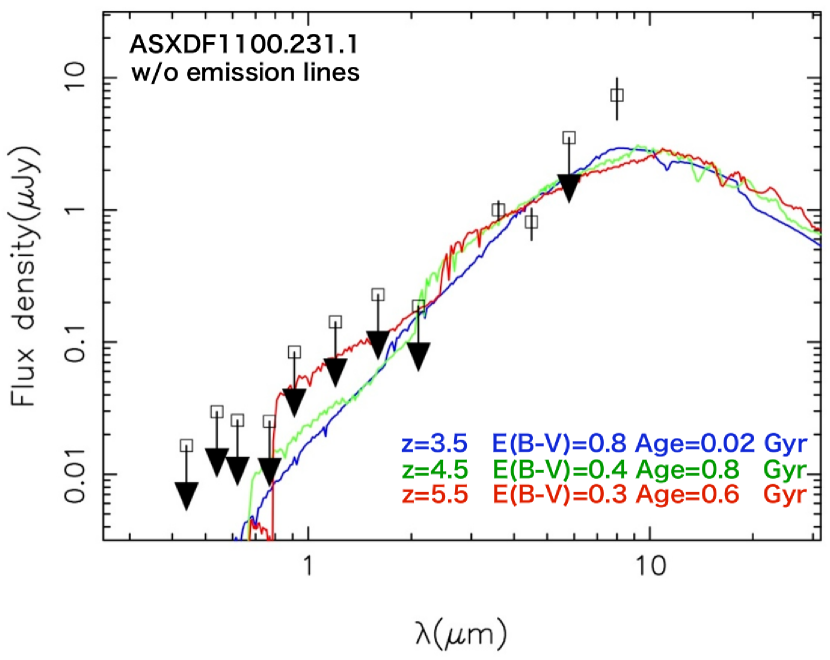
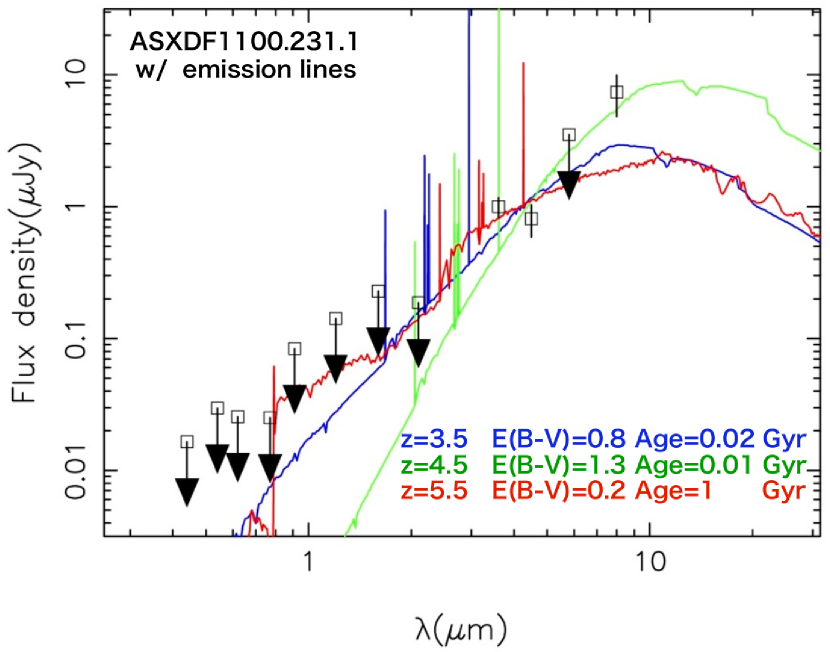
In order to characterize the optical/near-IR properties of ASXDF1100.053.1 and 231.1, we conducted an SED-fitting analysis across optical–mid-IR wavelengths. We adopted a Chabrier IMF (Chabrier, 2003) and stellar population synthesis models by Bruzual & Charlot (2003). Dust extinction was considered according to the prescription by Calzetti et al. (2000). We adopted metallicity, . We performed the analysis using the code, Le Phare (Arnouts et al., 1999; Ilbert et al., 2006). These SMGs are detected in only three or four filters in the available optical/mid-IR broad band images, similar to the extremely red mm source analyzed by Caputi et al. (2014). We derived optical/near-IR properties at fixed redshifts of , 6.5 and 7.5 for ASXDF1100.053.1, and , 4.5 and 5.5 for ASXDF1100.231.1, to reduce parameter space. These values span a range of approximately around the best radio/submm photometric redshifts. We conducted the SED fitting both with and without considering emission lines. Free parameters were star-formation history, age and dust extinction.
The best-fit SEDs are shown in Figs 10 and 11 and the derived parameters are summarized in Table 3. The observed optical/mid-IR SED of ASXDF1100.053.1 is well fit at , 6.5, and 7.5, both with and without emission lines as the minimum s show. ASXDF1100.053.1 has an extremely red color, , which can be reproduced by heavy dust extinction, –0.8. In all cases, the observed -band flux is not reproduced, but the detection at -band is only marginal (). If the detection is real, the rest-frame UV light may come from less obscured regions in ASXDF1100.053.1. It is worth mentioning that the Ly line should fall in the -band at –7.2, but the importance of this line in emission at such redshifts is still unclear.
The observed optical/mid-IR SED of ASXDF1100.231.1 is not well fit by the model SEDs. Its unusual colors, , and , imply a possible excess in the IRAC 3.6-m band. Remarkably, the SED of ASXDF1100.231.1 is best fit by the model at , including emission lines, with the heaviest extinction among our SED fits. The H emission line enters the IRAC 3.6-m band at –5.0, consistent with the radio/submm photometric redshift, (Fig. 4). Interestingly, two of 77 ALMA-identified SMGs in Simpson et al. (2014), ALESS1.2 and 65.1 have a similar color and excesses in the 3.6-m band (, and ) and both have (Simpson et al., 2014) and (Swinbank et al., 2012), respectively.
The stellar mass of ASXDF1100.053.1, derived from the SED fitting without emission lines, would be M⊙ at –7.5. When taking emission lines into account, the stellar mass becomes M⊙. For ASXDF1100.231.1: ignoring emission lines yields M⊙ at –5.5; with emission lines, M⊙. These stellar masses, which are summarized in Table 3, are consistent with those of known ALMA-identified SMGs (e.g. da Cunha et al., 2015).
6.2. Mm properties
The IR luminosities (, rest-frame 8–1000 m) and star-formation rates (SFRs) of ASXDF1100.053.1 and 231.1, can be estimated from the ALMA 1100-m continuum, having adopted the average SED of ALMA-identified SMGs from Swinbank et al. (2014), using
| (4) |
for a Chabrier IMF (Chabrier, 2003), according to the formula provided by Kennicutt (1998).
For ASXDF1100.053.1, L⊙ at –7.5 and the SFR is in the range 580–600 M⊙ yr-1. These and SFR estimates are largely independent of redshift, due to the strong negative K-correction at submm wavelengths (e.g. Blain et al., 2002). When we consider the CMB effects on the observed 1100-m fluxes, we find L⊙ and an SFR between 650–740 yr-1.
The corresponding values for ASXDF1100.231.1 are without the CMB correction are L⊙ at –5.5, with an SFR in the range 380–430 yr-1; with CMB corrections: and 420–450 yr-1. These values and errors are listed in Table 3.
As it was revealed in § 5, ASXDF1100.053.1 and 231.1 have the compact mm-wave sizes. From the clean component maps, we find 0.17 arcsec for ASXDF1100.053.1, and 0.04 arcsec for ASXDF1100.231.1. Given physical scales at –7.5, the of ASXDF1100.053.1 corresponds to 0.88–1.1 kpc. Given the physical scales at –5.5, the measured for ASXDF1100.231.1 is 0.20–0.25 kpc. For further characterization of sizes, we also derived , the circularized radii that include 90% of the total flux density from the enclosed flux functions (Fig. 9): (median) of ASXDF1100.053.1 for –7.5 is 2.2–2.6 kpc and that of ASXDF1100.231.1 for –5.5 is 1.6–2.1 kpc. We applied systematic corrections based on the simulations shown in § A. The compact nature of ASXDF1100.231.1 is similar to the few 100-pc clumps discovered by 0′′.015–0.05′′ imaging of SMGs by Iono et al. (2016) and Oteo et al. (2016). These values are consistent with suggestions of extended emission in SMGs in Hodge et al. (2016) and Iono et al. (2016).
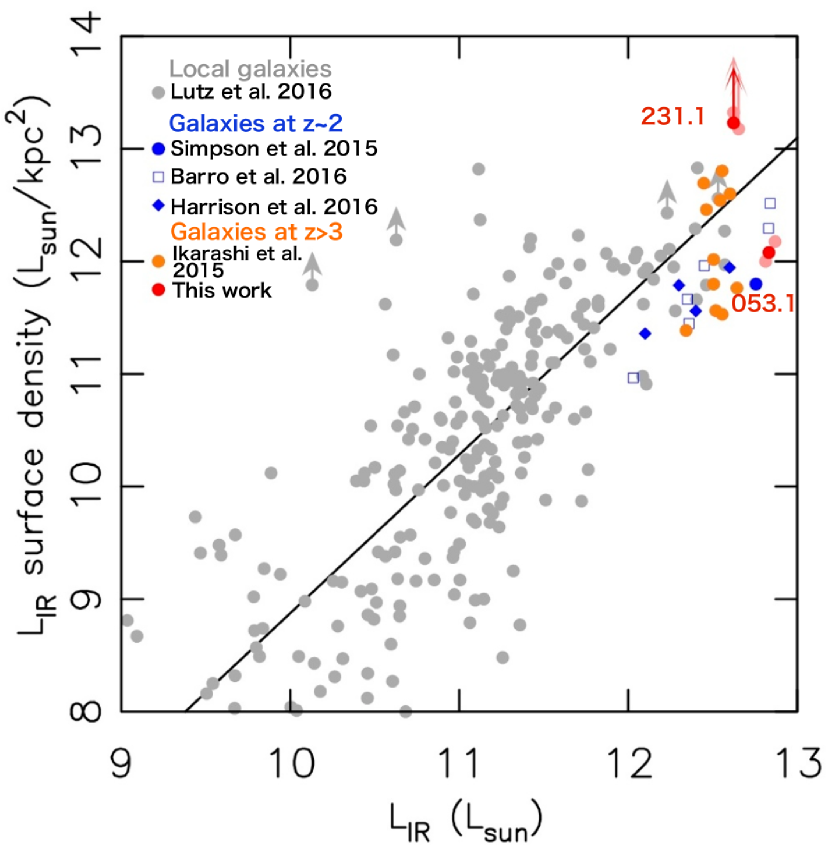
Surface IR luminosity densities () based on and are kpc-2 at –7.5 for ASXDF1100.053.1. Those of ASXDF1100.231.1 are kpc-2 for –5.5. Fig. 12 shows versus surface IR luminosity density for ASXDF1100.053.1 and 231.1, and demonstrates that for they are similar to local and high-redshift galaxies from Ikarashi et al. (2015); Simpson et al. (2015a); Barro et al. (2016); Harrison et al. (2016); Lutz et al. (2016). For and , respectively, ASXDF1100.053.1 and 231.1 have surface IR luminosity densities consistent with an empirical relation () derived for local galaxies in Lutz et al. (2016). The derived physical sizes and surface IR luminosities are summarized in Table 3.
6.3. Progenitors of compact quiescent galaxies?
Based on their mm-wave sizes and redshift estimates, Ikarashi et al. (2015) suggested that ASXDF1100.053.1 and 231.1 may be the progenitors of compact quiescent galaxies (cQGs), the evolutionary scenario suggested by Toft et al. (2014). cQGs have now reported out to (Straatman et al., 2015). Their stellar components have –3.2 kpc, with the median of 0.630.18 kpc. ASXDF1100.053.1 and 231.1 have compact enough starburst regions to evolve into cQGs at –4. ASXDF1100.053.1 has already created a stellar mass comparable to that found in cQGs at , (e.g. Belli et al., 2014; Krogager et al., 2014), and at –4, (Straatman et al., 2015), based on a Chabrier IMF (Chabrier, 2003). Furthermore, given the SMG duty cycle of Myr suggested in Toft et al. (2014), and the derived SFRs by mm measurements, its stellar mass is expected to increase by .
The observed stellar mass of ASXDF1100.231.1 is small in comparison with known cQGs, although there are large uncertainties. ASXDF1100.231.1 will generate an additional of stars via its on-going star formation, and can thus become similarly massive to the known cQGs.
From these facts, it seems clear that ASXDF1100.053.1 and 231.1 can potentially evolve into cQGs at , although it depends on their remaining gas masses and whether they quench their star formations on short timescales, i.e. the noted above.
7. Summary
We have conducted a detailed multi-wavelength study of two ALMA-identified SMGs, ASXDF1100.053.1 and 231.1, with extremely red submm colors, aiming to constrain their redshifts and better understand their nature. Based on their radio/submm colors, we have determined redshifts of and for ASXDF1100.053.1 and 231.1, respectively. We have quantified the influence of the CMB on these photometric redshifts using simple models, finding that even at the effects of the CMB do not lead to significant over-estimation.
We have measured mm-wave sizes of ASXDF1100.053.1 and 231.1 in deep ALMA continuum images. The derived circularized half-light radii of ASXDF1100.053.1 and 231.1 are and kpc, respectively. Their surface IR luminosity densities are and kpc-2, comparable to those of local (U)LIRGs and consistent with a known empirical trend in seen for local galaxies.
From an optical/near-/mid-IR SED analysis of ASXDF1100.053.1 and 231.1, adopting their radio/submm photometric redshifts. we find that ASXDF1100.231.1 has near-/mid-IR colors consistent with the existence of a redshifted H line at –5 in the IRAC 3.6-m band. The derived stellar masses of ASXDF1100.053.1 and 231.1 are comparable to those of known SMGs.
Given the observed stellar masses, SFRs and typical cycle times of SMGs, we find that ASXDF1100.053.1 and 231.1 can evolve into cQGs at . Our intensive studies of SMGs at , using the new capabilities of ALMA and JVLA, have allowed us to discover plausible candidate and SMGs which are too heavily dust-obscured to be detected even in the deepest optical/near-/mid-IR images.
| stellar mass | (8–1000 m) | SFR(IR) | ||||||
|---|---|---|---|---|---|---|---|---|
| w/o CMB | w/ CMB | w/o CMB | w/ CMB | |||||
| 1012 | 1012 | yr-1 | yr-1 | kpc | kpc-1 | |||
| ASXDF1100.053.1 w/o emission lines | ||||||||
| 3.4 | 5.8 | 6.5 | 580 | 650 | ||||
| 4.5 | 5.8 | 6.8 | 580 | 680 | ||||
| 4.4 | 6.0 | 7.4 | 600 | 740 | ||||
| ASXDF1100.053.1 w/ emission lines | ||||||||
| 2.8 | 5.8 | 6.5 | 580 | 650 | ||||
| 4.2 | 5.8 | 6.8 | 580 | 680 | ||||
| 3.8 | 6.0 | 7.4 | 600 | 740 | ||||
| ASXDF1100.231.1 w/o emission lines | ||||||||
| 12 | 4.3 | 4.5 | 430 | 450 | 1.5 | |||
| 10 | 3.9 | 4.2 | 390 | 420 | 1.7 | |||
| 7.5 | 3.8 | 4.2 | 380 | 420 | 2.1 | |||
| ASXDF1100.231 w/ emission lines | ||||||||
| 12 | 4.3 | 4.5 | 430 | 450 | 1.5 | |||
| 5.5 | 3.9 | 4.2 | 390 | 420 | 1.7 | |||
| 8.4 | 3.8 | 4.2 | 380 | 420 | 2.1 | |||
Appendix A Simulations of enclosed fluxes with Gaussian models
Here we describe simple sanity checks of our measurements of enclosed fluxes in the ALMA clean component maps presented in § 5. For ASXDF1100.053.1. We prepared 100 independent noise data of ALMA visibility generated from actual ALMA data for ASXDF1100.053.1. We input a symmetric Gaussian model with a size into the 100 noise visibility data. Here a total flux of the input model is same with that of ASXDF1100.053.1. We imaged and cleaned the 100 noise visibilities with the input model in the same manner with the actual observed data for ASXDF1100.053.1, and we measured enclosed fluxes. We repeated these process from input sizes of 0′′.025 (FWHM) to 0′′.800 with a step of 0′′.025.
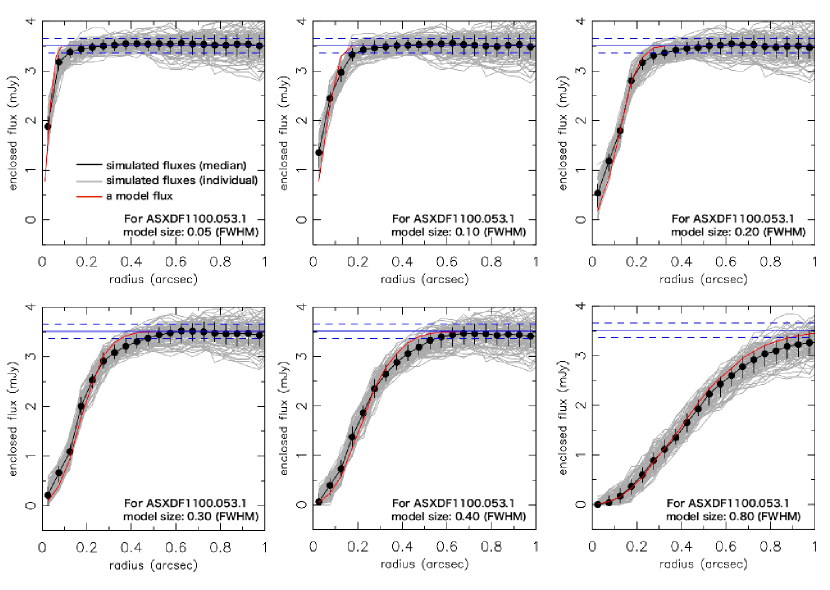
Fig. 13 shows resulted enclosed fluxes of mock Gaussian sources as a function of radius. The extracted fluxes of the mock sources show that the input total fluxes are recovered. However, in the cases of mock sources with larger input-size, the input total fluxes are not completely recovered. A fraction of flux remaining in a residual image is expected to get larger in our clean process down to the noise level for a source with a larger size. At a mm-wave size of .40 where ASXDF1100.053.1 is located, an expected missing flux is 2%, which is negligible. We also conducted simulations using the ALMA data for ASXDF1100.231.1 and we obtained similar results to those for ASXDF1100.053.1.
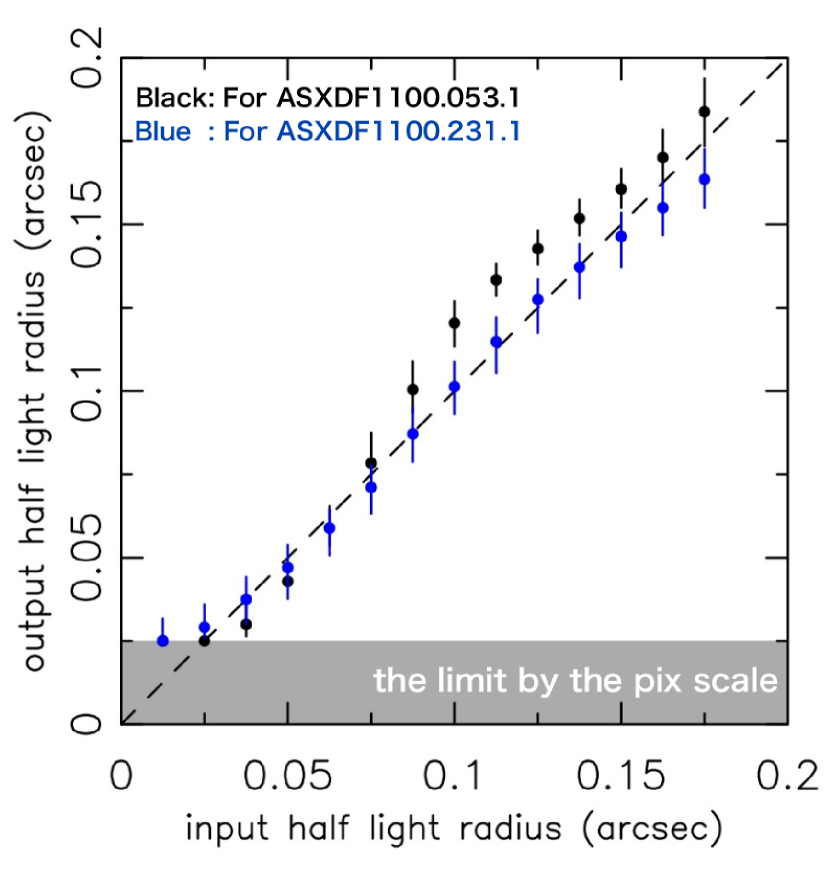
Fig. 14 shows comparisons between input and output half light radii from the simulations based on the ALMA data for ASXDF1100.053.1 and 231.1, respectively. Both plots indicate that our source size measurements in the ALMA continuum clean component maps are sensitive down to the limit by the pixel scale of 0′′.05 pixel-1. Fig. 14 indicates that source size measurements in the ALMA continuum clean component map of ASXDF1100.231.1 can reproduce sizes well. On the other hand, Fig. 14 shows that size measurements in the ALMA continuum clean component map of ASXDF1100.053.1 can overestimate sizes around a size of 10–0.15 arcsec. The overestimation of sizes can be at most 0.02 arcsec or 20%. However, the measured size () of ASXDF1100.053 is 0′′.17, therefore, the possible systematic offset is expected not to contribute to the measured size of ASXDF1100.053.1.
References
- Aretxaga et al. (2003) Aretxaga, I., Hughes, D. H., Chapin, E. L., et al. 2003, MNRAS, 342, 759
- Aretxaga et al. (2005) Aretxaga, I., Hughes, D. H., & Dunlop, J. S. 2005, MNRAS, 358, 1240
- Aretxaga et al. (2007) Aretxaga, I., Hughes, D. H., Coppin, K., et al. 2007, MNRAS, 379, 1571
- Aretxaga et al. (2011) Aretxaga, I., Wilson, G. W., Aguilar, E., et al. 2011, MNRAS, 415, 3831
- Arnouts et al. (1999) Arnouts, S., Cristiani, S., Moscardini, L., et al. 1999, MNRAS, 310, 540
- Arumugam et al. (2016) Arumugam, V., et al. 2016, submitted
- Asboth et al. (2016) Asboth, V., Conley, A., Sayers, J., et al. 2016, MNRAS, 462, 1989
- Ashby et al. (2013) Ashby, M. L. N., Willner, S. P., Fazio, G. G., et al. 2013, ApJ, 769, 80
- Barro et al. (2016) Barro, G., Kriek, M., Pérez-González, P. G., et al. 2016, ApJ, 827, L32
- Bell (2003) Bell, E. F. 2003, ApJ, 586, 794
- Belli et al. (2014) Belli, S., Newman, A. B., Ellis, R. S., & Konidaris, N. P. 2014, ApJ, 788, L29
- Biggs et al. (2011) Biggs, A. D., Ivison, R. J., Ibar, E., et al. 2011, MNRAS, 413, 2314
- Blain et al. (2002) Blain, A. W., Smail, I., Ivison, R. J., Kneib, J.-P., & Frayer, D. T. 2002, Phys. Rep., 369, 111
- Borys et al. (2004) Borys, C., Scott, D., Chapman, S., et al. 2004, MNRAS, 355, 485
- Bruzual & Charlot (2003) Bruzual, G., & Charlot, S. 2003, MNRAS, 344, 1000
- Calzetti et al. (2000) Calzetti, D., Armus, L., Bohlin, R. C., et al. 2000, ApJ, 533, 682
- Capak et al. (2011) Capak, P. L., Riechers, D., Scoville, N. Z., et al. 2011, Nature, 470, 233
- Caputi et al. (2011) Caputi, K. I., Cirasuolo, M., Dunlop, J. S., et al. 2011, MNRAS, 413, 162
- Caputi et al. (2014) Caputi, K. I., Michalowski, M., Krips, M., et al. 2014, ApJ, 788, 126
- Carilli & Yun (1999) Carilli, C. L., & Yun, M. S. 1999, ApJ, 513, L13
- Carilli et al. (2011) Carilli, C. L., Hodge, J., Walter, F., et al. 2011, ApJ, 739, L33
- Chabrier (2003) Chabrier, G. 2003, PASP, 115, 763
- Chapman et al. (2003) Chapman, S. C., Blain, A. W., Ivison, R. J., & Smail, I. R. 2003, Nature, 422, 695
- Chapman et al. (2005) Chapman, S. C., Blain, A. W., Smail, I., & Ivison, R. J. 2005, ApJ, 622, 772
- Chary & Elbaz (2001) Chary, R., & Elbaz, D. 2001, ApJ, 556, 562
- Condon (1992) Condon, J. J. 1992, ARA&A, 30, 575
- Cowley et al. (2015) Cowley, W. I., Lacey, C. G., Baugh, C. M., & Cole, S. 2015, MNRAS, 446, 1784
- Cox et al. (2011) Cox, P., Krips, M., Neri, R., et al. 2011, ApJ, 740, 63
- da Cunha et al. (2013) da Cunha, E., Groves, B., Walter, F., et al. 2013, ApJ, 766, 13
- da Cunha et al. (2015) da Cunha, E., Walter, F., Smail, I. R., et al. 2015, ApJ, 806, 110
- Dannerbauer et al. (2008) Dannerbauer, H., Walter, F., & Morrison, G. 2008, ApJ, 673, L127
- Dowell et al. (2014) Dowell, C. D., Conley, A., Glenn, J., et al. 2014, ApJ, 780, 75
- Draine et al. (2007) Draine, B. T., Dale, D. A., Bendo, G., et al. 2007, ApJ, 663, 866
- Furusawa et al. (2008) Furusawa, H., Kosugi, G., Akiyama, M., et al. 2008, ApJS, 176, 1
- Geach et al. (2016) Geach, J. E., Dunlop, J. S., Halpern, M., et al. 2016, arXiv:1607.03904
- Gear et al. (2000) Gear, W. K., Lilly, S. J., Stevens, J. A., et al. 2000, MNRAS, 316, L51
- Harrison et al. (2016) Harrison, C. M., Simpson, J. M., Stanley, F., et al. 2016, MNRAS, 457, L122
- Hayward et al. (2013) Hayward, C. C., Narayanan, D., Kereš, D., et al. 2013, MNRAS, 428, 2529
- Hodge et al. (2013) Hodge, J. A., Karim, A., Smail, I., et al. 2013, ApJ, 768, 91
- Hodge et al. (2016) Hodge, J. A., Swinbank, A. M., Simpson, J. M., et al. 2016, ApJ, 833, 103
- Hughes et al. (1998) Hughes, D. H., Serjeant, S., Dunlop, J., et al. 1998, Nature, 394, 241
- Hughes et al. (2002) Hughes, D. H., Aretxaga, I., Chapin, E. L., et al. 2002, MNRAS, 335, 871
- Ikarashi et al. (2011) Ikarashi, S., Kohno, K., Aguirre, J. E., et al. 2011, MNRAS, 415, 3081
- Ikarashi et al. (2015) Ikarashi, S., Ivison, R. J., Caputi, K. I., et al. 2015, ApJ, 810, 133
- Ilbert et al. (2006) Ilbert, O., Arnouts, S., McCracken, H. J., et al. 2006, A&A, 457, 841
- Iono et al. (2006) Iono, D., Peck, A. B., Pope, A., et al. 2006, ApJ, 640, L1
- Iono et al. (2016) Iono, D., Yun, M. S., Aretxaga, I., et al. 2016, ApJ, 829, L10
- Isobe et al. (1986) Isobe, T., Feigelson, E. D., & Nelson, P. I. 1986, ApJ, 306, 490
- Ivison et al. (1998) Ivison, R. J., Smail, I., Le Borgne, J.-F., et al. 1998, MNRAS, 298, 583
- Ivison et al. (2000) Ivison, R. J., Smail, I., Barger, A. J., et al. 2000, MNRAS, 315, 209
- Ivison et al. (2002) Ivison, R. J., Greve, T. R., Smail, I., et al. 2002, MNRAS, 337, 1
- Ivison et al. (2005) Ivison, R. J., Smail, I., Dunlop, J. S., et al. 2005, MNRAS, 364, 1025
- Ivison et al. (2007) Ivison, R. J., Greve, T. R., Dunlop, J. S., et al. 2007, MNRAS, 380, 199
- Ivison et al. (2010) Ivison, R. J., Swinbank, A. M., Swinyard, B., et al. 2010, A&A, 518, L35
- Ivison et al. (2016) Ivison, R. J., Lewis, A. J. R., Weiss, A., et al. 2016, ApJ, 832, 78
- Kennicutt (1998) Kennicutt, R. C., Jr. 1998, ARA&A, 36, 189
- Krogager et al. (2014) Krogager, J.-K., Zirm, A. W., Toft, S., Man, A., & Brammer, G. 2014, ApJ, 797, 17
- Lawrence et al. (2007) Lawrence, A., Warren, S. J., Almaini, O., et al. 2007, MNRAS, 379, 1599
- Lindner et al. (2011) Lindner, R. R., Baker, A. J., Omont, A., et al. 2011, ApJ, 737, 83
- Lutz et al. (2016) Lutz, D., Berta, S., Contursi, A., et al. 2016, A&A, 591, A136
- McBride et al. (2014) McBride, J., Quataert, E., Heiles, C., & Bauermeister, A. 2014, ApJ, 780, 182
- Messias et al. (2014) Messias, H., Dye, S., Nagar, N., et al. 2014, A&A, 568, A92
- Murphy (2009) Murphy, E. J. 2009, ApJ, 706, 482
- Oliver et al. (2012) Oliver, S. J., Bock, J., Altieri, B., et al. 2012, MNRAS, 424, 1614
- Oteo et al. (2016) Oteo, I., Zwaan, M. A., Ivison, R. J., Smail, I., & Biggs, A. D. 2016, arXiv:1607.06464
- Pope et al. (2006) Pope, A., Scott, D., Dickinson, M., et al. 2006, MNRAS, 370, 1185
- Riechers et al. (2013) Riechers, D. A., Bradford, C. M., Clements, D. L., et al. 2013, Nature, 496, 329
- Rieke et al. (2009) Rieke, G. H., Alonso-Herrero, A., Weiner, B. J., et al. 2009, ApJ, 692, 556
- Silva et al. (1998) Silva, L., Granato, G. L., Bressan, A., & Danese, L. 1998, ApJ, 509, 103
- Simpson et al. (2014) Simpson, J. M., Swinbank, A. M., Smail, I., et al. 2014, ApJ, 788, 125
- Simpson et al. (2015a) Simpson, J. M., Smail, I., Swinbank, A. M., et al. 2015a, ApJ, 799, 81
- Simpson et al. (2015b) Simpson, J. M., Smail, I., Swinbank, A. M., et al. 2015b, ApJ, 807, 128
- Smail et al. (1997) Smail, I., Ivison, R. J., & Blain, A. W. 1997, ApJ, 490, L5
- Smail et al. (1999) Smail, I., Ivison, R. J., Kneib, J.-P., et al. 1999, MNRAS, 308, 1061
- Smolčić et al. (2012) Smolčić, V., Aravena, M., Navarrete, F., et al. 2012, A&A, 548, A4
- Smolčić et al. (2015) Smolčić, V., Karim, A., Miettinen, O., et al. 2015, A&A, 576, A127
- Straatman et al. (2015) Straatman, C. M. S., Labbé, I., Spitler, L. R., et al. 2015, ApJ, 808, L29
- Strandet et al. (2016) Strandet, M. L., Weiss, A., Vieira, J. D., et al. 2016, ApJ, 822, 80
- Swinbank et al. (2012) Swinbank, A. M., Karim, A., Smail, I., et al. 2012, MNRAS, 427, 1066
- Swinbank et al. (2014) Swinbank, A. M., Simpson, J. M., Smail, I., et al. 2014, MNRAS, 438, 1267
- Toft et al. (2014) Toft, S., Smolčić, V., Magnelli, B., et al. 2014, ApJ, 782, 68
- Vieira et al. (2013) Vieira, J. D., Marrone, D. P., Chapman, S. C., et al. 2013, Nature, 495, 344
- Walter et al. (2012) Walter, F., Decarli, R., Carilli, C., et al. 2012, Nature, 486, 233
- Wang et al. (2009) Wang, W.-H., Barger, A. J., & Cowie, L. L. 2009, ApJ, 690, 319
- Wardlow et al. (2011) Wardlow, J. L., Smail, I., Coppin, K. E. K., et al. 2011, MNRAS, 415, 1479
- Wardlow et al. (2013) Wardlow, J. L., Cooray, A., De Bernardis, F., et al. 2013, ApJ, 762, 59
- Weiß et al. (2009) Weiß, A., Ivison, R. J., Downes, D., et al. 2009, ApJ, 705, L45
- Weiß et al. (2013) Weiß, A., De Breuck, C., Marrone, D. P., et al. 2013, ApJ, 767, 88
- Younger et al. (2007) Younger, J. D., Fazio, G. G., Huang, J.-S., et al. 2007, ApJ, 671, 1531
- Younger et al. (2009) Younger, J. D., Fazio, G. G., Huang, J.-S., et al. 2009, ApJ, 704, 803
- Yun et al. (2001) Yun, M. S., Reddy, N. A., & Condon, J. J. 2001, ApJ, 554, 803
- Yun et al. (2012) Yun, M. S., Scott, K. S., Guo, Y., et al. 2012, MNRAS, 420, 957
- Zhang et al. (2016) Zhang, Z.-Y., Papadopoulos, P. P., Ivison, R. J., et al. 2016, Royal Society Open Science, 3, 160025