Atmospheric Constraints on the Surface UV Environment of Mars at 3.9 Ga Relevant to Prebiotic Chemistry
Abstract
Recent findings suggest Mars may have been a clement environment for the emergence of life, and may even have compared favorably to Earth in this regard. These findings have revived interest in the hypothesis that prebiotically important molecules or even nascent life may have formed on Mars and been transferred to Earth. UV light plays a key role in prebiotic chemistry. Characterizing the early Martian surface UV environment is key to understanding how Mars compares to Earth as a venue for prebiotic chemistry.
Here, we present two-stream multi-layer calculations of the UV surface radiance on Mars at 3.9 Ga, to constrain the surface UV environment as a function of atmospheric state. We explore a wide range of atmospheric pressures, temperatures and compositions, corresponding to the diversity of Martian atmospheric states consistent with available constraints. We include the effects of clouds and dust. We calculate dose rates to quantify the effect of different atmospheric states on UV-sensitive prebiotic chemistry.
We find that for normative clear-sky CO2-H2O atmospheres, the UV environment on young Mars is comparable to young Earth. This similarity is robust to moderate cloud cover: thick clouds () are required to significantly affect the Martian UV environment, because cloud absorption is degenerate with atmospheric CO2. On the other hand, absorption from SO2, H2S, and dust is nondegenerate with CO2, meaning if these constituents build up to significant levels, surface UV fluence can be suppressed. These absorbers have spectrally variable absorption, meaning that their presence affects prebiotic pathways in different ways. In particular, high SO2 environments may admit UV fluence that favors pathways conducive to abiogenesis over pathways unfavorable to it. However, better measurements of the spectral quantum yields of these pathways are required to evaluate this hypothesis definitively.
1 Introduction
Recent findings suggest that young Mars may have been a clement environment for the emergence of life. Analysis of Curiosity imaging of sedimentary rock strata deposited 3.2-3.6 Ga (Grotzinger et al., 2015) suggest individual lakes were stable on ancient Mars for 100-10,000 years, with fluvial features laid down over 10,000-10 million years assuming formation rates corresponding to modern Earth. Similarly, Curiosity measurements of olivine and magnetite at Yellowknife crater are consistent with aqueous conditions at near-neutral pH for thousands to hundreds of thousands of years in the Noachian, with an oxidant supply that could be an energy source (Bristow et al., 2015). In general, the geologic evidence is compelling that liquid water, a requirement for life as we know it, was present on Mars at least transiently in the Noachian (Wordsworth, 2016).
The young Mars may also have been a favorable environment for prebiotic chemistry (chemistry relevant to the origin of life). Meteorite analysis has detected boron in Martian clays, important for abiogenesis since borate minerals can stabilize ribose and catalyze other prebiotic chemistry reactions (see Stephenson et al. 2013 and sources therein). Mars may also have enjoyed greater availability of prebiotically important phosphate than Earth (Adcock et al., 2013). Climate models suggest liquid water was transient on Mars (Wordsworth et al., 2013), which suggests the evidence of wet/dry cycles. Such cycles are useful for prebiotic chemistry: aqueous eras are beneficial for the formation of biotic monomers, while dry eras tend to concentrate feedstock molecules and aid monomer polymerization (Benner et al., 2015), relevant to the formation of nucleotides and amino acids (Patel et al., 2015). Finally, the putative dryness of Mars and the potential acidity of its early aqueous environment owing to dissolved carbonic acid from a CO2-dominated atmosphere, suggest molybdate, which is suggested to catalyze formation of prebiotically important sugars such as ribose, may have been stable on Mars (Benner et al., 2015, 2010). Hence, there is growing interest in the possibility that prebiotically important molecules may have been produced on Mars (Benner, 2013), and even the hypothesis that life may have originated on Mars and been seeded to Earth (Kirschvink and Weiss, 2002; Gollihar et al., 2014; Benner et al., 2015).
Ultraviolet (UV) light plays a key role in prebiotic chemistry. UV photons can dissociate molecular bonds, produce ionic species, and excite molecules. These properties mean that UV light can stress prebiotic molecules (Sagan, 1973), but also that UV light can power synthetic prebiotic photochemistry. UV light has been invoked in prebiotic chemistry as diverse as the origin of chirality (Rosenberg et al., 2008), the synthesis of amino acid precursors (Sarker et al., 2013), and the polymerization of RNA (Mulkidjanian et al., 2003).
The last decade has seen breakthroughs in long-standing problems in prebiotic chemistry such as the discovery of plausible mechanisms for the abiotic formation of activated pyrimidine ribonucleotides (Powner et al., 2009), the synthesis of short (2- and 3-carbon) sugars (Ritson and Sutherland, 2012), and a reaction network generating precursors for a range of prebiotically important molecules including lipids, amino acids, and ribonucleotides (Patel et al., 2015). These pathways all require UV light to function. In experiments, line sources such as low-pressure mercury lamps with monochromatic 254 nm emission are often used to simulate the incident UV radiation. However, prebiotic UV radiance in CO2-dominated terrestrial-type atmospheres should instead be characterized by access to broadband fluence (Ranjan and Sasselov, 2017). The difference can have a significant impact on prebiotic chemistry (Ranjan and Sasselov, 2016), and there is a growing awareness in the prebiotic community of the importance of characterizing the wavelength dependence of proposed prebiotic pathways and/or using broadband sources in simulations (Rapf and Vaida, 2016). Consequently, it is important to constrain the UV environment on the surface of Mars at epochs relevant to potential prebiotic chemistry on a spectral (wavelength-dependent) basis.
In this work, we use a two-stream multilayer radiative transfer model to constrain the surface UV environment on young Mars (3.9 Ga). We calculate the surface radiance as a function of solar zenith angle (SZA), surface albedo (), and atmospheric composition. Our model can calculate absorption and scattering due to 8 gaseous species (CO2, H2O, CH4, SO2, H2S, O2, and O3) and 3 particulate species (H2O ice, CO2 ice, and Martian dust). Earlier analyses have focused on clear-sky ”case studies” for the atmospheric composition; we instead explore the full range of Martian atmospheric states consistent with available geological data and climate/photochemical modelling for the Martian atmosphere. We convolve the calculated surface radiance spectra against action spectra corresponding to two different simple photochemical reactions (one useful to prebiotic chemistry, and one detrimental) that may have been important during the era of abiogenesis, and integrate the result to compute the biologically effective dose rate (BED) and estimate the impact of these parameters on prebiotic chemistry.
In Section 2, we discuss previous work on this topic. In Section 3, we describe our radiative transfer model and its inputs and assumptions. Section 4 presents the surface radiances calculated from our model as a function of Martian atmospheric state, and Section 5 discusses the implications for prebiotic chemistry. Section 6 summarizes our findings.
2 Background
Recognizing the importance of UV light to life (though mostly in the context of a stressor), previous workers have placed constraints on the primitive Martian surface UV environment. In this section, we present a review of previous work on this topic, and discuss how our work differs from them.
Cockell (2000) calculate the Martian surface flux at 3.5 Ga assuming solar input of modern, and an atmosphere composed of 1 bar CO2 and 0.1 bar N2. They compute their radiative transfer in a cloud-free atmosphere using a monolayer two-stream approximation with Delta-Eddington closure. They ignore water absorption, but a dust optical depth of 0.1 is assumed, as is a Lambertian surface with surface albedo . Cockell (2000) report the total irradiance as a function of solar time (equator at equinox) as well as the biologically-weighted111A measure of reaction rate; see Section 3.4 irradiance for DNA inactivation and photosystem damage, but not the spectral irradiance (for the early Mars case). They find the DNA inactivation-weighted irradiance to be comparable for their models of Early Mars and Early Earth, leading them to suggest that from a UV perspective the two worlds were comparably habitable.
Rontó et al. (2003) calculate the Martian surface flux at 3.5 Ga from 200-400 nm. They assume a 1-bar CO2 atmosphere overlying volatilizable surface H2O, and ran it through the PHOEBE photochemical model to generate atmospheric profiles for the other molecules that would be generated. They found a significant population of spectrally absorbing O2, O3, and NO2 would be generated, including an ozone shield comparable to the modern Earth. They evaluated radiative transfer for both a pure CO2 atmosphere, as well as for an atmosphere with the trace species calculated in their photochemical model. Their UV radiative transfer models assumes pure absorption and ignores scattering. In this formulation, Rontó et al. (2003) calculated Rayleigh scattering cross-sections but treated them as absorption cross-sections. This approach strongly overestimates attenuation at scattering wavelengths. It is consequently unsurprising that Rontó et al. (2003) report strong attenuation of surface UV fluence for both model atmosphere cases. in the full photochemical model case, fluence shortward of 290 nm is completely removed, due to the buildup of an ozone layer from CO2 photolysis. However, Segura et al. (2007) note that this photochemical model neglects supply of reducing gases to the atmosphere due to volcanism and sinks of oxic gases due to processes involving rainout, and including either of these effects prevents the formation of an ozone layer. Geological evidence (e.g. the Tharsis plateau) indicates that young Mars had significant volcanism, which would have prevented formation of an ozone layer of the type calculated by Rontó et al. (2003).
Cnossen et al. (2007) calculate the Martian surface flux from Ga assuming a 5-bar CO2, 0.8 bar N2 clear-sky atmosphere. They used shortwave observations of the solar analog ceti combined with a scaled solar spectrum at longer wavelengths as their top-of-atmosphere (TOA) solar input. To calculate radiative transfer, they partition the atmosphere into 40 layers. They compute absorption using the Beer-Lambert law. To account for scattering, they compute the flux scattered in each layer, assume half of it proceeds downwards and half of it proceeds upwards, and iterate this process to the surface. This approach implicitly neglects multiple scattering and assumes a surface albedo of , and hence tends to overestimate atmospheric attenuation of incoming radiation. Hence, Cnossen et al. (2007) report broadband suppression of the TOA flux by multiple orders of magnitude.
Our work builds on these previous efforts. Like Cockell (2000), Rontó et al. (2003), and Cnossen et al. (2007), we consider the effects of a denser CO2 atmosphere; however, we consider a broader range of surface atmospheric pressures permitted by available constraints, ranging from bar. We build on Cockell (2000)’s use of a monolayer two-stream approach to radiative transfer by using a multiple-layer two stream model, which consequently accounts for the effects of multiple scattering. Such a treatment is essential because of the unique radiative transfer regime unveiled in thick anoxic atmospheres (e.g. multibar CO2 atmospheres) at UV wavelengths, characterized by the atmosphere being simultaneously optically thick and scattering-dominated. In this regime, multiple-scattering dominates and it is critical to account for its effects in order to accurately compute surface radiation environments. As a corollary, the radiative transfer treatments of Rontó et al. (2003) and Cnossen et al. (2007) are not valid in this regime222This regime is not available on the modern Earth or Mars, due to oxic absorption in the former and a thin atmosphere in the latter..
In addition to varying levels of CO2, our work also explores the impact of other potential atmospheric constituents on the surface UV environment. In particular, we focus on the effect of enhanced concentrations of volcanogenic gases (e.g., SO2, H2S), which may have been present at elevated levels on the young Mars (Halevy et al., 2007; Halevy and Head, 2014) and if present could have had a dramatic effect on the surface fluence (Ranjan and Sasselov, 2017). We also explore the radiative impact of varying levels of dust and CO2 and H2O clouds in the Martian atmosphere, which may have been abundant (Wordsworth et al., 2013; Halevy and Head, 2014). Finally, previous workers reported the surface flux. However, as pointed out by other workers, while the flux is the relevant quantity when computing energy deposition, when computing molecular reaction rates the spherically integrated intensity, or actinic flux, is the more relevant quantity (Madronich, 1987; Kylling et al., 1995). For a particle lying at the planet surface, fluence below the horizon is blocked by the surface. Therefore, we report instead the integral of the intensity field at the planet surface over the hemisphere defined by elevations (i.e. that part of the sky not blocked by the planet surface). We term this quantity the surface radiance. For more details, see Ranjan and Sasselov (2017).
3 Methods
In this section, we describe the methods used to calculate the surface UV environment of early Mars. All software associated with this project is available for validation and extension at https://github.com/sukritranjan/ranjanwordsworthsasselov2016.
3.1 Radiative Transfer Model
We use a multilayer two-stream approximation to compute the 1D radiative transfer of UV light through the early Martian atmosphere. Our code is based on the radiative transfer model of Ranjan and Sasselov (2017). In brief, we follow the two-stream treatment of Toon et al. (1989), and we use Gaussian (single) quadrature to connect the diffuse intensity to the diffuse flux, since Toon et al. (1989) find Gaussian quadrature closure to be more reliable than Eddington or hemispheric mean closure at short (solar) wavelengths. We include absorption and scattering due to N2, CO2, H2O, CH4, O2, O3, SO2, and H2S. For reasons of numerical stability, we assign a ceiling on the per-layer single-scattering albedo of . In Ranjan and Sasselov (2017), we included thermal emission from the atmosphere and surface, to enable application of our code to situations where planetary UV emission might be important. Early Mars is not such a case, so here we omit these features.
Our model requires the user to specify the partition of the atmosphere into homogenous layers, and to provide the temperature, pressure, and composition (gaseous molar concentrations) as a function of altitude. Section 3.2 describes our calculation of these quantities. Our model also requires the user to specify the wavelength bins over which the radiative transfer is to be computed; all spectral parameters are integrated over these wavelength bins using linear interpolation in conjunction with numerical quadrature. The user also must specify the solar zenith angle (SZA) and albedo. The albedo may be specified as either a fixed value (e.g. Rugheimer et al. 2015), or as a wavelength- and SZA-dependent user-determined mix of the albedos corresponding to different terrestrial physical surface media (new snow, old snow, desert, tundra, ocean).
We take the top-of-atmosphere (TOA) flux to be the solar flux at 3.9 Ga, computed at 0.1 nm resolution from the model of Claire et al. (2012) and scaled to the Martian semimajor axis of 1.524 AU. We choose 3.9 Ga for the prebiotically-relevant era 1) because of evidence for at least transient liquid water on Mars around this time (Bristow et al., 2015; Grotzinger et al., 2015; Wordsworth, 2016), 2) it postdates the potentially-sterilizing Late Heavy Bombardment (Maher and Stevenson, 1988; Sleep et al., 1989), and 3) it predates the bulk of the evidence for the earliest terrestrial life (see Ranjan and Sasselov 2016 and sources therein). If one hypothesizes terrestrial abiogenesis was aided by transfer of prebiotically relevant compounds from Mars (Benner, 2013; Gollihar et al., 2014; Benner et al., 2015), then the synthesis of these molecules and their transfer must have occurred concomitantly with the origin of life on Earth. We note that, unlike the XUV, solar output varies only modestly (within a factor of 2) from 3.5-4.1 Ga in the nm wavelength range unshielded by atmospheric CO2 or H2O. Therefore, our results are insensitive to the precise choice of epoch for abiogenesis.
In Ranjan and Sasselov (2017), we did not include scattering and absorption due to atmospheric particulates. However, clouds have been suggested to play a major role in Martian paleoclimate (Forget and Pierrehumbert, 1997; Colaprete and Toon, 2003; Wordsworth et al., 2013). Therefore, we updated our model to allow the user to emplace CO2 and H2O cloud decks of user-specified optical depth (at 500 nm) in the atmosphere. The cloud decks are assumed to uniformly span the atmospheric layers into which they are emplaced. Section 3.3 discusses the calculation of the particulate optical parameters (per-particle cross-section , asymmetry parameter , and ). We use delta-scaling with Henyey-Greenstein closure (Joseph et al., 1976) to correct for the effects of highly forward-peaked particulate scattering phase functions.
The fundamental output of our code is the surface radiance as a function of wavelength. The surface radiance is the integral of the intensity field at the planet surface over the unit hemisphere defined by elevations greater than zero, i.e. the intensity field integrated over all parts of the sky not blocked by the planet surface. As we argue in Ranjan and Sasselov (2017), this is the relevant quantity for calculating reaction rates of molecules at planet surfaces (as compared to the actinic fluxes for molecules suspended in the atmosphere, see Madronich 1987). In the two-stream formalism, this quantity is
where is the downward diffuse flux at the planet surface, is the direct flux at the planet surface, and is the cosine of the solar zenith angle. In Gaussian quadrature for the (two-stream) case, (Toon et al., 1989); it can be interpreted as the effective zenith angle for the diffuse flux.
3.2 Atmospheric Profile
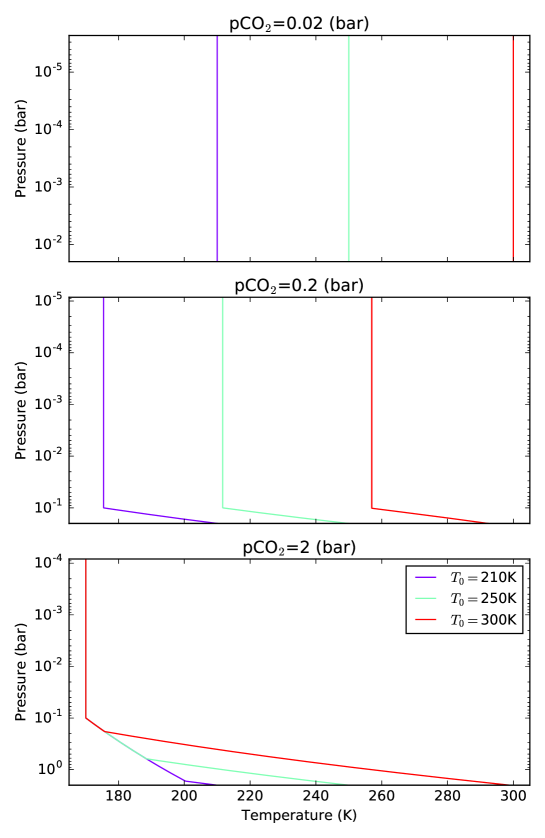
We assume a CO2-dominated Martian atmosphere at 3.9 Ga. We take the atmosphere to be fully saturated with H2O. Typical calculations of Noachian climate call for steady-state local surface temperatures of K across the planetary surface, and more typically K (Forget et al., 2013; Wordsworth et al., 2013).Both one- and three-dimensional calculations of Noachian climate produce global mean surface temperatures of 240 K or less (Forget et al., 2013; Wordsworth et al., 2013; Ramirez et al., 2014). At such cold temperatures, the H2O saturation pressure is very low, and H2O is a trace gas in the atmosphere. Therefore, we approximate the thermodynamic properties of the Martian atmosphere by the thermodynamic properties of CO2. We take and , where and are the heat capacity at constant pressure and the specific gas constant respectively. We assume the heat capacity to be constant, with , where is the surface temperature. We calculate from the Shomate relation, taking the coefficients from Pierrehumbert (2010, page 115). We tested the effects of permitting the heat capacity to vary with temperature, and found minimal impact on our results.
Martian paleoclimate models have been propose that invoke effects like enhanced volcanism (Halevy and Head, 2014) and high H2 abundance (Ramirez et al., 2014) to argue for global mean temperatures in excess of 273K. However, these models also require pCO2 in excess of 1 bar, meaning that H2O remains a trace atmospheric constituent. Regardless, our results are insensitive to the precise thermal properties of the atmosphere because of the modest variation of the absorption cross-sections of the gases in our model with temperature at UV wavelengths.
For a given surface pressure, surface temperature (, ), we let the temperature decrease as a dry adiabat until it reaches the CO2 saturation temperature, at which point it follows the CO2 saturation curve. We use the empirical saturation curve of Fanale et al. (1982), as in Wordsworth et al. (2013). To avoid the need for a full radiative-convective climate model, which is tangential to our objectives in this paper, we assume a stratosphere starting at 0.1 bar, following the observation of Robinson and Catling (2014) that atmospheres dominated by triatomic gases tend to become optically thin and hence radiatively dominated around that pressure. We follow other workers (e.g. Kasting 1991; Hu et al. 2012; Halevy and Head 2014) assuming the stratosphere to be isothermal; we conduct sensitivity studies demonstrating our results are not sensitive to this assumption.
To calculate the H2O saturation pressure, we use the empirical formulation of Wagner et al. (1994) via Wagner and Pruß (2002) for the vapor pressure of water overlying a solid reservoir (as would be the case for K). We assume the atmosphere to be fully saturated in H2O until the tropopause, and we assumed the molar concentration of water in the stratosphere to be equal to its concentration at the tropopause throughout.
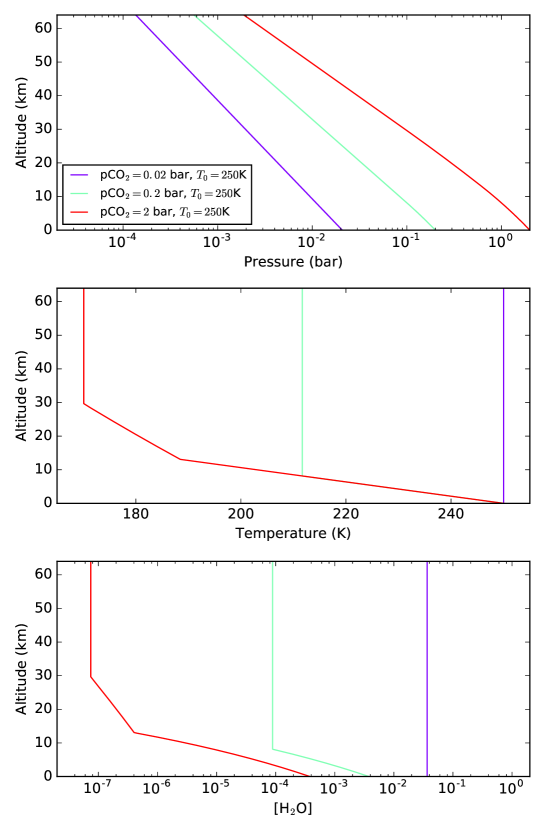
Our model requires temperature, pressure, and molar concentrations as functions of altitude. To obtain a mapping between pressure and altitude, we approximate the atmosphere as a series of 1000 layers, each individually isothermal, evenly spanning . We then use the equation for an isothermal atmosphere in hydrostatic equilibrium,
to calculate the change in altitude across each pressure layer, and sum to obtain a mapping between and . Here, is pressure, is the altitude of the layer top, is the altitude of the layer bottom, and is the scale height of the layer, with being the layer temperature, the mean molecular weight of the atmospheric layer, and the acceleration due to Martian gravity. We also considered numerically integrating the hydrostatic equilibrium equation,
where the density for an ideal gas, directly to obtain . We found this approach to agree within 1%; we consequently elected to use the simpler isothermal partition approach for our calculation. Appendix A presents sample atmospheric profiles derived using our methods.
3.3 Particulate Optical Parameters
In this section, we discuss our calculation of the optical parameters (, , and ) associated with interaction of radiation with the CO2 and H2O ice particles that constitute clouds.
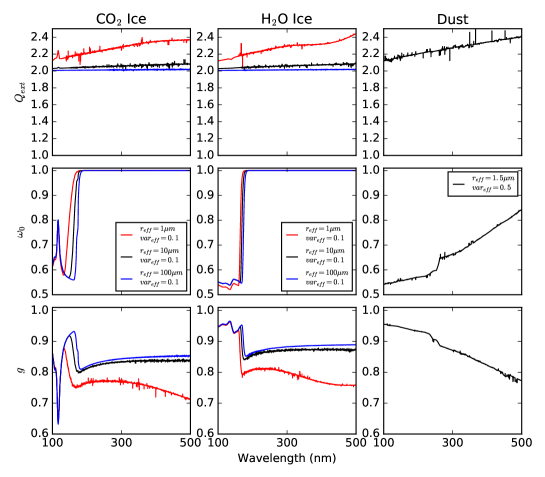
We approximate the particles as spherical, and compute their optical parameters using Mie theory at 0.1 nm resolution, following the treatment outlined in Hansen and Travis (1974). At each wavelength, we compute , , and the scattering efficiency . We numerically integrate these parameters over a log normal size distribution with effective radius and effective variance , weighted by , where is the particle radius and n(r) is the size distribution, and demand a precision of 1% in the distribution-averaged mean values. We obtain the per-particle total extinction cross-section by
where is the distribution-averaged mean value of , is the distribution-averaged mean value of , and
is the ”geometric cross-sectional area of particles per unit volume” (Hansen and Travis, 1974) computed at 1 ppm precision. For our numerical integral, we integrated from to ; we found beyond these limits.
We take the index of refraction for H2O ice from the compendium of Warren and Brandt (2008) 333accessed via http://www.atmos.washington.edu/ice_optical_constants. We take the index of refraction for CO2 ice from the compendium given in Pierrehumbert (2010)444accessed via http://geosci.uchicago.edu/~rtp1/PrinciplesPlanetaryClimate/Data/WorkbookDatasets/Chapter5Data/co2i4a.rfi.txt. This compendium was formed by G. Hansen by subjecting the absorption spectra of Hansen (1997) and Hansen (2005) to Kramers-Kronig analysis to obtain self-consistent spectra of real and imaginary indices of refraction (S. Warren, private communication). We take the index of refraction for Martian dust from Wolff et al. (2009) 555accessed via http://spacescience.arc.nasa.gov/mars-climate-modeling-group/documents/Dust_Refractive_Indicies.txt. The data of Wolff et al. (2009) truncate at 263 nm. Measurements of the imaginary index of refraction down to 194 nm are available from Pang and Ajello (1977). We adopt the values of Pang and Ajello (1977) for wavelengths nm. Zurek (1978) present a compendia of the real index of refraction of Martian dust. Their study indicates that the index of refraction changes by only from nm. Their values at 263 nm are 0.4 higher than Wolff et al. (2009); to avoid a discontinuity, we subtract 0.4 from the real indices of refraction of Zurek (1978).
Figure 1 presents the CO2 and H2O ice optical parameters as a function of wavelength for size distributions with and microns. Previous work has assumed CO2 cloud particle sizes to be in the 1-100 m range (e.g., Forget and Pierrehumbert 1997). Microphysical modelling by Colaprete and Toon (2003) suggests that primitive Martian CO2 clouds may have been characterized by large particle sizes, as high as m. The optical properties of CO2 and H2O ice particles for m insensitive to ; we attribute this to size parameter being large in this regime, meaning such particles approach the large-particle limit. ( for m and nm). For wavelengths satisfying nm, CO2 and H2O ice are characterized by . This means that CO2 and H2O clouds do not significantly absorb at wavelengths unshielded by H2O ( nm) or CO2 ( nm). By contrast, dust absorbs across nm, meaning dust particles can supply absorption at wavelengths not shielded by CO2 or H2O.
3.4 Action Spectra and Calculation of Dose Rates
To quantify the impact of different surface UV radiation environments on prebiotic chemistry, we follow the approach of Cockell (1999), Rontó et al. (2003), and Rugheimer et al. (2015) in computing Biologically Effective Dose rates (BEDs). Specifically, we compute
where is an action spectrum, and are the limits over which is defined, and is the UV surface radiance. An action spectrum parametrizes the relative impact of radiation on a given photoprocess as a function of wavelength, with a higher value of meaning that a higher fraction of the incident photons are being used in the photoprocess. Hence, is proportional to the reaction rate rate of a given photoprocess for a single molecule at the surface of a planet.
As is a relative measure of reaction rate, a normalization is required to assign a physical interpretation to its value. In this paper, we report
where is the dose rate on 3.9 Ga Earth. The atmospheric model for 3.9 Ga Earth is taken from Rugheimer et al. (2015), who use a 1D coupled climate-photochemistry model to compute the atmospheric profile (T, P, composition) for the Earth at 3.9 Ga, assuming modern abiotic outgassing rates and a background atmosphere of 0.9 bar N2, 0.1 bar CO2, with SZA= and . Consequently, means that the photoprocess is proceeding faster on the Martian surface under the specified atmosphere than it would on the surface of the Rugheimer et al. (2015) fiducial Earth. Note this normalization is different from what we chose in Ranjan and Sasselov (2017), because here we are trying to assess how Mars compares to the Earth as a venue for prebiotic chemistry.
Previous workers used action spectra of UV stress on modern biology (e.g. the DNA inactivation action spectrum) (Cockell, 2000, 2002; Cnossen et al., 2007; Rugheimer et al., 2015) as a gauge of the level of stress imposed by UV fluence on the prebiotic environment. However, these action spectra are based on modern life. Modern organisms have evolved sophisticated methods to deal with environmental stress, including UV exposure, that would not have been available to the first life. Further, this approach presupposes that UV light is solely a stressor, and ignores its potential role as a eustressor for abiogenesis. In this work, we follow the reasoning of our previous efforts in Ranjan and Sasselov (2017) in formulating action spectra corresponding to simple photoreactions that are expected to have played major roles in prebiotic chemistry. We consider two reactions: a stressor process, to capture the stress UV light places on nascent biology, and an eustressor process, to capture the role of UV light in promoting prebiotic chemistry. A detailed description of these processes and their corresponding action spectra is given in Ranjan and Sasselov (2017); a brief outline is presented below.
3.4.1 Stressor Process: Cleavage of N-Glycosidic Bond of UMP
For our stressor process, we chose the cleavage of the N-glycosidic bond in the RNA monomer uridine monophospate (UMP). UV radiation can cleave the N-glyocosidic bond which joins the sugar to the nucleobase (Gurzadyan and Görner, 1994), irreversibly destroying this molecule. Hence, this process represents a stressor to abiogenesis.
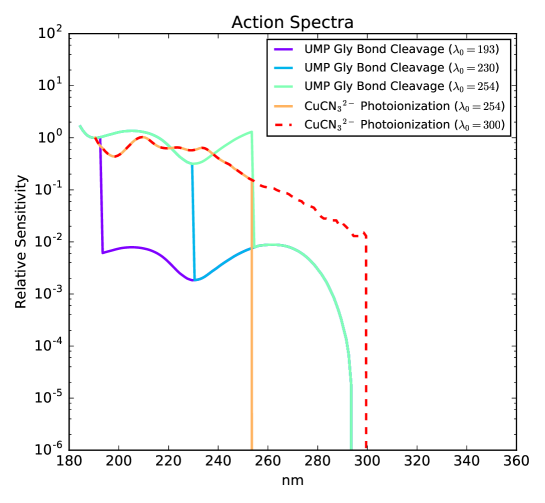
The action spectrum is equal to the product of the absorption spectrum (fraction of incident photons absorbed) and the quantum yield curve (QY, fraction of absorbed photons that lead to the photoreaction). We take our UMP absorption spectrum from the work of (Voet et al., 1963) (pH=7.6). Detailed spectral measurements of the QY of glyocosidic bond cleavage have not been obtained. However, Gurzadyan and Görner (1994) found the QY of N-glycosidic bond cleavage in UMP in neutral aqueous solution saturated with Ar (i.e. anoxic) to be at 193 nm and for 254 nm. We therefore represent the QY curve as a step function with value for and for . We consider values of 193 and 254 nm, corresponding to the empirical limits from Gurzadyan and Görner (1994). We also consider nm, which corresponds to the end of the broad absorption feature centered near 260 nm corresponding to the transition and also to the transition to irreversible decomposition suggested by Sinsheimer and Hastings (1949). As shorthand, we refer to this photoprocess under the assumption that X nm by UMP-X. Figure 2 presents these action spectra.
The absorption spectra of the other RNA monomers are structurally similar to UMP (Voet et al., 1963), and the quantum yield of N-glycosidic bond cleavage in adenosine monophospate (AMP) increases at short wavelengths like UMP’s does (Gurzadyan and Görner, 1994), leading us to argue that action spectra for N-glycosidic bond cleavage of the other RNA monomers should be broadly similar to that for UMP. Therefore, results derived using the action spectrum for UMP N-glycosidic bond cleavage should be broadly applicable to the other RNA monomers: if a UV environment is destructive for UMP, it should be bad for the other RNA monomers, and hence for abiogenesis in the RNA world hypothesis, as well.
3.4.2 Eustressor Process: Production of Aquated Electrons from Photoionization of Cyanocuprate
For our eustressor process, we choose the production of aquated electrons from the irradiation of a tricyanocuprate (CuCN) complex. We chose this process because it underlies the selective 2- and 3-carbon sugar (glycolaldehyde and glyceraldehyde) synthesis pathway of Ritson and Sutherland (2012), which is the best candidate proposed so far for a selective prebiotic synthesis of these sugars. These sugars are required for the synthesis of RNA, and hence abiogenesis in the RNA world hypothesis. This process is also important to the prebiotic reaction network of Patel et al. (2015). More generally, aquated electrons are useful for a broad range of reductive prebiotic chemistry, e.g., the reduction of nitriles to amines, aldehydes to hydroxyls, and hydroxyls to alkyls666J. Szostak, private communication, 2/5/16. Therefore, this process represents a eustressor to abiogenesis. While other UV-sensitive processes conducive to abiogenesis doubtless exist, we argue this process is of particular interest because of its unique role in the most promising plausibly prebiotic pathways to the RNA monomers.
We again form the action spectrum by multiplying the absorption spectrum and the quantum yield curve. We take the cyanocuprate absorption spectrum from the work of Magnani (2015), via Ranjan and Sasselov (2016). The spectral QY of aquated electron production from cyanocuprate irradiation is not known. However, Horváth et al. (1984) measure a QY of 0.06 for this process at 254 nm. Following Ritson and Sutherland (2012)’s hypothesis that photoionization of the complex drives aquated electron production, we assume the QY to be characterized by a step function with value for and otherwise. We empirically know nm. To explore a range of , we consider nm and nm. As shorthand, we refer to this photoprocess under the assumption that Y nm by CuCN3-Y. Figure 2 presents these action spectra.
Action spectra typically encode information about relative, not absolute, reaction rates. Consequently, they are generally arbitrarily normalized to 1 at some wavelength (see, e.g., Cockell 1999 and Rugheimer et al. 2015). We normalize these spectra to 1 at 190 nm.
4 Results
4.1 Clear-Sky H2O-CO2 Atmospheres
We evaluated the UV surface radiance for a range of (pCO2 , ) for pure H2O-CO2 atmospheres in the clear-sky case (no clouds, dust or other particulates). We considered pCO bar, corresponding to the range of surface pressure for which Wordsworth et al. 2013 reported at least transient local temperatures above 273 K, and K. We took an SZA of , corresponding to noon at equatorial latitudes. We took the surface albedo to correspond to desert (diffuse albedo of 0.22); we adopted this albedo because 1) young Mars is thought to have been dry and desertlike in conventional climate models, and 2) the desert diffuse albedo corresponds roughly to modern Mars’s surface albedo (e.g., Kasting 1991). We note that variations in surface albedo and SZA can drive variations in the spectral surface radiance of up to a factor of , and overall variations in prebiotically-relevant reaction rates of a factor of (Ranjan and Sasselov, 2017). These surface radiances are shown in Figure 3.
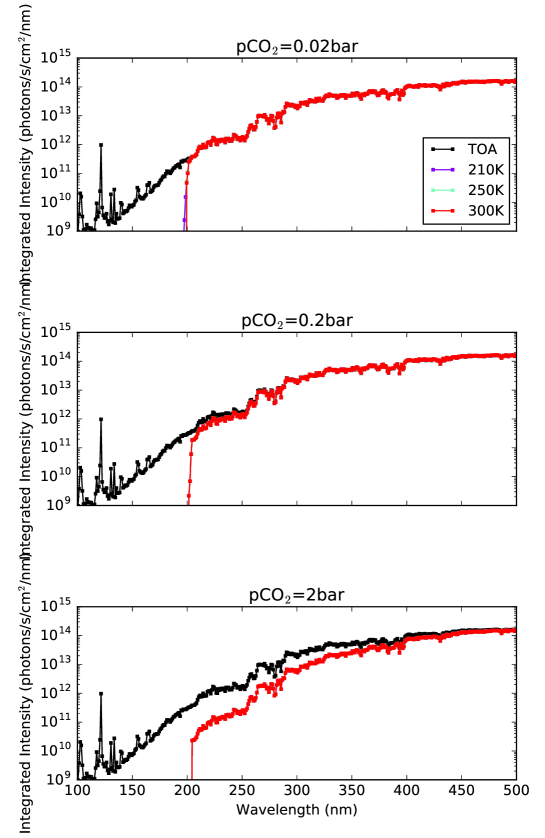
In the scattering regime ( nm), our surface radiances fall off only slowly with pCO2. This is a consequence of random walk statistics in the context of multiple scattering: transmission through purely scattering media go as (see, e.g., Bohren 1987 for a discussion with application to clouds). This result stands in contrast to the calculations of Cnossen et al. (2007) and Rontó et al. (2003), who ignore multiple scattering in their radiative transfer treatments, and illustrates the importance of self-consistently including this phenomenon when considering dense, highly scattering atmospheres.
We find our surface radiance calculations to be insensitive to . This is because 1) the total atmospheric column is set by and independent of , 2) the rapid increase of CO2 cross-sections for nm, which means that the the atmosphere rapidly becomes optically thick in the UV, and 3) increased water vapor abundance with increasing does not drive an increase in opacity because water vapor absorption is degenerate with CO2 absorption in the UV (Ranjan and Sasselov, 2017).
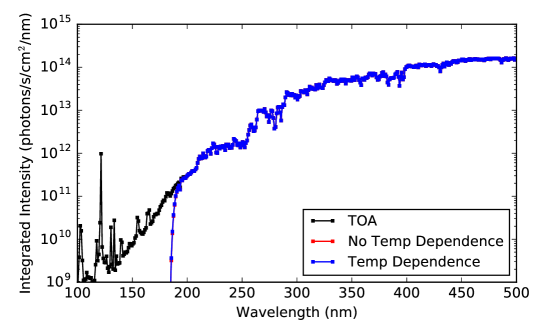
We considered the hypothesis that including the effect of variations in CO2 cross-section with temperature might impact our results. We followed the approach of Hu et al. (2012) in interpolating between cold ( K) and room-temperature datasets for CO2 absorption to estimate the effects of temperature dependence on CO2 cross-section. We used the dataset of Stark et al. (2007) from 106.5-118.7 nm, Yoshino et al. (1996) from 118.7-163 nm, and Parkinson et al. (2003) from 163-192.5 nm. We did not find cold-temperature cross-sections for CO2 at longer wavelengths. We found our results were not altered by including temperature-dependence of CO2 cross-sections for pCO bar, because the CO2 UV absorption is already saturated by 192.5 nm, where our temperature dependence kicks in. We considered lower values of pCO bar (below PAL), where the CO2 absorption does not saturate until wavelengths shorter than 192.5 nm. Even in the low pCO2 case, including temperature-dependence only changed the onsite of CO2 absorption saturation by nm. We attribute this to the rapidity of the rise in CO2 absorption cross section with decreasing wavelength for nm. We conclude that even including the effects of temperature on CO2 UV cross-section, the UV surface fluence is insensitive to . We consequently elected to ignore the temperature dependence of CO2 cross-sections in the remainder of this study.
Figure 4 presents the surface radiances in the pCO bar cases, calculated for SZA=0, corresponding to desert, and K, with and without CO2 cross-sections included. Such low atmospheric pressures have been suggested based on atmospheric escape arguments (Tian et al., 2009), followed by a buildup of the atmosphere after escape rates subsided with shortwave solar output. In such a case, aqueous prebiotic chemistry could only have proceeded in environments kept warm by non-climatological means, e.g. geothermal reservoirs. Even for such low pCO2, EUV fluence shortward of 185 nm is shielded out by atmospheric CO2.
4.2 Effect of CO2 and H2O Clouds
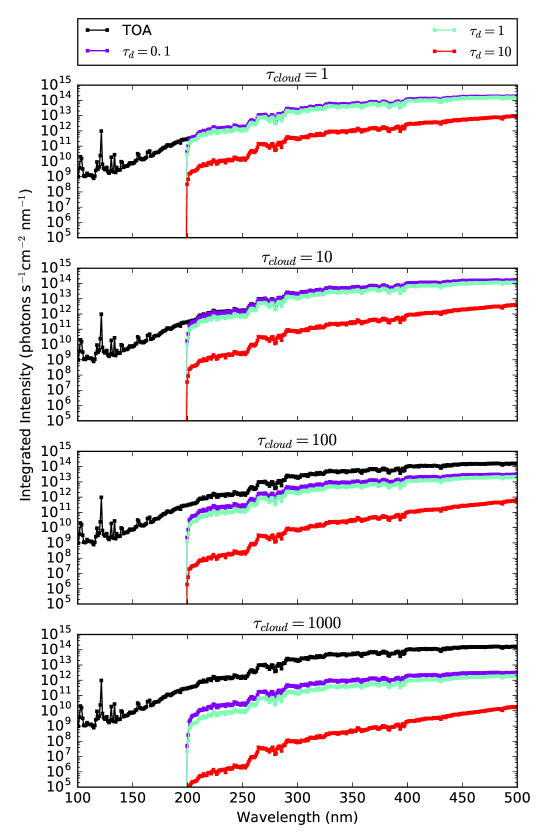
We considered the effect of CO2 and H2O clouds in a CO2-H2O atmosphere. Such clouds have been detected on modern Mars (see, e.g., Vincendon et al. 2011), and GCM results suggest they should have been present on early Mars as well(Wordsworth et al., 2013). Figure 5 presents the UV surface fluence for a 0.02-bar CO2-H2O atmosphere with H2O and CO2 cloud decks of varying optical depths emplaced in the atmosphere. This low surface pressure is chosen in order to isolate the effects of the clouds as opposed to atmospheric CO2. The surface albedo corresponds to desert, and SZA=0. The optical depths are specified at 500 nm. The H2O and CO2 cloud decks are emplaced from 3-4 km and 20-21 km of altitude, respectively, corresponding approximately to the altitudes of peak cloud formation identified in Wordsworth et al. (2013). For both types of clouds, we varied the cloud deck altitudes between 0.5-60.5 km, and found the surface fluence to be insensitive to the cloud deck altitude. We also experimented with partitioning the clouds into two decks, and found the surface fluence to be insensitive to the partition.
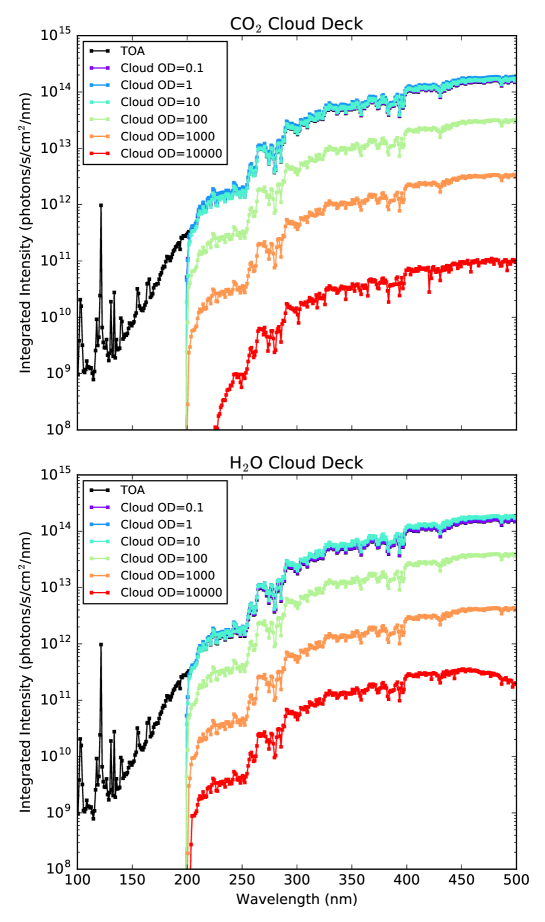
CO2 and H2O ice clouds have similar impact on the surface fluence. This is because both types of ice have similar optical parameters for nm and m. The nm regime, where they have different optical parameters, is shielded out by gaseous CO2 absorption.
CO2 and H2O ice particles are pure scatterers for nm and m. Consequently, it is unsurprising that surface fluence falls off only slowly with increasing optical depth. In fact, the transmission of a purely scattering cloud layer varies as , where is the delta-scaled optical depth of the cloud layer (Bohren, 1987). This is a consequence of the random-walk nature of radiative transfer in the optically-thick purely-scattering limit.
The particle size can have an impact on surface radiance. For m, the surface fluence at 500 nm is lower compared to m ( corresponding to desert, SZA=0). This is because as decreases in this regime, so does , meaning that the rescaled optical depth in the delta-scaling formalism is higher for small particles than large particles.
Suppressing surface radiance to or less of TOA flux requires cloud optical depths of . This is comparable to the optical depth of a terrestrial thunderstorm (Mayer et al., 1998). We can compute the mass column of ice particle required to achieve this optical depth by
where is the mass density of the ice, is the ice particle radius, is the cloud optical depth, and is the extinction efficiency. For CO2 ice, g/cm3 777http://terpconnect.umd.edu/~choi/MSDS/Airgas/CARBON%20DIOXIDE.pdf, m, and approximating , we find corresponds to kg/m2. Wordsworth et al. (2013) find in their 3D simulation CO2 ice columns of up to kg/m2 in patches, suggesting CO2 clouds may have significantly affected the surface UV environment. For water ice, taking g/cm3 (Miller, 2009), m, and approximating , we find corresponds to kg/m2. By contrast, Wordsworth et al. (2013) finds expected ice columns of kg/m2. Consequently, barring a mechanism which can increase the H2O cloud levels above that considered by Wordsworth et al. (2013), H2O ice clouds by themselves are unlikely to significantly alter the surface radiance environment on early Mars.
4.3 Effect of Elevated Levels of Volcanogenic Gases
So far, we have considered pure CO2-H2O atmospheres. However, other gases may have been present in the early Martian atmosphere. In particular, Mars at Ga was characterized by volcanic activity, which emplaced features like the Tharsis igneous province (Halevy and Head, 2014). Such volcanism could have injected elevated levels of volcanogenic gases like SO2 and H2S into the atmosphere. SO2 and H2S are also strong and broad UV absorbers, and at elevated levels they can completely reshape the surface UV environment (Ranjan and Sasselov, 2017). Consequently, we consider the impact of elevated levels of SO2 and H2S on the surface UV environment.
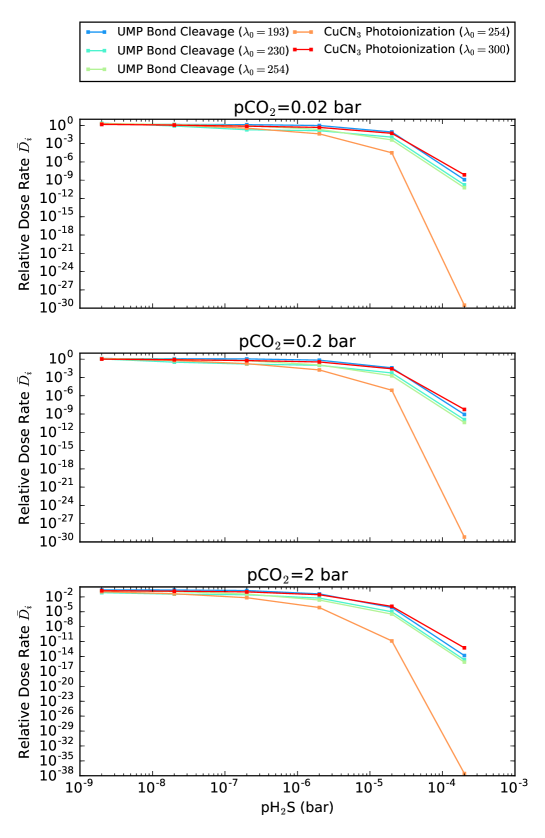
We consider SO2 levels up to bar. For scale, Halevy and Head (2014) compute that an SO2 level of bar in a 1 bar CO2-dominated atmosphere requires volcanic outgassing at the current terrestrial outgassing. Figure 6 presents the surface radiance for varying pSO2 and pCO bar (SZA=0, corresponding to desert, and K).
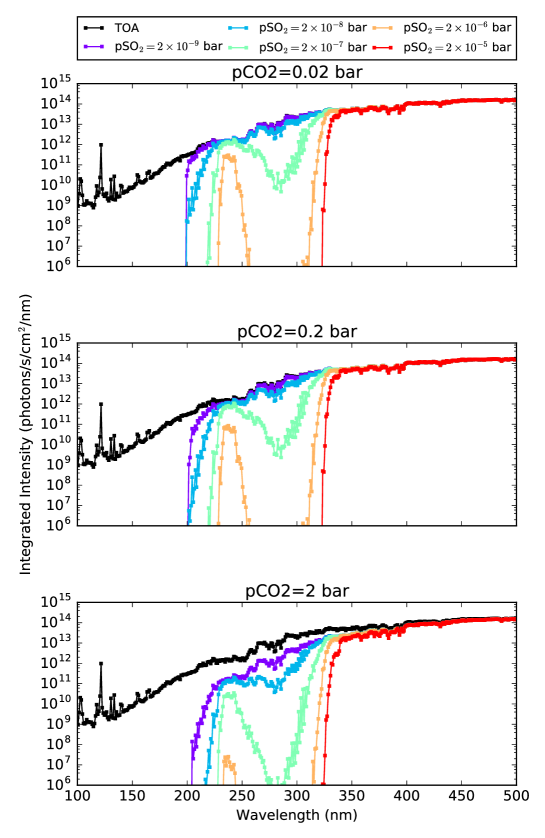
Note that for the same pSO2, the surface radiance varies as a function of pCO2. This is because at high pCO2, the scattering optical depth of the atmosphere exceeds unity. In such a regime, the impact of trace absorbers is amplified due to higher effective path length caused by multiple scattering events (Bohren, 1987). This effect has been seen in studies of UV transmittance through thick clouds on Earth as well (Mayer et al., 1998). Consequently, the surface UV environment is a feature of both pCO2 and pSO2. For pSO bar, UV fluence nm is strongly suppressed.
H2S is also a major volcanogenic gas that may have been emitted at rates greater than or equal to SO2 on young Mars, based on studies of the oxidation state of Martian basalts (Herd et al., 2002; Halevy et al., 2007). While Halevy and Head (2014) do not calculate the H2S abundance as a function of volcanic outgassing, the calculations of Hu et al. (2013) (T0=288K, modern solar irradiance) suggest that pH2SpSO2 in a CO2 dominated atmosphere. Consequently, we also consider the impact of elevated levels of H2S, up to pH2S= bar in atmospheres with pCO bar. Figure 7 presents the surface radiance calculated over this range of atmospheres (SZA=0, corresponding to desert, and K). For pH bar, UV fluence nm is strongly suppressed.
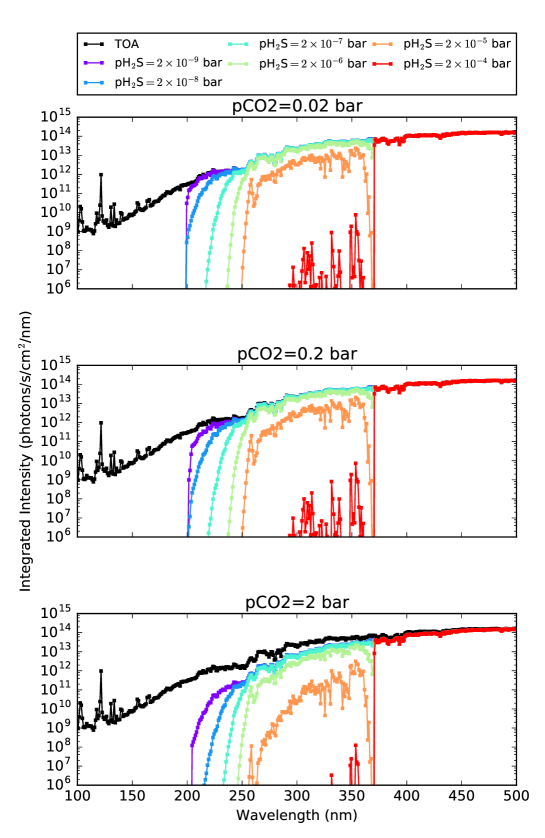
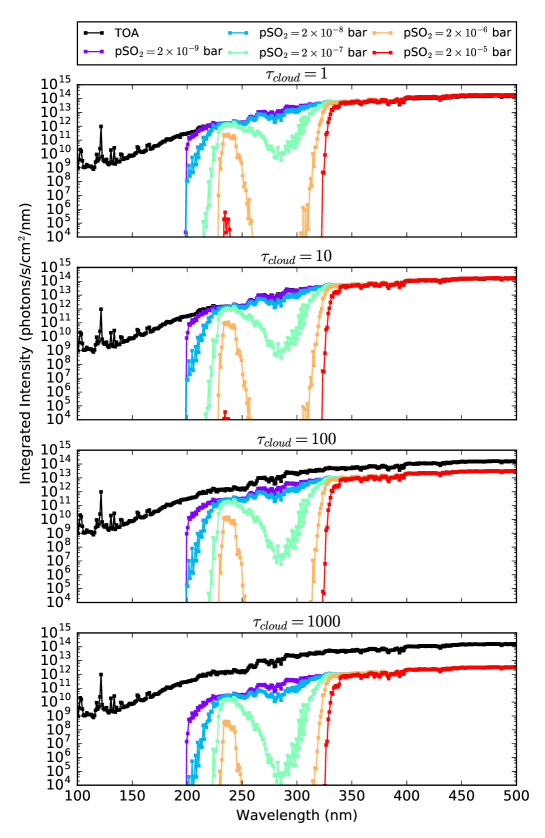
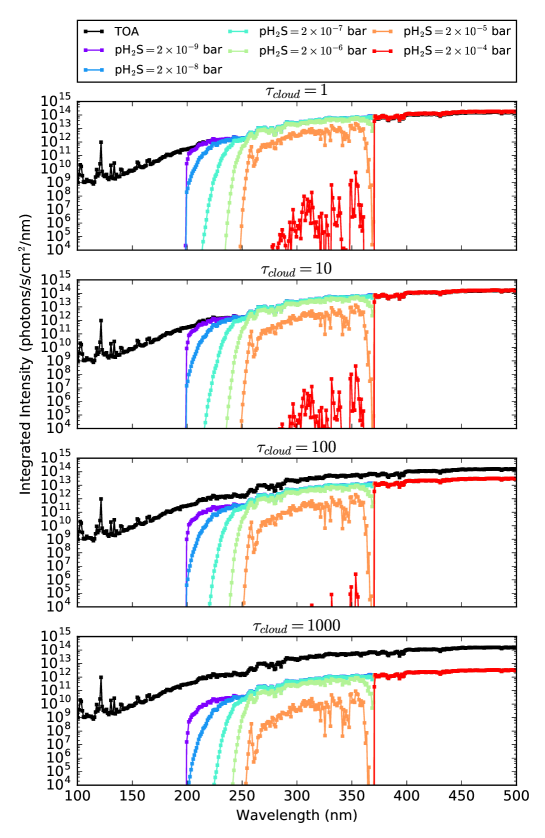
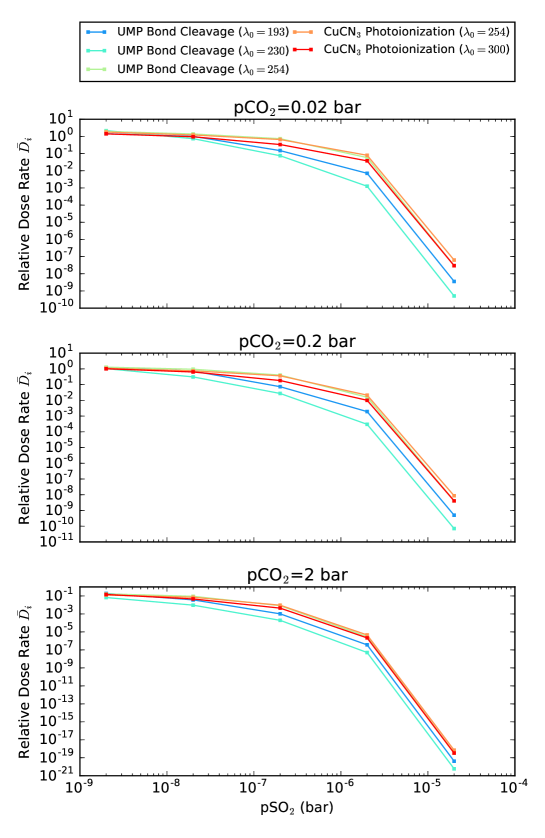
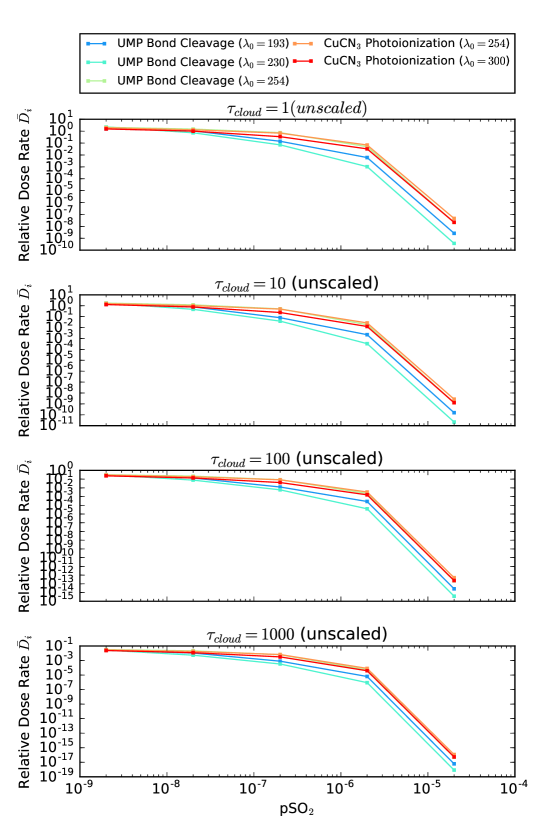
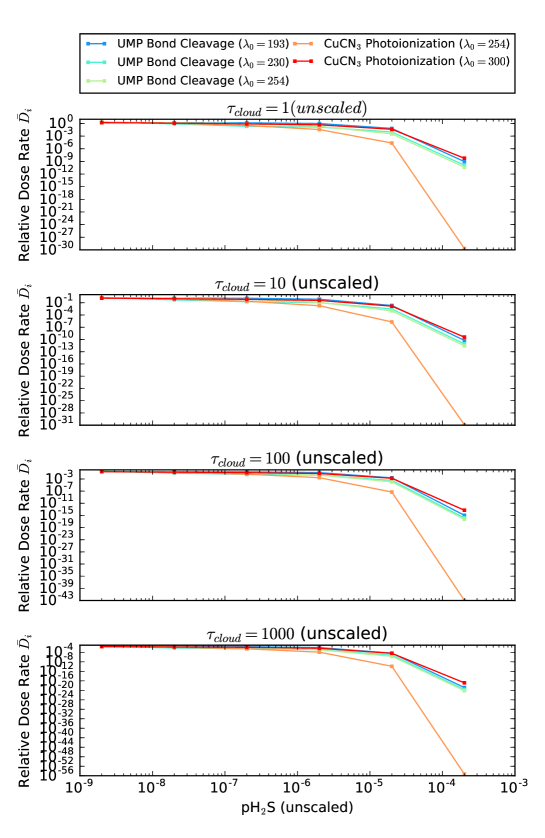
Scattering due to thick cloud decks can also enhance absorption by trace pSO2 and pH2S. For pSO bar and pCO2=0.02 bar888At pCO2=0.02 bar, the gaseous scattering optical depth is less than unity for wavelengths longer than 204 nm, meaning that we can attribute this amplification primarily to the cloud deck (as opposed to gaseous scattering). (SZA=0, corresponding to new snow (near 1), K, m), inclusion of CO2 clouds with optical depth of amplifies attenuation by a factor of at nm (optically thin in SO2 absorption) and by a factor of at nm (optically thick in SO2 absorption) compared to what one would calculate by multiplying the transmission from the SO2 and cloud deck individually. This effect is weaker for low-albedo cases, because there are fewer passes of radiation through the atmosphere due to bouncing between the surface and cloud deck. This nonlinear variance in transmission due to multiple scattering effects illustrates the need to specify surface albedo, cloud thickness and absorber level when calculating surface radiances. Figure 8 and Figure 9 present the surface radiance at the base of a pCO2=0.02 bar atmosphere with varying levels of SO2 and H2S respectively, with CO2 cloud decks of optical depths emplaced from 20-21 km (SZA=0, corresponding to desert, K, m).
4.4 Effect of Dust
The atmosphere of modern Mars is dusty, with typical dust optical depths varying from at solar wavelengths (Smith et al., 2002; Lemmon et al., 2015), with the higher values achieved during global dust storms. Mars’s dryness contributes to its dustiness, through the availability of desiccated surface to supply dust and the lack of a hydrologic cycle to quickly scrub it from the atmosphere. If one assumes that Mars were similarly dry in the past, dust levels in the Martian atmosphere may have been significant. We may speculate that if the atmosphere were thicker, it could have hosted even more dust than the modern Martian atmosphere due to slower sedimentation times. However, detailed study of atmospheric dust dynamics, including analysis of how dust lofting scales with pCO2, is required to constrain this possibility. Dust absorbs at UV wavelengths (see Figure 1), so dust could play a role similar to volcanogenic gases in scrubbing UV radiative from the UV surface environment.
We explored the impact of including dust in our calculation of surface UV fluence. We assumed that, similar to the modern Mars, the dust followed an exponential profile with scale height height km, similar to the atmospheric pressure scale height (Hoekzema et al., 2010; Mishra et al., 2016). For surface temperatures (and hence scale heights) comparable to modern Mars, this corresponds to the assumption by previous workers that the dust mixing ratio is constant in the lower atmosphere (Forget et al., 1999). Then, the dust optical depth across each atmospheric layer of width is
where is the altitude of the layer center. The parameter
, is chosen such that the column-integrated dust optical depth is .
Figure 10 presents the surface radiance for varying and pCO bar (SZA=0, corresponding to desert, and K). As for SO2 and H2S, highly scattering atmospheres amplify the impact of trace absorbers. only marginally suppresses UV fluence for pCO bar, but for pCO bar shortwave fluence is suppressed due to enhanced Rayleigh scattering. In the absence of scattering amplification, is required to strongly suppress UV fluence.
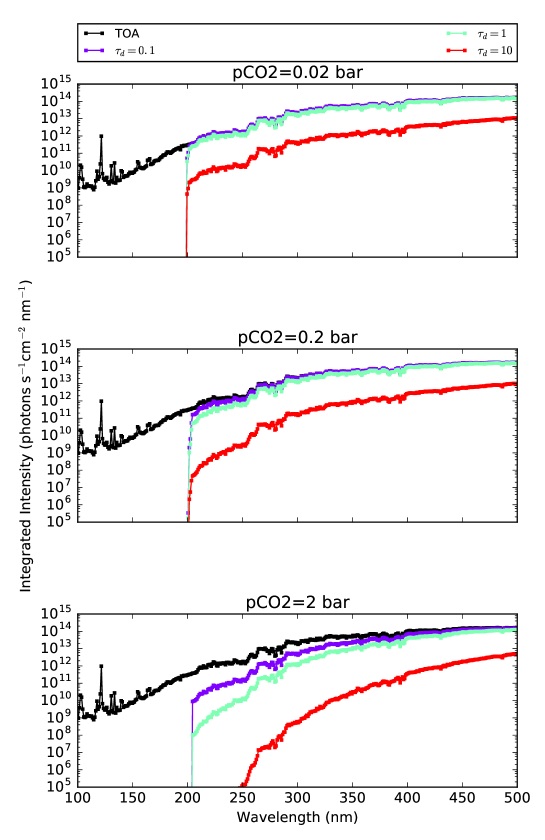
Figure 11 presents the surface radiance at the base of a pCO2=0.02 bar atmosphere with varying , with CO2 cloud decks of optical depths emplaced from 20-21 km (SZA=0, corresponding to desert, K, m). The impact of a cloud deck is less than the impact of increasing overall atmospheric pressure, because of the limited column of absorber contained within the cloud itself. If the cloud deck is extended, then the surface fluence is reduced (for the same total cloud and dust optical depth).
5 Discussion
5.1 CO2-H2O Atmosphere
Normative CO2-H2O climate models predict the steady-state early Martian climate to have been cold, with global mean temperatures below freezing (Forget et al., 2013; Wordsworth et al., 2013, 2015). In this scenario, aqueous prebiotic chemistry would proceed in meltwater pools, which could have occurred transiently during midday due to the diurnal cycle, during summer during a seasonal cycle, or a combination of both. Aqueous prebiotic chemistry could also have proceeded in geothermally heated pools, which may have been abundant during the more volcanically active Noachian.
Figure 12 presents the dose rates corresponding to irradiation of prebiotically relevant molecules through a clear-sky CO2-H2O atmosphere with SZA=0 and corresponding to desert. The dose rates decline by only an order of magnitude across 5 orders of magnitude of pCO bar, meaning that the prebiotic photochemistry dose rates are only weakly sensitive to pCO2 across this range. is within an order of magnitude of unity across this range, meaning that the Martian dose rates are comparable to the terrestrial rates. This is consistent with the results of Cockell (2000), who found that UV stress as measured by DNA damage were comparable for 3.5 Ga Earth and Mars.
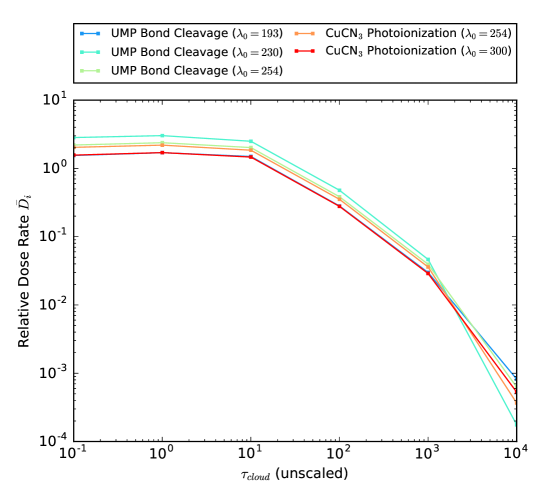
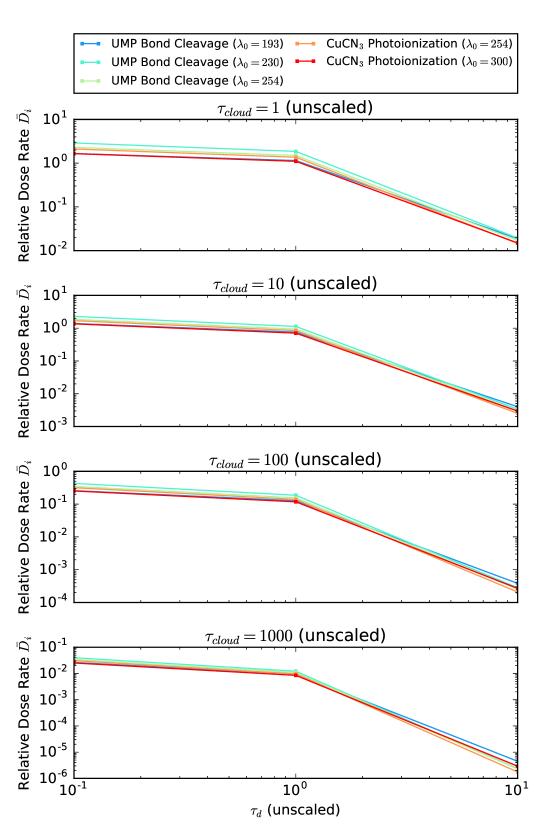
However, the sky was not necessarily clear during this epoch. In fact, formation of H2O and CO2 clouds are expected based on GCM studies (Wordsworth et al., 2013). Thick (though patchy) CO2 cloud decks in particular are expected for thick CO2 atmospheres. Figure 13 presents the dose rates as a function of CO2 cloud optical depth for pCO2=0.02 bar, SZA=0, and corresponding to desert. As we might expect from Figure 5, the dose rate drops off only modestly with . is required to suppress dose rates by more than an order of magnitude. For , this corresponds to the maximum cloud column calculated by Wordsworth et al. (2013). Overall, the impact of clouds on their own on UV-sensitive photochemistry is expected to be modest.
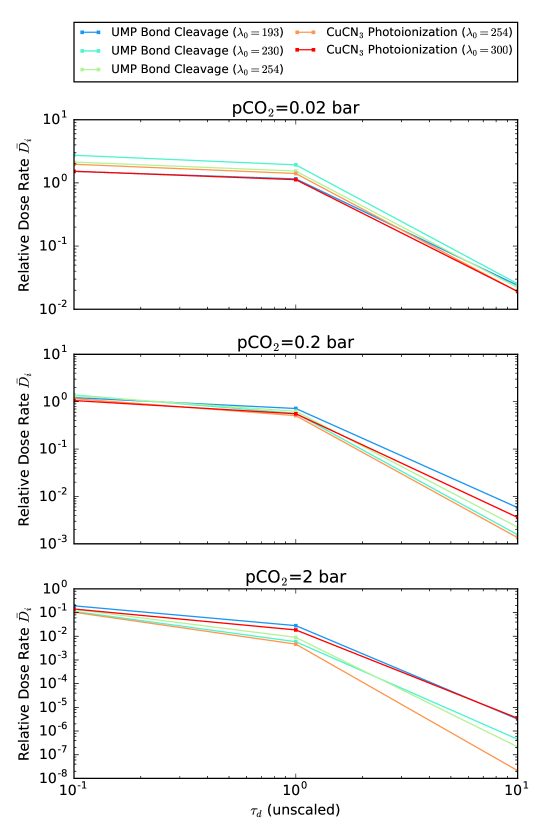
If young Mars were indeed cold and dry, then one might expect it to have been dusty, as it is today. The modern Martian dust optical depth ranges from , with higher values achieved during dust storms (Smith et al., 2002; Lemmon et al., 2015). Higher dust loadings may have been possible when the atmosphere was thicker. Figure 14 presents the dose rates as a function of and pCO2, for SZA=0 and corresponding to desert. Figure 15 presents the dose rates as a function of and CO2 cloud optical depth, for SZA=0 and corresponding to desert.
Unlike CO2 and H2O ice and gas, dust absorbs across the UV waveband. Further, this absorption can be dramatically increased in highly scattering atmospheres due to enhanced effective path length due to multiple scattering effects. Consequently, dust can dramatically suppress UV fluence and hence photochemistry, especially for thick and/or cloudy atmospheres. For , dose rates are suppressed by 2-8 orders of magnitude, depending on atmospheric pressure and cloud thickness. Dust of thickness provides minimal suppression for pCO0.2 bar or , but for pCO2 bar or , can suppress dose rates by orders of magnitude. Dust of thickness does not significantly alter dose rates across the explored parameter space. Overall, dust can significantly alter dose rates if it is present at high levels (greater than that seen for modern Martian dust storms) or if it is present at levels comparable to the modern average, but embedded in a thick atmosphere or underlying thick clouds.
We considered the hypothesis that attenuation due to dust might differentially affect the stressor and eustressor pathways. That is, we considered the possibility that the eustressor reaction rates might fall off faster (or slower) than the stressor reaction rates with attenuation due to dust. Since the stressor pathway measures destruction of RNA monomers and the eustressor pathway measures a process important to the synthesis of key RNA precursors, this means that environments that favor the eustressor pathway over the stressor pathway are a more favorable venue for abiogenesis than the reverse, in the RNA world hypothesis. This argument assumes that these particular stressor and eustressor processes were important in the prebiotic world. They might not have been. However, we expect other photochemical stressor and eustressor processes to behave in generally similar ways to these processes. For example, we generally expect the quantum yield of prebiotic molecular destruction to decrease with increasing wavelength because of decreased photon energy compared to bond strength. Similarly, regardless of the solvated electron source (e.g. HS- as opposed to tricyanocuprate), we expect the quantum yield to go approximately as a step function in wavelength. We therefore suggest that results derived from these pathways may generalize to other processes, though a detailed comparison is required to rule on this hypothesis.
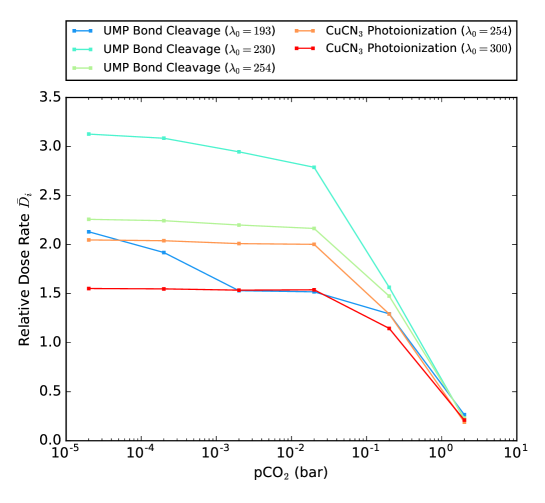
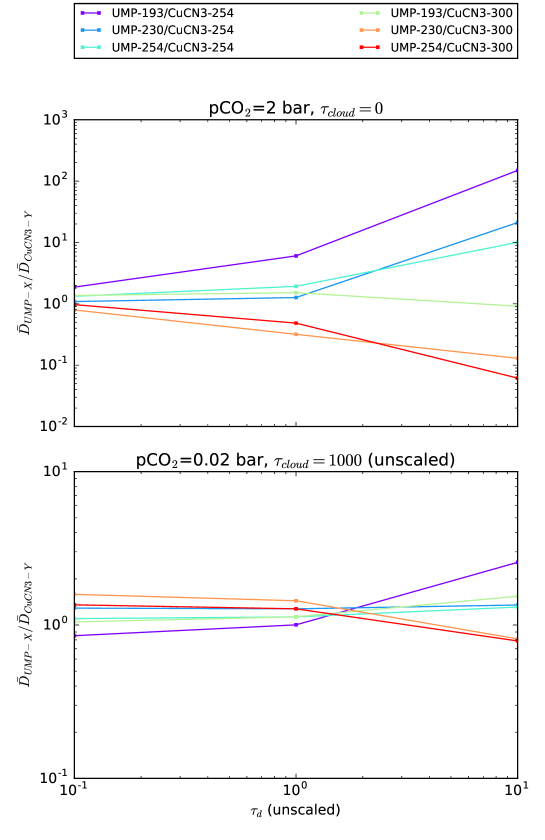
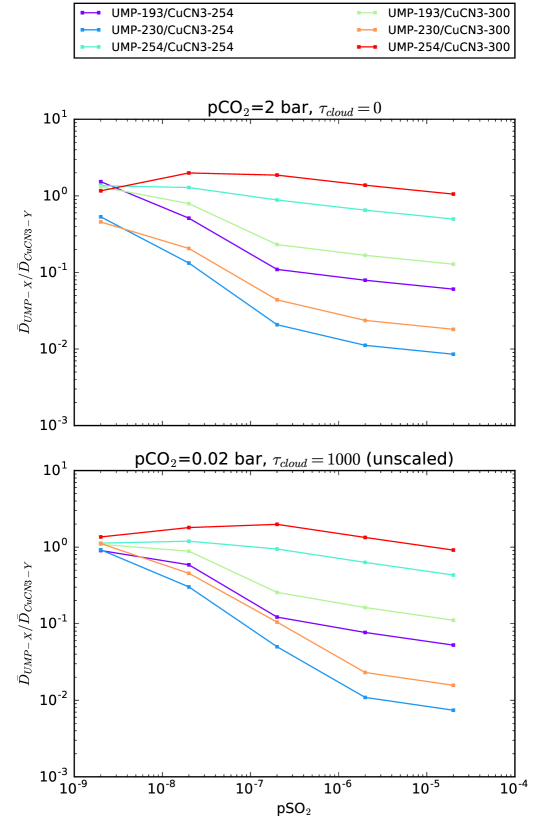
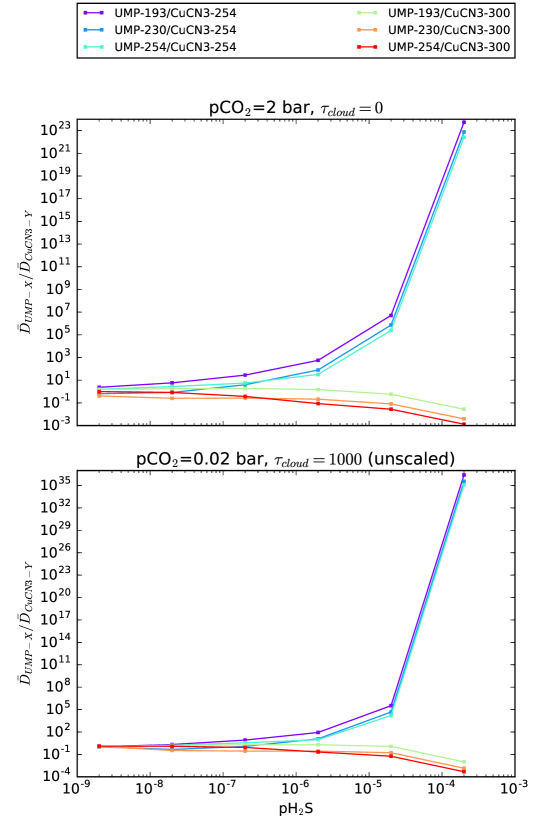
To assess the hypothesis that a dusty Mars might be less (or more) clement for abiogenesis than a non-dusty Mars as measured by our stressor (UMP-X) and eustressor (CuCN3-Y) pathways, we calculated . We calculated this quantity for pCO bar (no clouds) and (pCO2=0.02 bar) for . If these ratios rise with , it means that the stressor pathway is relatively favored by dusty atmospheres; if they fall, it means that the stressor pathway is relatively disfavored by dusty atmospheres.
Figure 16 presents these calculations. Dust attenuation on its own is relatively flat at CO2-scattering wavelengths, as is cloud attenuation. Consequently dusty/cloudy atmospheres tend to reduce UV fluence in a spectrally flat manner, and favor neither the stressor nor the eustressor pathway. On the other hand, in a thick CO2 atmosphere, the scattering optical depth, and hence amplification of dust absorption, increases as wavelength decreases. Consequently, the dose rate ratio does change with increasing . However, the direction of the change is sensitive to the value of , the ionization threshold for the tricyanocuprate ionization process, and the magnitude is further sensitive to the value of for the UMP cleavage process. We consequently conclude it is possible that thick, dusty atmospheres might be more or less clement for abiogenesis than non-dusty atmospheres, but determining which requires wavelength-dependent measurements of the QYs of these chemical processes in the laboratory.
5.2 Highly Reducing Atmospheres
Recent work suggests that if the reduced gases H2 and/or CH4 were present at elevated levels in a thick ( bar) atmosphere, collision-induced absorption (CIA) due to the interaction of these gases with CO2 might provide enough greenhouse warming to elevate mean Noachian temperatures above freezing (Ramirez et al., 2014; Wordsworth et al., 2017). Ramirez et al. (2014) found that global mean surface temperatures exceeded 273K for bar and [H2], with higher concentrations of H2 required for lower . More recently, Wordsworth et al. (2017) used new ab initio calculations of H2-CO2 and CH4-CO2 CIA to show earlier estimates of the CIA were underestimated, and that 2-10% levels of CH4 or H2 in a bar atmosphere could elevate planetary mean temperatures over freezing. While it is unclear if such high reducing conditions can be sustained in the steady state, this scenario remains an intriguing avenue to a Noachian Mars with conditions at least transiently globally clement for liquid water and prebiotic chemistry (Batalha et al., 2015; Wordsworth et al., 2017).
H2 is spectrally inert at UV wavelengths compared to CO2. Based on the constraints on H2 absorption we found (Backx et al., 1976; Victor and Dalgarno, 1969), the contribution of H2 to atmospheric absorption and scattering are negligible for H2 mixing ratios of . Similarly, CH4 does not absorb at wavelengths longer than 165 nm (Au et al., 1993; Chen and Wu, 2004). Hence, it’s absorption is highly degenerate with CO2, and its presence at the levels suggested in Wordsworth et al. (2017) does not impact the UV surface environment. Photochemically-generated hydrocarbon hazes require CH4/CO2 ratios of , and are consequently expected to be thin or nonexistent in this scenario (DeWitt et al., 2009). Consequently, the UV surface environment in an H2 or CH4-rich atmosphere should be similar to the pCO2=2 bar case discussed in Section 5.1.
5.3 Highly-Volcanic Mars (CO2-H2O-SO2/H2S Atmosphere)
We have so far considered atmospheres with CO2 and H2O as their dominant photoactive gaseous species. However, other gases have been proposed as significant constituents of the Martian atmosphere. In particular, Halevy et al. (2007) suggest that the lack of massive carbonate deposits on Mars could have been explained if, during epochs of high volcanism on young Mars, SO2 built up to the ppm level. At such levels, Halevy et al. (2007) find that SO2 would supplant CO2 as the agent regulating global chemistry and climate, inhibiting massive carbonate precipitation in the process. Halevy and Head (2014) further argue that enhanced radiative forcing from high SO2 levels could transiently raise mean surface temperatures at the subsolar point (assuming no horizontal heat transport) above the freezing point of water, explaining the observed fluvial features. Halevy and Head (2014) calculate that SO2 mixing ratios ppm (1 bar atmosphere) could have been possible during, e.g., the emplacement of the Martian volcanic plains. While the impact of SO2 on Martian carbonates and climate remains debated (e.g., Niles et al. 2013, Kerber et al. 2015), it remains plausible that Noachian Mars may have been characterized by at least transiently high SO2 levels due to higher volcanic outgassing rates.
We consequently sought to explore the impact of elevated levels of SO2 on the UV surface environment and hence prebiotic chemistry. Figure 17 presents the dose rates calculated for a clear-sky atmosphere with varying pSO2 and pCO2. Figure 18 presents the dose rates calculated for an atmosphere with pCO2=0.02 bar (optically thin at scattering wavelengths), but varying levels of CO2 clouds. In both cases, SZA=0 and corresponds to desert.
SO2 is a far broader, stronger UV absorber than either CO2 or H2O, and consequently its presence can exert a dramatic impact on UV surface radiance and photochemistry rates. As with dust, multiple scattering from other atmospheric constituents can amplify SO2 absorption. For pCO bar, pSO bar is required to suppress dose rates to , whereas for pCO bar, pSO bar is sufficient. Similarly, for , pSO bar is required to suppress dose rates to , whereas for , pSO bar is sufficient. For pSO bar, UV-sensitive prebiotic photochemistry is strongly quenched.
As with dust, we considered the hypothesis that attenuation from SO2 might have a differential impact on the eustressor and stressor pathways. We calculated for pCO bar (no clouds) and (pCO2=0.02 bar) for a broad range of pSO2. This calculation is presented in Figure 19. We note that regardless of assumption on , as pSO2 increases from bar, the eustressor pathway is favored over the stressor pathways, by as much as 2 orders of magnitude (dependent on ). We conclude that it seems plausible that high-SO2 planetary atmospheres have a UV throughput more clement for abiogensis compared to low-SO2 atmospheres under the assumption that the stressor and eustressor pathways we have identified were important. However, better measurements of the spectral QY of these photoprocesses is required to confirm and quantify the magnitude of this effect.
While Halevy and Head (2014) focused on the abundance of SO2 in the Martian atmosphere, H2S is emitted in equal proportion by the more reduced Martian mantle Halevy et al. (2007). Hu et al. (2013) model the atmospheric composition as a function of sulfur emission rate for a 1-bar CO2 atmosphere assuming equipartition of the outgassed sulfur between SO2 and H2S, irradiated by a G2V star at a distance of 1.3 AU. They find H2S concentrations to be even higher than SO2 concentrations, by over an order of magnitude at high S emission rates. H2S is also a stronger, broader UV absorber than CO2 or H2O. Consequently, we sought to explore the impact of elevated levels of H2S on the UV surface environment and prebiotic photochemistry.
Figure 20 presents the dose rates calculated for a clear-sky atmosphere with varying pH2S and pCO2. Figure 21 presents the dose rates calculated for an atmosphere with pCO2=0.02 bar (optically thin at scattering wavelengths), but varying levels of CO2 clouds. In both cases, SZA=0 and corresponding to desert. As with SO2 and dust, highly scattering atmospheres can amplify H2S absorption. For pCO bar, for pH2S bar, but for pCO bar, for pH2S bar. Similarly, for , for pH2S bar, but for , for pH2S bar. For pH2S bar, surface photochemistry is strongly quenched regardless of atmospheric state.
We again considered the hypothesis that H2S attenuation might have a differential impact on the stressor and eustressor dose rates. We calculated for pCO bar (no clouds) and (pCO2=0.02 bar) for a broad range of pH2S. This calculation is presented in Figure 22. As in the case of dust in a dense CO2 atmosphere, the ratios diverge from 1, but in opposite directions depending on the value assumed for for photoionization of tricyanocuprate. We conclude that attenuation from H2S may well have a differential impact on the stressor and eustressor dose rates, but that assessing which it favors requires better constraints on the QYs of the photoprocesses, especially the photoionization of tricyanocuprate.
6 Conclusion
We have used a two-stream multi-layer radiative transfer model to estimate the UV surface environment on the surface of 3.9 Ga Mars as a function of atmospheric composition, and explored the implications for prebiotic chemistry. Prebiotic photoreaction rates are within an order of magnitude of the terrestrial values for normative clear-sky CO2-H2O atmospheres, in agreement with past work (e.g., Cockell 2000) suggesting early Martian and terrestrial atmospheres featured comparable UV environments. In agreement with prior work, we find shortwave radiation to be effectively attenuated by CO2 absorption, with fluence nm removed for pCO bar and fluence nm removed for pCO bar. Fluence drops off more slowly in the nm regime, where neither CO2 nor H2O absorb. This is a consequence of random walk statistics in highly scattering regimes, and stands in contrast to prior studies(Rontó et al., 2003; Cnossen et al., 2007) which did not account for multiple scattering. The impact of CO2 and H2O clouds on their own is similarly muted because they too are pure scatterers in the nm regime; is required to significantly affect surficial reaction rates, comparable to but in excess of the highest patchy cloud optical depths predicted by some 3D GCM studies (e.g., Wordsworth et al. 2013).
While dense atmospheres and cloud decks only modest reduce surface fluence on their own, in concert with other absorbers (dust, SO2, H2S) they can have a dramatic effect on surface fluence and reaction rates, though amplification of the effects of these absorbers. Dust levels of , only a factor of a few higher than that sustained in the modern atmosphere, could suppress prebiotic reaction rates by orders of magnitude for pCObar or , and dust levels of would sharply reduce reaction rates independent of the atmospheric state. Similarly, pSO bar or pH2S bars are required to significantly reduce reaction rates for pCObar or , but for less scattering atmospheres, pSO bar or pH2S bar is required. pSO bars or pH2S bars quenches UV-sensitive photochemistry by many orders of magnitude regardless of other atmospheric conditions.
The absorbers described above have spectrally variable absorption, and prebiotic photochemistry is wavelength-dependent, leading us to speculate whether high abundances of these absorbers, despite suppressing UV-sensitive chemistry generally, might not favor or disfavor eustressor photoprocesses conducive to the origin of life compared to stressor processes that impede life’s formation. We compare the relative impact of absorption from dust, SO2, and H2S attenuation on two such stressor (cleavage of the N-glycosidic bond of UMP) and eustressor photoprocesses (production of aquated electrons from CuCN. We find that it is possible for high levels of these absorbers to disproportionately favor one or the other of these photoprocesses. In particular, high SO2 levels may create an especially favorable environment for abiogenesis, under the assumption that these photoprocesses were important to abiogenesis (so long as enough fluence reaches the ground to power these reactions). However, the magnitude and direction of this effect is sensitive to assumptions about the QY of these processes. Better characterization of the spectral quantum yields of these processes are required to rule definitively on this question.
7 Acknowledgements
We thank C. Magnani and S. Rugheimer for sharing their data with us, and for many insightful conversations. We thank J. Sutherland and J. Szostak for sharing their insights into prebiotic chemistry. We thank two anonymous referees, whose comments improved this manuscript.
This research has made use of NASA’s Astrophysics Data System Bibliographic Services, and the MPI-Mainz UV-VIS Spectral Atlas of Gaseous Molecules.
S. R. and D. D. S. gratefully acknowledge support from the Simons Foundation, grant no. 290360.
8 Author Disclosure Statement
The authors declare no competing financial interests.
References
- Adcock et al. (2013) Adcock, C. T., E. M. Hausrath, and P. M. Forster (2013). Readily available phosphate from minerals in early aqueous environments on Mars. Nature Geoscience 6(10), 824–827.
- Au et al. (1993) Au, J. W., G. Cooper, G. R. Burton, T. N. Olney, and C. Brion (1993). The valence shell photoabsorption of the linear alkanes, c n h 2n+ 2 (n= 1–8): absolute oscillator strengths (7–220 ev). Chemical physics 173(2), 209–239.
- Backx et al. (1976) Backx, C., G. R. Wight, and M. J. Van der Wiel (1976, February). Oscillator strengths (10-70 eV) for absorption, ionization and dissociation in H2, HD and D2, obtained by an electron-ion coincidence method. Journal of Physics B Atomic Molecular Physics 9, 315–331.
- Batalha et al. (2015) Batalha, N., S. D. Domagal-Goldman, R. Ramirez, and J. F. Kasting (2015, September). Testing the early Mars H2-CO2 greenhouse hypothesis with a 1-D photochemical model. Icarus 258, 337–349.
- Benner (2013) Benner, S. A. (2013). Planets, Minerals and Life’s Origin. Mineralogical Magazine 77(5), 686.
- Benner et al. (2015) Benner, S. A., H.-j. K. Foundation, and A. Fl (2015). The Case for a Martian Origin for Earth Life. In R. B. Hoover, G. V. Levin, A. Y. Rozanov, and N. C. Wickramasinghe (Eds.), Instruments, Methods and Missions for Astrobiology XVII, Volume 9606, pp. 1–16.
- Benner et al. (2010) Benner, S. A., H.-J. Kim, M.-J. Kim, and A. Ricardo (2010). Planetary organic chemistry and the origins of biomolecules. Cold Spring Harbor perspectives in biology 2(7), a003467.
- Bohren (1987) Bohren, C. F. (1987, June). Multiple scattering of light and some of its observable consequences. American Journal of Physics 55, 524–533.
- Bristow et al. (2015) Bristow, T. F., D. L. Bish, D. T. Vaniman, R. V. Morris, D. F. Blake, J. P. Grotzinger, E. B. Rampe, J. A. Crisp, C. N. Achilles, D. W. Ming, B. L. Ehlmann, P. L. King, J. C. Bridges, J. L. Eigenbrode, D. Y. Sumner, S. J. Chipera, J. M. Moorokian, A. H. Treiman, S. M. Morrison, R. T. Downs, J. D. Farmer, D. Des Marais, P. Sarrazin, M. M. Floyd, M. A. Mischna, and A. C. McAdam (2015). The origin and implications of clay minerals from Yellowknife Bay, Gale crater, Mars. American Mineralogist 100(4), 824–836.
- Chen and Wu (2004) Chen, F. and C. Wu (2004, May). Temperature-dependent photoabsorption cross sections in the VUV-UV region. I. Methane and ethane. Journal of Quantitative Spectroscopy and Radiative Transfer 85(2), 195–209.
- Claire et al. (2012) Claire, M. W., J. Sheets, M. Cohen, I. Ribas, V. S. Meadows, and D. C. Catling (2012, September). The Evolution of Solar Flux from 0.1 nm to 160 m: Quantitative Estimates for Planetary Studies. ApJ 757, 95.
- Cnossen et al. (2007) Cnossen, I., J. Sanz-Forcada, F. Favata, O. Witasse, T. Zegers, and N. F. Arnold (2007, February). Habitat of early life: Solar X-ray and UV radiation at Earth’s surface 4-3.5 billion years ago. Journal of Geophysical Research (Planets) 112, 2008.
- Cockell (2000) Cockell, C. (2000). The ultraviolet history of the terrestrial planets: implications for biological evolution. Planetary and Space Science 48.
- Cockell (1999) Cockell, C. S. (1999). Carbon biochemistry and the ultraviolet radiation environments of F, G, and K main sequence stars. Icarus 141(2), 399–407.
- Cockell (2002) Cockell, C. S. (2002). Photobiological uncertainties in the archaean and post-archaean world. International Journal of Astrobiology 1(01), 31–38.
- Colaprete and Toon (2003) Colaprete, A. and O. B. Toon (2003, April). Carbon dioxide clouds in an early dense Martian atmosphere. Journal of Geophysical Research (Planets) 108, 6–1.
- DeWitt et al. (2009) DeWitt, H. L., M. G. Trainer, A. A. Pavlov, C. A. Hasenkopf, A. C. Aiken, J. L. Jimenez, C. P. McKay, O. B. Toon, and M. A. Tolbert (2009, June). Reduction in Haze Formation Rate on Prebiotic Earth in the Presence of Hydrogen. Astrobiology 9, 447–453.
- Fanale et al. (1982) Fanale, F. P., J. R. Salvail, W. B. Banerdt, and R. S. Saunders (1982, June). Mars - The regolith-atmosphere-cap system and climate change. Icarus 50, 381–407.
- Forget et al. (1999) Forget, F., F. Hourdin, R. Fournier, C. Hourdin, O. Talagrand, M. Collins, S. R. Lewis, P. L. Read, and J.-P. Huot (1999). Improved general circulation models of the martian atmosphere from the surface to above 80 km. Journal of Geophysical Research: Planets 104(E10), 24155–24175.
- Forget and Pierrehumbert (1997) Forget, F. and R. T. Pierrehumbert (1997). Warming early mars with carbon dioxide clouds that scatter infrared radiation. Science 278(5341), 1273–1276.
- Forget et al. (2013) Forget, F., R. Wordsworth, E. Millour, J.-B. Madeleine, L. Kerber, J. Leconte, E. Marcq, and R. M. Haberle (2013, January). 3D modelling of the early martian climate under a denser CO2 atmosphere: Temperatures and CO2 ice clouds. Icarus 222, 81–99.
- Gollihar et al. (2014) Gollihar, J., M. Levy, and A. D. Ellington (2014). Many paths to the origin of life. Science 343(6168), 259–260.
- Grotzinger et al. (2015) Grotzinger, J. P., S. Gupta, M. C. Malin, D. M. Rubin, J. Schieber, K. Siebach, D. Y. Sumner, K. M. Stack, a. R. Vasavada, R. E. Arvidson, F. Calef, L. Edgar, W. F. Fischer, J. a. Grant, J. Griffes, L. C. Kah, M. P. Lamb, K. W. Lewis, N. Mangold, M. E. Minitti, M. Palucis, M. Rice, R. M. E. Williams, R. a. Yingst, D. Blake, D. Blaney, P. Conrad, J. Crisp, W. E. Dietrich, G. Dromart, K. S. Edgett, R. C. Ewing, R. Gellert, J. a. Hurowitz, G. Kocurek, P. Mahaffy, M. J. McBride, S. M. McLennan, M. Mischna, D. Ming, R. Milliken, H. Newsom, D. Oehler, T. J. Parker, D. Vaniman, R. C. Wiens, and S. a. Wilson (2015). Deposition, exhumation, and paleoclimate of an ancient lake deposit, Gale crater, Mars. Science (New York, N.Y.) 350(6257), aac7575.
- Gurzadyan and Görner (1994) Gurzadyan, G. G. and H. Görner (1994). Damage to uracil-and adenine-containing bases, nucleosides, nucleotides and polynucleotides: Quantum yields on irradiation at 193 and 254 nm. Photochemistry and photobiology 60(4), 323–332.
- Halevy and Head (2014) Halevy, I. and J. W. Head, III (2014, December). Episodic warming of early Mars by punctuated volcanism. Nature Geoscience 7, 865–868.
- Halevy et al. (2007) Halevy, I., M. T. Zuber, and D. P. Schrag (2007, dec). A sulfur dioxide climate feedback on early Mars. Science (New York, N.Y.) 318(5858), 1903–7.
- Hansen (1997) Hansen, G. B. (1997, September). The infrared absorption spectrum of carbon dioxide ice from 1.8 to 333 m. J. Geophys. Res. 102, 21569–21588.
- Hansen (2005) Hansen, G. B. (2005, November). Ultraviolet to near-infrared absorption spectrum of carbon dioxide ice from 0.174 to 1.8 m. Journal of Geophysical Research (Planets) 110, E11003.
- Hansen and Travis (1974) Hansen, J. E. and L. D. Travis (1974, October). Light scattering in planetary atmospheres. Space Sci. Rev. 16, 527–610.
- Herd et al. (2002) Herd, C. D. K., L. E. Borg, J. H. Jones, and J. J. Papike (2002, June). Oxygen fugacity and geochemical variations in the martian basalts: implications for martian basalt petrogenesis and the oxidation state of the upper mantle of Mars. Geochim. Cosmochim. Acta 66, 2025–2036.
- Hoekzema et al. (2010) Hoekzema, N. M., M. Garcia-Comas, O. J. Stenzel, B. Grieger, W. J. Markiewicz, K. Gwinner, and H. U. Keller (2010, June). Optical depth and its scale-height in Valles Marineris from HRSC stereo images. Earth and Planetary Science Letters 294, 534–540.
- Horváth et al. (1984) Horváth, A., S. Papp, and Z. Décsy (1984). Formation of aquated electrons and the individual quantum yields for photoactive species in the Cu (I) KCN H2O system. Journal of photochemistry 24(4), 331–339.
- Hu et al. (2012) Hu, R., S. Seager, and W. Bains (2012, December). Photochemistry in Terrestrial Exoplanet Atmospheres. I. Photochemistry Model and Benchmark Cases. ApJ 761, 166.
- Hu et al. (2013) Hu, R., S. Seager, and W. Bains (2013, May). Photochemistry in Terrestrial Exoplanet Atmospheres. II. H2S and SO2 Photochemistry in Anoxic Atmospheres. ApJ 769, 6.
- Joseph et al. (1976) Joseph, J. H., W. J. Wiscombe, and J. A. Weinman (1976, December). The delta-Eddington approximation for radiative flux transfer. Journal of Atmospheric Sciences 33, 2452–2459.
- Kasting (1991) Kasting, J. F. (1991, November). CO2 condensation and the climate of early Mars. Icarus 94, 1–13.
- Kerber et al. (2015) Kerber, L., F. Forget, and R. Wordsworth (2015, November). Sulfur in the early martian atmosphere revisited: Experiments with a 3-D Global Climate Model. Icarus 261, 133–148.
- Kirschvink and Weiss (2002) Kirschvink, J. L. and B. P. Weiss (2002). Mars, panspermia, and the origin of life: where did it all begin. Palaeontologia electronica 4(2), 8–15.
- Kylling et al. (1995) Kylling, A., K. Stamnes, and S. Tsay (1995). A reliable and efficient two-stream algorithm for spherical radiative transfer: Documentation of accuracy in realistic layered media. Journal of Atmospheric Chemistry 21(2), 115–150.
- Lemmon et al. (2015) Lemmon, M. T., M. J. Wolff, J. F. Bell, III, M. D. Smith, B. A. Cantor, and P. H. Smith (2015, May). Dust aerosol, clouds, and the atmospheric optical depth record over 5 Mars years of the Mars Exploration Rover mission. Icarus 251, 96–111.
- Madronich (1987) Madronich, S. (1987). Photodissociation in the atmosphere: 1. actinic flux and the effects of ground reflections and clouds. Journal of Geophysical Research: Atmospheres 92(D8), 9740–9752.
- Magnani (2015) Magnani, C. J. (2015). Life’s first steps: Exploring the feasibility of prebiotic chemical reactions through ultraviolet dependence. A.B. Thesis, Harvard University.
- Maher and Stevenson (1988) Maher, K. A. and D. J. Stevenson (1988, February). Impact frustration of the origin of life. Nature 331, 612–614.
- Mayer et al. (1998) Mayer, B., A. Kylling, S. Madronich, and G. Seckmeyer (1998, December). Enhanced absorption of UV radiation due to multiple scattering in clouds: Experimental evidence and theoretical explanation. J. Geophys. Res. 103, 31.
- Miller (2009) Miller, T. M. (2009). Atomic and molecular polarizabilities. In D. R. Lide (Ed.), CRC Handbook of Chemistry and Physics (90 ed.). Boca Raton, FL: CRC Press.
- Mishra et al. (2016) Mishra, M. K., P. Chauhan, R. Singh, S. M. Moorthi, and S. S. Sarkar (2016, February). Estimation of dust variability and scale height of atmospheric optical depth (AOD) in the Valles Marineris on Mars by Indian Mars Orbiter Mission (MOM) data. Icarus 265, 84–94.
- Mulkidjanian et al. (2003) Mulkidjanian, A. Y., D. A. Cherepanov, and M. Y. Galperin (2003). Survival of the fittest before the beginning of life: selection of the first oligonucleotide-like polymers by UV light. BMC Evolutionary Biology 3, 12.
- Niles et al. (2013) Niles, P. B., D. C. Catling, G. Berger, E. Chassefière, B. L. Ehlmann, J. R. Michalski, R. Morris, S. W. Ruff, and B. Sutter (2013). Geochemistry of carbonates on mars: implications for climate history and nature of aqueous environments. Space Science Reviews 174(1-4), 301–328.
- Pang and Ajello (1977) Pang, K. and J. M. Ajello (1977, January). Complex refractive index of Martian dust - Wavelength dependence and composition. Icarus 30, 63–74.
- Parkinson et al. (2003) Parkinson, W. H., J. Rufus, and K. Yoshino (2003, May). Absolute absorption cross section measurements of CO2 in the wavelength region 163-200 nm and the temperature dependence. Chemical Physics 290, 251–256.
- Patel et al. (2015) Patel, B. H., C. Percivalle, D. J. Ritson, C. D. Duffy, and J. D. Sutherland (2015). Common origins of RNA, protein and lipid precursors in a cyanosulfidic protometabolism. Nature Chemistry (March), 1–7.
- Pierrehumbert (2010) Pierrehumbert, R. T. (2010). Principles of planetary climate. Cambridge University Press.
- Powner et al. (2009) Powner, M. W., B. Gerland, and J. D. Sutherland (2009, may). Synthesis of activated pyrimidine ribonucleotides in prebiotically plausible conditions. Nature 459(7244), 239–42.
- Ramirez et al. (2014) Ramirez, R. M., R. Kopparapu, M. E. Zugger, T. D. Robinson, R. Freedman, and J. F. Kasting (2014). Warming early mars with co2 and h2. Nature Geoscience 7(1), 59–63.
- Ranjan and Sasselov (2016) Ranjan, S. and D. D. Sasselov (2016, January). Influence of the UV Environment on the Synthesis of Prebiotic Molecules. Astrobiology 16, 68–88.
- Ranjan and Sasselov (2017) Ranjan, S. and D. D. Sasselov (2017, March). Constraints on the Early Terrestrial Surface UV Environment Relevant to Prebiotic Chemistry. Astrobiology 17, 169–204.
- Rapf and Vaida (2016) Rapf, R. J. and V. Vaida (2016). Sunlight as an energetic driver in the synthesis of molecules necessary for life. Phys. Chem. Chem. Phys. 18, 20067–20084.
- Ritson and Sutherland (2012) Ritson, D. and J. D. Sutherland (2012, November). Prebiotic synthesis of simple sugars by photoredox systems chemistry. Nature chemistry 4(11), 895–9.
- Robinson and Catling (2014) Robinson, T. D. and D. C. Catling (2014, January). Common 0.1bar tropopause in thick atmospheres set by pressure-dependent infrared transparency. Nature Geoscience 7, 12–15.
- Rontó et al. (2003) Rontó, G., A. Bérces, H. Lammer, C. S. Cockell, G. J. Molina-Cuberos, M. R. Patel, F. Selsis, and A. Be (2003). Solar UV irradiation conditions on the surface of Mars. Photochemistry and photobiology 77(1), 34–40.
- Rosenberg et al. (2008) Rosenberg, R., M. Abu Haija, and P. Ryan (2008, October). Chiral-Selective Chemistry Induced by Spin-Polarized Secondary Electrons from a Magnetic Substrate. Physical Review Letters 101(17), 178301.
- Rugheimer et al. (2015) Rugheimer, S., A. Segura, L. Kaltenegger, and D. Sasselov (2015, June). UV Surface Environment of Earth-like Planets Orbiting FGKM Stars through Geological Evolution. ApJ 806, 137.
- Sagan (1973) Sagan, C. (1973, April). Ultraviolet selection pressure on the earliest organisms. Journal of theoretical biology 39(1), 195–200.
- Sarker et al. (2013) Sarker, P. K., J.-i. Takahashi, Y. Obayashi, T. Kaneko, and K. Kobayashi (2013, June). Photo-alteration of hydantoins against UV light and its relevance to prebiotic chemistry. Advances in Space Research 51(12), 2235–2240.
- Segura et al. (2007) Segura, A., V. S. Meadows, J. F. Kasting, D. Crisp, and M. Cohen (2007, September). Abiotic formation of O2 and O3 in high-CO2 terrestrial atmospheres. A&A 472, 665–679.
- Sinsheimer and Hastings (1949) Sinsheimer, R. L. and R. Hastings (1949). A reversible photochemical alteration of uracil and uridine. Science 110(2864), 525–526.
- Sleep et al. (1989) Sleep, N. H., K. J. Zahnle, J. F. Kasting, and H. J. Morowitz (1989, November). Annihilation of ecosystems by large asteroid impacts on the early earth. Nature 342, 139–142.
- Smith et al. (2002) Smith, M. D., B. J. Conrath, J. C. Pearl, and P. R. Christensen (2002, May). NOTE: Thermal Emission Spectrometer Observations of Martian Planet-Encircling Dust Storm 2001A. Icarus 157, 259–263.
- Stark et al. (2007) Stark, G., K. Yoshino, P. L. Smith, and K. Ito (2007, January). Photoabsorption cross section measurements of CO2 between 106.1 and 118.7 nm at 295 and 195 K. J. Quant. Spec. Radiat. Transf. 103, 67–73.
- Stephenson et al. (2013) Stephenson, J. D., L. J. Hallis, K. Nagashima, and S. J. Freeland (2013). Boron Enrichment in Martian Clay. PLoS ONE 8(6), 6–9.
- Tian et al. (2009) Tian, F., J. F. Kasting, and S. C. Solomon (2009, January). Thermal escape of carbon from the early Martian atmosphere. Geophys. Res. Lett. 36, L02205.
- Toon et al. (1989) Toon, O. B., C. P. McKay, T. P. Ackerman, and K. Santhanam (1989, November). Rapid calculation of radiative heating rates and photodissociation rates in inhomogeneous multiple scattering atmospheres. J. Geophys. Res. 94, 16287–16301.
- Victor and Dalgarno (1969) Victor, G. A. and A. Dalgarno (1969, March). Dipole Properties of Molecular Hydrogen. J. Chem. Phys. 50, 2535–2539.
- Vincendon et al. (2011) Vincendon, M., C. Pilorget, B. Gondet, S. Murchie, and J.-P. Bibring (2011, November). New near-IR observations of mesospheric CO2 and H2O clouds on Mars. Journal of Geophysical Research (Planets) 116, E00J02.
- Voet et al. (1963) Voet, D., W. B. Gratzer, R. a. Cox, and P. Doty (1963, June). Absorption spectra of nucleotides, polynucleotides, and nucleic acids in the far ultraviolet. Biopolymers 1(3), 193–208.
- Wagner and Pruß (2002) Wagner, W. and A. Pruß (2002, June). The IAPWS Formulation 1995 for the Thermodynamic Properties of Ordinary Water Substance for General and Scientific Use. Journal of Physical and Chemical Reference Data 31, 387–535.
- Wagner et al. (1994) Wagner, W., A. Saul, and A. Pruss (1994, May). International Equations for the Pressure Along the Melting and Along the Sublimation Curve of Ordinary Water Substance. Journal of Physical and Chemical Reference Data 23, 515–527.
- Warren and Brandt (2008) Warren, S. G. and R. E. Brandt (2008, July). Optical constants of ice from the ultraviolet to the microwave: A revised compilation. Journal of Geophysical Research (Atmospheres) 113, D14220.
- Wolff et al. (2009) Wolff, M. J., M. D. Smith, R. T. Clancy, R. Arvidson, M. Kahre, F. Seelos, S. Murchie, and H. Savijärvi (2009, June). Wavelength dependence of dust aerosol single scattering albedo as observed by the Compact Reconnaissance Imaging Spectrometer. Journal of Geophysical Research (Planets) 114, E00D04.
- Wordsworth et al. (2013) Wordsworth, R., F. Forget, E. Millour, J. Head, J.-B. Madeleine, and B. Charnay (2013). Global modelling of the early martian climate under a denser CO2 atmosphere: Water cycle and ice evolution. Icarus 222(1), 1–19.
- Wordsworth et al. (2013) Wordsworth, R., F. Forget, E. Millour, J. W. Head, J.-B. Madeleine, and B. Charnay (2013, January). Global modelling of the early martian climate under a denser CO2 atmosphere: Water cycle and ice evolution. Icarus 222, 1–19.
- Wordsworth et al. (2017) Wordsworth, R., Y. Kalugina, S. Lokshtanov, A. Vigasin, B. Ehlmann, J. Head, C. Sanders, and H. Wang (2017, January). Transient reducing greenhouse warming on early Mars. Geophys. Res. Lett. 44, 665–671.
- Wordsworth (2016) Wordsworth, R. D. (2016, June). The Climate of Early Mars. Annual Review of Earth and Planetary Sciences 44, 381–408.
- Wordsworth et al. (2015) Wordsworth, R. D., L. Kerber, R. T. Pierrehumbert, F. Forget, and J. W. Head (2015). Comparison of ”warm and wet” and ”cold and icy” scenarios for early Mars in a 3-D climate model. Journal of Geophysical Research E: Planets 120(6), 1201–1219.
- Yoshino et al. (1996) Yoshino, K., J. R. Esmond, Y. Sun, W. H. Parkinson, K. Ito, and T. Matsui (1996, January). Absorption cross section measurements of carbon dioxide in the wavelength region 118.7-175.5 nm and the temperature dependence. J. Quant. Spec. Radiat. Transf. 55, 53–60.
- Zurek (1978) Zurek, R. W. (1978, August). Solar heating of the Martian dusty atmosphere. Icarus 35, 196–208.
Appendix A Supplementary Figures
This appendix presents sample atmospheric profiles calculated using the methods in Section 3.2, to illustrate the application of these methods. Figure 23 shows the T/P profiles associated with a sample atmosphere with varying (pCO2, ), where pCO2 is the surface partial pressure of CO2. Figure 24 shows the pressure, temperature, and H2O molar concentration altitude provides associated with an atmosphere with K and varying pCO2.