Occurrence of radio minihalos in a mass-limited sample of galaxy clusters
Abstract
We investigate the occurrence of radio minihalos — diffuse radio sources of unknown origin observed in the cores of some galaxy clusters — in a statistical sample of 58 clusters drawn from the Planck Sunyaev-Zel’dovich cluster catalog using a mass cut (). We supplement our statistical sample with a similarly-sized non-statistical sample mostly consisting of clusters in the ACCEPT X-ray catalog with suitable X-ray and radio data, which includes lower-mass clusters. Where necessary (for 9 clusters), we reanalyzed the Very Large Array archival radio data to determine if a mihinalo is present. Our total sample includes all 28 currently known and recently discovered radio minihalos, including 6 candidates. We classify clusters as cool-core or non-cool core according to the value of the specific entropy floor in the cluster center, rederived or newly derived from the Chandra X-ray density and temperature profiles where necessary (for 27 clusters). Contrary to the common wisdom that minihalos are rare, we find that almost all cool cores — at least 12 out of 15 (80%) — in our complete sample of massive clusters exhibit minihalos. The supplementary sample shows that the occurrence of minihalos may be lower in lower-mass cool-core clusters. No minihalos are found in non-cool-cores or “warm cores”. These findings will help test theories of the origin of minihalos and provide information on the physical processes and energetics of the cluster cores.
1 Introduction
A striking feature of a number of galaxy clusters is the presence of diffuse synchrotron radiation in the form of large peripheral radio relics and two classes of centrally-located radio sources — Mpc-size giant radio halos and smaller-scale minihalos (see Feretti et al., 2012, for a review). The importance of these extended, steep spectrum111, for , where is the flux density at the frequency and is the radio spectral index. radio sources is nowadays widely recognized as their existence requires magnetic fields and ultra-relativistic electrons to be distributed throughout a large fraction of the cluster volume (e.g., Brunetti & Jones, 2014).
Giant radio halos are associated with unrelaxed clusters (e.g., Cassano et al., 2010, 2013; Kale et al., 2015; Parekh et al., 2015; Cuciti et al., 2015; Yuan et al., 2015) without a central cool core (Rossetti et al., 2013), with a few possible outliers (Bonafede et al., 2014; Kale & Parekh, 2016, Sommer et al. 2017). Minihalos, instead, are typically found in globally relaxed, cool-core clusters (e.g., Gitti et al., 2002; Govoni et al., 2009; Hlavacek-Larrondo et al., 2013; Giacintucci et al., 2014a; van Weeren et al., 2014; Kale et al., 2015; Yuan et al., 2015). Their emission envelops the central active radio galaxy, nearly always found at the center of a cool-core cluster (e.g., Mittal et al. 2009), and extends quite far from it (50–300 kpc), typically filling the cluster cooling region. Minihalos are faint and usually quite amorphous in shape, thus very different from typical extended radio galaxies with lobes and jets. Minihalos also differ from the dying radio galaxies that are sometimes found at the cluster centers, whose extended emission typically has an ultra-steep radio spectrum () and a morphology that somehow preserves the original lobed structure of the active phase, when the source was still fed by the central nucleus (e.g., Saikia & Jamrozy 2009, Murgia et al. 2011, 2012).
Minihalos often appear bounded by one or two X-ray cold fronts (Mazzotta & Giacintucci, 2008; Giacintucci et al., 2014a, b) that result from sloshing of the cool gas in the central core (e.g., Ascasibar & Markevitch, 2006). Based on this coincidence, it has been proposed that minihalos arise from the reacceleration of seed relativistic electrons in the magnetized cool core (Gitti et al. 2002, 2004) by sloshing-induced turbulence (Mazzotta & Giacintucci, 2008; ZuHone et al., 2013; Giacintucci et al., 2014b). Numerical simulations show that sloshing motions can amplify magnetic fields and develop turbulence in the area enclosed by the cold fronts, which may lead to the generation of diffuse radio emission confined to the sloshing region (ZuHone et al., 2013). A recent direct measurement of the gas velocities in the Perseus cool core with the Hitomi X-ray satellite revealed the presence of turbulence sufficient for the above scenario, and possibly for balancing the radiative cooling in the core (Hitomi Collaboration et al., 2016). An alternative explanation of minihalos is hadronic models (e.g., Pfrommer & Ensslin 2004; Fujita et al. 2007; Zandanel et al. 2014), where the radio-emitting electrons are generated through the interaction of cosmic ray (CR) protons with the thermal protons in the intracluster medium. Both turbulence and CR protons should also contribute to balancing the radiative cooling in the cluster cores (e.g., Zhuravleva et al., 2014; Fujita & Ohira, 2011; Guo & Oh, 2008; Jacob & Pfrommer, 2017a). Thus the relation between radio minihalos and cool cores may exist at a fundamental level (e.g., Bravi et al. 2016, Fujita & Ohira 2013), making these radio phenomena important for understanding the physics of cool cores.
The study of minihalos has been limited by their small number (e.g., Gitti et al., 2004; Cassano et al., 2008; Govoni et al., 2009), with only about 10 confirmed detections as of 2011 (Feretti et al., 2012). The number of known minihalos has then rapidly increased, with 22 confirmed detections222The former minihalo in A 2390 (Bacchi et al. 2003) is excluded because it was recently found to be larger (Sommer et al. 2017), borderline between giant halos (as defined in Cassano & Brunetti 2005) and minihalos. We note that this cluster has an unusually large cool core (Vikhlinin et al. 2005), comparable in size to the diffuse radio source. and 6 candidates up to date (Hlavacek-Larrondo et al., 2013; Giacintucci et al., 2014a; van Weeren et al., 2014; Kale et al., 2015, Pandey-Pommier et al. 2016), including two new minihalos and one candidate detection that will be presented in a forthcoming paper (Giacintucci et al. 2017, hereafter G17).
The new detections have allowed exploratory investigations of the statistical properties of minihalos and of their host clusters (Giacintucci et al., 2014a; Yuan et al., 2015; Kale et al., 2015; Gitti et al., 2015; Bravi et al., 2016; Jacob & Pfrommer, 2017a, b), that support the association of minihalos with relaxed, cool-core clusters. Furthermore, it has been noted that minihalos tend to be observed in the most massive and hottest clusters with cool cores (Giacintucci et al., 2014a). If true, this observation will provide a constraint to discriminate between different models for the minihalo origin. In a broader context, it can provide information on the energy budget and physical processes in the cluster cool cores, where the radiative cooling is believed to be balanced by some non-gravitational heating source(s) (e.g., McNamara & Nulsen, 2007). The aim of the present work is to quantify this observation in a statistical way. For this purpose, we have selected a complete, mass-limited sample of 75 clusters from the Planck Sunyaev-Zel’dovich (SZ) cluster catalog (Planck Collaboration et al., 2014) and performed an X-ray and radio analysis of the majority of the sample members (77%) that have Chandra data. We complemented this Chandra statistical sample with a large additional sample of 48 clusters in the ACCEPT333Archive of Chandra Cluster Entropy Profile Tables. X-ray catalog (Cavagnolo et al., 2009, hereafter C09), with suitable radio data, plus the Phoenix cluster (SPT-CL J2344-4243, McDonald et al., 2015), for a total of 106 clusters. Where necessary (for 27 clusters), we used the X-ray Chandra data to derive the profiles of gas density, temperature and specific entropy. For those clusters in both samples without published radio observations on the minihalo angular scales, we used archival Very Large Array (VLA) data to investigate the presence of a minihalo and present the results here (no minihalos were detected). We also include in our analysis the 3 new minihalo detections with the Giant Metrewave Radio Telescope that that will be presented in G17. We then compared the cluster mass and X-ray properties with the presence of a minihalo for our mass-limited as well as combined samples.
We adopt a CDM cosmology with H0=70 km s-1 Mpc-1, and . All errors are quoted at the confidence level.
2 Definition of a minihalo
To distinguish minihalos from other diffuse radio phenomena in clusters, such as radio galaxies (in active or dying phase), large radio halos, and relics, we use the following physically-motivated definition. A minihalo is a diffuse radio source at the cluster center with the following properties:
-
1.
The emission does not consist of radio lobes or tails, nor does it show, at any angular resolution, any morphological connection (jets) to the central AGN (such sources would be radio galaxies).
-
2.
The minimum radius of approximately 50 kpc. At smaller radii, diffusion and other transport mechanisms, such as sloshing motions, can plausibly spread the relativistic electrons from the central AGN within their synchrotron radiative cooling time (e.g., see §6.4 in Giacintucci et al. 2014a) without the need for additional physics.
-
3.
The maximum radius of .444 is the radius that encloses a mean overdensity of 500 with respect to the critical density at the cluster redshift. This radius separates two physically distinct cluster regions. Based on X-ray and SZ observations, density, temperature and pressure profiles of the thermal intracluster medium (ICM) outside this radius are self-similar, whereas a large scatter of the ICM profiles is observed at (e.g., McDonald et al. 2017 and references therein). This is caused by the increased importance of non-gravitational processes such as cooling, AGN and stellar feedback in the cores. Thus, diffuse radio emission that is confined within this radius can have a different origin, possibly related to processes in the core, from the emission on a larger scale (halos and peripheral relics). The bulk of the emission of large radio halos originates well outside (e.g., Cassano et al. 2007).
To determine whether a diffuse source fits the above definition we need radio data of a certain minimum quality. For item 1, we need sufficiently high resolution to image the range of scales from few tens of kpc to few kpc in order to determine the morphology of the central radio galaxy and rule out the possibility of the diffuse emission being part of it. It is also needed to discriminate between genuine diffuse emission and a blend of individual radio galaxies in (or projected onto) the core and remove their contribution as well as that of the central radio galaxy. At the same time, for items 2 and 3, sensitive, lower-resolution radio observations with a good sampling of the plane, particularly at short antenna spacings (that correspond to larger angular scales in the sky), are crucial to detect diffuse emission on a larger scale, including the scales beyond our adopted maximum size for the minihalo.
The size of the radio source that we use here is estimated as , where and are the maximum and minimum radii of the surface brightness isocontour (Cassano et al. 2007). It obviously depends on the coverage of the data and the noise level of the image. As detailed in §3, a large fraction of the clusters in our statistical sample have already been reported to have either a large radio halo (well above ) or a non-detection based on high-sensitivity low- and high-resolution images, which is sufficient for our classification purpose. For the remaining clusters (except Perseus and Phoenix), which include all minihalos and ambiguous classifications from the literature, as well as clusters with no published radio images at the needed resolution, we have uniformly analyzed new and archival radio data, with results presented in this paper (§6), Giacintucci et al. (2014a) and G17. The halo sizes come from those analyses. As shown in Appendices A and B, the data used for this paper, while heterogeneous, have sufficient sensitivity and a range of angular resolutions, as well as good sampling of short baselines in the plane, and thus would allow us to detect diffuse emission at the typical brightness on the core scale and, in most cases, at the larger scale of the giant halos. Furthermore, our measured minihalo sizes do not correlate with the signal-to-noise ratio of the radio images (Appendix B). This gives us assurance that the radio extent is not determined by the image sensitivity — the minihalos are intrinsically smaller than halos (see also Murgia et al. 2009). Of course, we cannot rule out the possibility that deeper data would uncover large-scale emission much fainter than the current radio halos in some of the sources that we classify here as minihalos. However, in a few very well-observed minihalos, we do see evidence for an abrupt drop of the radio brightness at a certain radius (Giacintucci et al. 2011, 2014b), which suggests that the minihalo extent has a physical significance.
3 Cluster selection
To quantify the earlier observation that mihihalos are preferentially found in massive cool core systems (Giacintucci et al., 2014a), in this paper we use a combination of two samples. One is a statistically complete, mass-limited sample of massive clusters, while the other is a similarly-sized arbitrary sample of clusters that do not satisfy some of the criteria for the complete sample, but do have high-quality radio and X-ray data and thus can increase the confidence of any correlations that we may find. The latter sample extends to lower masses, which is obviously helpful for investigating any correlation of the minihalo occurrence with the cluster mass. As we will see, the completeness of the sample at lower masses is not critical for the conclusions of this work, while the completeness of the high-mass sample, used for the statistical analysis, is.
| Planck name | Alternative | RAJ2000 | DECJ2000 | Central diffuse | Radio | ||||
|---|---|---|---|---|---|---|---|---|---|
| PSZ1 | name | (h,m,s) | (deg, ) | ( ) | (Mpc) | radio emission | reference | ||
| Clusters with Chandra observations | |||||||||
| G009.0281.22 | A 2744 | 00 14 13.3 | 30 22 31 | 0.307 | 1.35 | halo | 0.6 | 3, 4 | |
| G116.9053.55 | A 68 | 00 36 57.7 | +09 08 37 | 0.255 | 1.19 | no detection | 5 | ||
| G106.8483.24 | A 2813 | 00 43 27.4 | 20 37 27 | 0.292 | 1.34 | no detection | 6 | ||
| G212.9784.04 | A 2895 | 01 18 10.8 | 26 58 28 | 0.228 | 1.19 | no detection | 6 | ||
| G159.8173.47 | A 209 | 01 31 53.4 | 13 34 27 | 0.206 | 1.33 | halo | 0.4 | 7, 8 | |
| G138.3539.80 | RXC J0142.0+2131 | 01 42 11.6 | +21 32 32 | 0.280 | 1.17 | no detection | 9 | ||
| G210.0860.96 | MACS J0257.62209 | 02 57 40.3 | 22 09 46 | 0.322 | 1.22 | halo (c) | 10, 11 | ||
| G164.2038.90 | A 401 | 02 58 54.8 | +13 32 24 | 0.074 | 1.31 | halo | 0.3 | 2, 12 | |
| G223.9160.09 | A 3088 | 03 07 03.2 | 28 40 24 | 0.254 | 1.22 | no detection | 8 | ||
| G171.9640.64 | 03 13 00.3 | +08 22 53 | 0.270 | 1.44 | halo | 0.4 | 13 | ||
| G182.4228.28 | A 478 | 04 13 25.2 | +10 28 19 | 0.088 | 1.32 | minihalo | 0.1 | 14 | |
| G208.8030.67 | A 521 | 04 54 05.0 | 10 13 35 | 0.248 | 1.24 | halo | 0.6 | 15, 16 | |
| G195.7824.29 | A 520 | 04 54 15.9 | +02 57 10 | 0.203 | 1.27 | halo | 0.4 | 17 | |
| G208.5926.00 | RXC J0510.70801 | 05 10 44.3 | 08 01 12 | 0.220 | 1.28 | bad data | 5 | ||
| G215.2926.09 | RXC J0520.71328 | 05 20 47.2 | 13 30 08 | 0.336 | 1.15 | bad data | 18 | ||
| G139.61+24.20 | 06 22 13.9 | +74 41 39 | 0.267 | 1.24 | minihalo (c) | 0.04 | 2 | ||
| G149.75+34.68 | A 665 | 08 30 50.9 | +65 52 01 | 0.182 | 1.34 | halo | 0.5 | 19 | |
| G186.37+37.26 | A 697 | 08 42 59.6 | +36 21 10 | 0.282 | 1.45 | halo | 0.4 | 20, 6, 7 | |
| G239.29+24.75 | A 754 | 09 08 56.2 | 09 40 21 | 0.054 | 1.31 | halo | 0.5 | 21, 12, 22 | |
| G166.11+43.40 | A 773 | 09 18 04.5 | +51 42 15 | 0.217 | 1.26 | halo | 0.4 | 3 | |
| G195.60+44.03 | A 781 | 09 20 16.0 | +30 29 56 | 0.295 | 1.18 | halo (c) | 0.4 | 23, 24 | |
| G135.03+36.03 | RBS 797 | 09 47 00.2 | +76 23 44 | 0.345 | 1.16 | minihalo | 0.1 | 2, 25, 26 | |
| G266.85+25.06 | A 3444 | 10 23 54.8 | 27 17 09 | 0.254 | 1.27 | minihalo | 0.1 | 2, 1, 5, 6 | |
| G149.21+54.17 | A 1132 | 10 58 25.9 | +56 48 09 | 0.137 | 1.24 | no detection | 19 | ||
| G257.13+55.63 | RXC J1115.8+0129 | 11 15 54.9 | +01 29 56 | 0.350 | 1.16 | minihalo (c) | 27 | ||
| G278.58+39.15 | A 1300 | 11 31 55.8 | 19 55 42 | 0.308 | 1.31 | halo | 0.4 | 4, 28, 29 | |
| G139.17+56.37 | A 1351 | 11 42 24.5 | +58 31 41 | 0.322 | 1.21 | halo | 0.4 | 30, 7 | |
| G180.56+76.66 | A 1423 | 11 57 19.9 | +33 36 39 | 0.214 | 1.20 | no detection | 6 | ||
| G229.70+77.97 | A 1443 | 12 01 21.1 | +23 06 31 | 0.269 | 1.27 | halo | 0.5 | 31 | |
| G289.19+72.19 | RXC J1234.2+0947 | 12 34 31.8 | +09 46 23 | 0.229 | 1.19 | halo (c) | 0.3 | 5 | |
| G114.99+70.36 | A 1682 | 13 06 54.9 | +46 31 33 | 0.226 | 1.20 | halo (c) | 0.4 | 32, 4, 33 | |
| G313.33+61.13 | A 1689 | 13 11 26.5 | 01 20 11 | 0.183 | 1.38 | halo | 0.5 | 2, 34 | |
| G323.30+63.65 | A 1733 | 13 27 00.7 | +02 12 14 | 0.259 | 1.24 | no data | |||
| G107.14+65.29 | A 1758a | 13 32 39.5 | +50 32 47 | 0.280 | 1.28 | halo | 0.6 | 4,7 | |
| G092.67+73.44 | A 1763 | 13 35 18.1 | +41 00 10 | 0.228 | 1.32 | no detection | 6 | ||
| G340.37+60.57 | A 1835 | 14 01 02.7 | +02 51 56 | 0.253 | 1.32 | minihalo | 0.18 | 2, 35 | |
| G067.19+67.44 | A 1914 | 14 26 03.9 | +37 49 35 | 0.171 | 1.28 | halo | 0.5 | 12 | |
| G340.94+35.10 | AS 780 | 14 59 30.4 | 18 08 58 | 0.236 | 1.29 | minihalo | 0.04 | 5, 2, 8 | |
| G355.07+46.20 | RXC J1504.10248 | 15 04 05.4 | 02 47 54 | 0.215 | 1.26 | minihalo | 0.11 | 36 | |
| G006.45+50.56 | A 2029 | 15 10 50.8 | +05 44 43 | 0.077 | 1.30 | minihalo | 0.19 | 2, 35 | |
| G346.61+35.06 | RXC J1514.91523 | 15 15 00.4 | 15 21 29 | 0.223 | 1.33 | halo | 0.5 | 37 | |
| G044.24+48.66 | A 2142 | 15 58 25.6 | +27 14 25 | 0.089 | 1.42 | halo | 0.3 | 38, 39 | |
| G006.76+30.45 | A 2163 | 16 15 49.2 | 06 09 09 | 0.203 | 1.68 | halo | 0.7 | 40 | |
| G021.10+33.24 | A 2204 | 16 32 47.8 | +05 35 32 | 0.151 | 1.34 | minihalo | 0.04 | 14 | |
| G097.72+38.13 | A 2218 | 16 35 52.0 | +66 11 44 | 0.171 | 1.24 | halo | 0.3 | 2, 19 | |
| G072.61+41.47 | A 2219 | 16 40 18.6 | +46 41 55 | 0.228 | 1.45 | halo | 0.6 | 12 | |
| G110.99+31.74 | A 2256 | 17 04 08.1 | +78 38 07 | 0.058 | 1.28 | halo | 0.4 | 41, 42 | |
| G049.22+30.84 | RXC J1720.1+2637 | 17 20 12.6 | +26 37 23 | 0.164 | 1.24 | minihalo | 0.1 | 43 | |
| G055.58+31.87 | A 2261 | 17 22 21.9 | +32 07 58 | 0.224 | 1.28 | halo | 0.4 | 44 | |
| G094.00+27.41 | CL 1821+643 | 18 22 00.4 | +64 20 34 | 0.332 | 1.16 | halo | 0.4 | 45, 46 | |
| G018.5425.70 | RXC J2003.52323 | 20 03 32.3 | 23 23 30 | 0.317 | 1.24 | halo | 0.7 | 47 | |
| G053.4236.25 | MACS J2135.20102 | 21 35 10.1 | 01 03 15 | 0.330 | 1.24 | no data | |||
| G055.9534.87 | A 2355 | 21 35 13.6 | +01 25 40 | 0.231 | 1.24 | no data | |||
| G073.9827.83 | A 2390 | 21 53 44.0 | +17 41 35 | 0.233 | 1.38 | halo | 0.3 | 44 | |
| G073.8554.94 | A 2537 | 23 08 28.1 | 02 12 00 | 0.297 | 1.17 | no detection | 6 | ||
| G081.0150.92 | A 2552 | 23 11 36.3 | +03 38 38 | 0.300 | 1.25 | halo (c) | 0.3 | 5 | |
| G087.0357.37 | A 2631 | 23 37 43.7 | +00 16 06 | 0.278 | 1.23 | no detection | 6 | ||
| G034.0376.59 | A 2667 | 23 51 38.3 | 26 04 45 | 0.226 | 1.24 | minihalo | 0.05 | 2 | |
| Clusters without Chandra observations | |||||||||
| G092.1066.02 | A 2697 | 00 03 05.5 | 06 05 26 | 0.232 | 1.19 | no detection | 8 | ||
| G110.0870.23 | A 56 | 00 34 01.6 | 07 47 45 | 0.300 | 1.17 | no data | |||
| G114.3460.16 | RXC J0034.4+0225 | 00 34 23.6 | +02 25 14 | 0.350 | 1.17 | no data | |||
| G142.1853.27 | A 220 | 01 37 22.0 | +07 52 31 | 0.330 | 1.19 | no data | |||
| G222.9765.69 | A 3041 | 02 41 27.6 | 28 38 51 | 0.232 | 1.19 | no data | |||
| G205.0762.94 | 02 46 27.6 | 20 32 05 | 0.310 | 1.24 | no detection | 48 | |||
| G176.2552.57 | A 384 | 02 48 13.1 | 02 14 21 | 0.236 | 1.21 | no data | |||
| G172.93+21.31 | 07 07 37.2 | +44 19 23 | 0.331 | 1.15 | no data | ||||
| G169.64+33.84 | 08 16 42.5 | +49 31 48 | 0.347 | 1.15 | no data | ||||
| G227.55+54.88 | ZwCl 1028.8+1419 | 10 31 21.1 | +14 06 19 | 0.305 | 1.16 | no data | |||
| G288.26+39.94 | RXC J1203.22131 | 12 03 14.4 | 21 33 02 | 0.192 | 1.28 | no data | |||
| G304.76+69.84 | 12 53 58.8 | +06 58 40 | 0.346 | 1.15 | no data | ||||
| G309.46+37.32 | RXC J1314.42515 | 13 14 23.1 | 25 15 09 | 0.244 | 1.19 | halo | 0.3 | 8,49 | |
| G068.32+81.81 | RXC J1322.8+3138 | 13 22 48.0 | +31 39 06 | 0.308 | 1.19 | no data | |||
| G019.12+31.23 | 16 36 29.4 | +03 08 51 | 0.280 | 1.23 | no data | ||||
| G049.8325.22 | RXC J2051.1+0216 | 20 51 20.3 | +02 16 40 | 0.321 | 1.15 | no data | |||
| G084.2035.49 | A 2472 | 22 42 20.6 | +17 29 17 | 0.314 | 1.16 | no data | |||
Note. — Column 1: Plank cluster name. Column 2: alternative name. Columns 3–6: cluster coordinates, redshift and mass from Planck collaboration et al. (2014). Column 7: , derived from . Column 8: type of diffuse radio emission at the cluster center (c indicates a candidate detection). As defined in §2, sources with are classified as minihalos. Column 9: radius of the central diffuse radio source, as defined in §2, in units of . Column 10: radio references. If more than one reference is given, the first one is the reference for the image used to measure the radio size. Reference code: (1) this work, (2) G17, (3) Govoni et al. (2001), (4) Venturi et al. (2013), (5) Kale et al. (2015), (6) Venturi et al. (2008), (7) Giovannini et al. (2009), (8) Venturi et al. (2007), (9) Kale et al. (2013), (10) Venturi et al., in preparation, (11) Bonafede et al., (private communication), (12) Bacchi et al. (2013), (13) Giacintucci et al. (2013), (14) Giacintucci et al. (2014a), (15) Brunetti et al. (2008), (16) Dallacasa et al.(2209), (17) Vacca et al. (2014), (18) Macario et al. (2014), (19) Giovannini & Feretti (2000), (20) Macario et al. (2011), (21) Macario et al. (2011), (22) Kassim et al. (2001), (23) Govoni et al. (2011), (24) Venturi et al. (2011a), (25) Gitti et al. (2006), (26) Doria et al. (2012), (27) Pandey-Pommier et al. (2016), (28) Reid et al. (1999), (29) Parekh et al. (2017), (30) Giacintucci et al. (2009a), (31) Bonafede et al. (2015), (32) Venturi et al. (2011b), (33) Macario et al. (2013), (34) Vacca et al. (2011), (35) Govoni et al. (2009), (36) Giacintucci et al. (2011a), (37) Giacintucci et al. (2011b), (38) Venturi et al. (2017), (39) Farnsworth et al. (2013), (40) Feretti et al. (2001), (41) Brentjens (2008), (42) Clarke & Ensslin (2006), (43) Giacintucci et al. (2014b), (44) Sommer et al. (2017), (45) Bonafede et al. (2014), (46) Kale & Parekh (2016), (47) Giacintucci et al. (2009b), (48) Ferrari et al., (private communication), (49) Feretti et al. (2005).
3.1 Statistical sample
A complete essentially mass-limited cluster sample can be extracted from the Planck SZ cluster catalog, since the cluster total SZ signal is a good proxy for the total mass (e.g., Nagai, 2006). We selected all clusters with redshift , Galactic latitude and the Planck-estimated total mass within of . This mass cut is well above the Planck completeness limit and, along with the cut, is a compromise between the need to cover a range of cluster masses and the availability of the radio and X-ray data. We also imposed a cut in declination of DEC to ensure good visibility from the VLA and GMRT, whose observations we use to investigate the presence of diffuse radio emission at the cluster center. Finally, we excluded the double cluster A 115; its total mass inferred by Planck is (so above our mass limit), however, based on optical and X-ray estimates of the cluster mass ratio (Barrena et al., 2007; White et al., 1997), the mass of each individual cluster falls below our mass threshold.
Our final Planck sample contains 75 clusters, listed in Table 1. This is essentially the same sample, apart from slightly different selection criteria, as that used by Cuciti et al. (2015) to study the occurrence of giant radio halos in clusters. Chandra X-ray observations are currently available for 58 (77%) of these clusters; hereafter we will refer to these clusters as the Chandra statistical sample. 53 of these clusters () have published accurate radio measurements from deep Westerbork Synthesis Radio Telescope (WSRT), VLA, and/or GMRT observations (Table 1), most of the latter taken as part of the GMRT Radio Halo Survey and its extension (Venturi et al. 2007, 2008, Kale et al. 2013, 2015). Two of the remaining clusters — RXC J0510.7–0801 and RXC J0520.7–1328 — have pointed GMRT observations; however, the resulting images are not sensitive enough to investigate the presence of diffuse radio emission in these systems (Kale et al., 2015; Macario et al., 2014). We will see in §7 that these two clusters, along with those with no available radio data (A 1733, MACS J2135.2-0102 and A 2355), do not possess a cool core and the absence of radio information will not affect our main findings that are based on the cool-core part of the sample.
Our statistical sample (Table 1) contains 12 minihalos, of which 9 are previously known and three — A 2667, PSZ1 G139.61+24.2 (candidate) and RXC J1115.8+0129 (candidate) — are new detections. The former two are reported in the forthcoming paper G17 and the latter in Pandey-Pommier et al. (2016). The sample includes 26 radio-halo clusters and 5 candidates. Many of the clusters also contain peripheral radio relics, which is a distinct phenomenon (e.g., van Weeren et al., 2010) and we do not discuss it in this paper.
Among the 17 clusters in our Planck sample that do not have Chandra data (Table 1), 11 have XMM-Newton observations. However, most of them do not have high-sensitivity radio data at present. We inspected the XMM-Newton images and found that only 3 out of 11 can possibly have cool cores, thus omitting them does not significantly affect our statistical conclusions.
3.2 Supplementary sample
We supplement our statistical sample with additional 48 clusters drawn from ACCEPT, which includes clusters observed with Chandra as of 2008 and presents uniform X-ray analysis for them (C09), suitable for our work. The clusters were required to have deep, pointed VLA, WSRT and GMRT observations in the literature and/or in the data archives (see §6), be at , DEC and an average temperature of keV. This temperature cut corresponds to a lower total mass ( , based on an relation, Vikhlinin et al. 2009) than the lower limit of our statistical sample. To those clusters we add the Phoenix cluster (), which hosts the most distant minihalo found to date (van Weeren et al., 2014). This supplementary sample is given in Table 2. Twelve of these clusters possess a minihalo, including a recent GMRT detection in A907 (G17), and 4 host a candidate minihalo. The presence of a central diffuse radio source has been reported in 3 more clusters in this sample — ZwC 1742.1+3306, MACS J1931.8–2634 (Giacintucci et al. 2014a) and A 2626 (Gitti 2013) — but their classification as a minihalo is uncertain: the size ( kpc in A 2626 and ZwC 1742.1+3306), radio morphology and ultra-steep spectrum () of these sources, as well as the possible association with X-ray cavities in MACS J1931.8–2634, suggest that they could instead be dying/restarted radio galaxies (Giacintucci et al. 2014a), whose aged emission, no longer fed by the central nucleus, is rapidly fading. For 9 clusters with no published radio results on the minihalo angular scales, we analyzed VLA archival observations (§6) and present the results here (no minihalos were detected among them).
Our final combined sample (statistical + supplementary) consists of 106 clusters and includes all 28 known minihalos, including 6 candidates.
| Cluster | Planck name | RAJ2000 | DECJ2000 | Central diffuse | Radio | ||||
|---|---|---|---|---|---|---|---|---|---|
| name | PSZ1 | (h,m,s) | (deg, ) | ( ) | (Mpc) | radio emission | reference | ||
| Z348 | 01 06 50.3 | +01 03 17 | 0.255 | 0.88 | no detection | 3 | |||
| A 119 | G125.6864.12 | 00 56 14.5 | 01 16 55 | 0.044 | 1.04 | no detection | 4 | ||
| A 141 | G175.5985.95 | 01 05 34.6 | 24 38 00 | 0.230 | 1.08 | no detection | 3 | ||
| A 193 | G136.9053.31 | 01 24 59.4 | +08 38 43 | 0.049 | 0.85 | no detection | 1 | ||
| A 267 | G153.0758.27 | 01 52 41.9 | +00 58 01 | 0.227 | 1.11 | no detection | 3 | ||
| MACS J0159.8-0849 | G167.6365.57 | 01 59 54.5 | 08 50 14 | 0.405 | 1.16 | minihalo | 0.1 | 5, 2 | |
| A 383 | G177.6453.52 | 02 47 46.5 | 03 29 56 | 0.188 | 1.09 | no detection | 1 | ||
| A 399 | G164.3139.43 | 02 57 52.7 | +13 04 11 | 0.072 | 1.20 | halo | 0.25 | 6 | |
| Perseus | 03 19 47.2 | +41 30 47 | 0.018 | 1.28 | minihalo | 0.1 | 7, 8, 9 | ||
| MACS J0329.6-0211 | 03 29 41.5 | 02 11 46 | 0.450 | 1.02 | minihalo | 0.1 | 2, 5 | ||
| 2A 0335+096 | G176.3035.06 | 03 38 44.4 | +09 56 34 | 0.035 | 0.92 | minihalo | 0.1 | 2, 10 | |
| MACS J0417.5-1154 | G205.9439.46 | 04 17 36.2 | 11 54 12 | 0.443 | 1.37 | halo | 0.3 | 11 | |
| MACS J0429.6-0253 | 04 29 36.0 | 02 53 08 | 0.399 | 0.98 | no detection | 1 | |||
| RX J0439.0+0715 | G189.5225.10 | 04 39 01.2 | +07 15 36 | 0.244 | 1.16 | no detection | 3 | ||
| MS 0440.5+0204 | 04 43 09.7 | +02 10 19 | 0.190 | 1.13 | no detection | 1 | |||
| A 611 | G184.70+28.92 | 08 01 01.7 | +36 05 06 | 0.288 | 1.15 | no detection | 4 | ||
| MS 0839.8+2938 | 08 42 55.9 | +29 27 26 | 0.194 | 1.00 | no detection | 1 | |||
| Z 2089 | 09 00 37.9 | +20 54 58 | 0.235 | 0.96 | no detection | 3, 4 | |||
| ZwCl 2701 | 09 52 49.2 | +51 53 05 | 0.214 | 1.04 | no detection | 3, 4 | |||
| A 907 | G249.38+33.27 | 09 58 22.2 | 11 03 35 | 0.167 | 1.16 | minihalo | 0.05 | 2 | |
| ZWCL 3146 | 10 23 39.6 | +04 11 10 | 0.291 | 1.20 | minihalo | 0.07 | 12, 5 | ||
| A 1068 | G179.13+60.14 | 10 40 48.7 | +39 56 05 | 0.137 | 1.03 | minihalo (c) | 0.10 | 13 | |
| A 1204 | 11 13 32.2 | +17 35 40 | 0.171 | 0.89 | no detection | 1 | |||
| A 1240 | 11 23 32.1 | +43 06 32 | 0.159 | 0.92 | no detection | 14 | |||
| A 1413 | G226.19+76.78 | 11 55 19.4 | +23 24 26 | 0.143 | 1.22 | minihalo (c) | 0.09 | 13 | |
| A 1576 | G125.72+53.87 | 12 36 48.9 | +63 10 40 | 0.302 | 1.16 | no detection | 3 | ||
| A 1650 | G306.71+61.04 | 12 58 45.6 | 01 46 11 | 0.085 | 1.09 | no detection | 13 | ||
| RX J1347.5–1145 | G324.05+48.79 | 13 47 33.5 | 11 45 42 | 0.452 | 1.32 | minihalo | 0.2 | 2, 15, 16 | |
| A 1795 | G033.84+77.17 | 13 48 55.0 | +26 36 01 | 0.062 | 1.15 | minihalo (c) | 0.09 | 5 | |
| A 1995 | G096.87+52.48 | 14 52 56.4 | +58 03 35 | 0.318 | 1.09 | halo | 0.3 | 17 | |
| MS 1455.0+2232 | 14 57 15.1 | +22 20 34 | 0.258 | 0.98 | minihalo | 0.1 | 2, 4, 18 | ||
| A 2034 | G053.52+59.52 | 15 10 12.6 | +33 29 21 | 0.113 | 1.16 | halo | 0.3 | 17 | |
| RX J1532.9+3021 | 15 32 53.8 | +30 20 58 | 0.363aaCrawford et al. (1999). | 1.04 | minihalo | 0.10 | 5, 3, 19 | ||
| A 2111 | G054.99+53.42 | 15 39 34.9 | +34 25 46 | 0.229 | 1.15 | no detection | 4 | ||
| A 2125 | 15 40 58.3 | +66 18 28 | 0.247 | 0.76 | no detection | 1 | |||
| Ophiuchus | 17 12 25.9 | 23 22 33 | 0.028 | 1.62 | minihalo | 0.15 | 2, 13, 20 | ||
| A 2255 | G093.93+34.92 | 17 12 48.4 | +64 04 03 | 0.081 | 1.19 | halo | 0.7 | 21, 22, 23 | |
| RX J1720.2+3536 | G059.51+33.06 | 17 20 20.6 | +35 37 42 | 0.387 | 1.12 | minihalo (c) | 0.18 | 24 | |
| ZwCl 1742.1+3306 | G057.91+27.62 | 17 44 19.6 | +32 59 19 | 0.076 | 0.95 | uncertain | 0.04 | 5 | |
| A 2319 | G075.71+13.51 | 19 21 09.6 | +43 58 30 | 0.056 | 1.42 | halo | 0.4 | 25, 26, 27 | |
| MACS J1931.8-2634 | G012.5820.07 | 19 31 46.0 | -26 33 51 | 0.352 | 1.15 | uncertain | 0.1 | 5, 28 | |
| RX J2129.6+0005 | G053.6534.49 | 21 29 42.5 | +00 04 51 | 0.235 | 1.06 | minihalo | 0.08 | 12, 2 | |
| A 2420 | G046.4849.42 | 22 10 12.9 | 12 09 51 | 0.085 | 1.13 | no detection | 1 | ||
| MACS J2228.5+2036 | G083.3031.01 | 22 28 29.1 | +20 38 22 | 0.412 | 1.21 | no detection | 4, 11 | ||
| MACS J2245.0+2637 | 22 45 04.7 | +26 38 04 | 0.304 | 1.07 | no detection | 29 | |||
| A 2556 | 23 13 00.9 | 21 37 55 | 0.087 | 0.92 | no detection | 1 | |||
| A 2626 | 23 36 30.3 | +21 08 33 | 0.055 | 0.93 | uncertain | 0.03 | 30 | ||
| PhoenixbbSPT-CL J2344-4243: coordinates, redshift and mass are from McDonald et al. (2015) and references therein. | 23 44 42.2 | 42 43 08 | 0.597 | 1.32 | minihalo | 0.17 | 31 |
Note. — Column 1: cluster name. Column 2: Planck name. Columns 3–5: cluster coordinates and redshift from Planck collaboration et al. (2014) for the Planck clusters and NASA/IPAC Extragalactic Database for the others. Column 6: cluster mass from Planck collaboration et al. (2014). Values marked with ⋆ were estimated from the relation of Vikhlinin et al. (2009) using the core-excised temperatures in Table 6; errors were calculated from the temperature uncertainties and include statistical and systematic uncertainties for the relation itself (§4). Column 8: , derived from . Column 7: type of diffuse radio emission at the cluster center (c indicates a candidate detection). As defined in §2, sources with are classified as minihalos. Clusters marked as uncertain host central extended radio sources whose classification as a minihalo is uncertain; the radio size, morphology and ultra-steep spectrum of these sources suggest that they could be instead dying/restarted radio galaxies (§3.2; Giacintucci et al. 2014a). Column 9: radius of the central diffuse radio source, as defined in §2, in units of . Column 10: Radio references. If more than one reference is given, the first one is the reference for the image used to measure the radio size. Reference code: (1) this work, (2) G17, (3) Kale et al. (2013), (4) Venturi et al. (2008), (5) Giacintucci et al. (2014a), (6) Murgia et al. (2010a), (7) Sijbring (1993), (8) Burns et al. 1992, (9) Gendron-Marsolais et al. (2017), (10) Sarazin et al. (1995), (11) Parekh et al. (2017), (12) Kale et al. (2015), (13) Govoni et al. (2009), (14) Bonafede et al. (2009), (15) Gitti et al. (2007), (16) Ferrari et al. (2011), (17) Giovannini et al. (2009), (18) Mazzotta & Giacintucci (2008), (19) Hlavacek-Larrondo et al. (2013), (20) Murgia et al. (2010b), (21) Pizzo & de Bruyn (2009), (22) Govoni et al. (2005), (23) Feretti et al. (1997a), (24) Giacintucci et al. (2014b), (25) Storm et al. (2015), (26) Farnsworth et al. (2013), (27) Feretti et al. (1997b), (28) Ehlert et al. (2011), (29) Venturi et al., in preparation, (30) Gitti (2013), (31) van Weeren et al. (2014).
4 Cluster X-ray properties
The purpose of this study is to quantify the occurrence of radio minihalos in clusters of different total masses with and without cool cores. To identify cool-core clusters in the sample, we follow C09 and use the specific entropy “floor” in the cluster centers. They find that the radial dependence of the specific entropy, defined in C09 and here as
| (1) |
where T is the gas temperature and is the electron number density, can be described, in the cluster central regions, as a function of radius, , by
| (2) |
where is the so-called core entropy, is a normalization for entropy at 100 kpc, and is the power-law index.
Clusters with keV cm2 (which represents a deep minimum of the entropy at the cluster center) invariably exhibit all the attributes of a cool core. For the cluster entropy profiles in the ACCEPT database, C09 combined projected gas temperatures with 3-dimensional gas densities, which does not yield physically meaningful entropy values. However, their values serve our current purpose of identifying the cool cores well, and have been used for similar purposes in the literature. Therefore, for the present analysis, we chose to use the values from C09 for those clusters that already had high-quality Chandra data (81 out of 106 clusters in our combined sample), and emulate the C09 derivation (with some technical differences) for the 27 clusters with new or significantly-improved Chandra data that appeared since C09. This will be described in §5.5.
For cluster total masses, we use the Planck SZ-based estimates where available, otherwise we obtain a mass estimate from the relation in Vikhlinin et al. (2009), using an X-ray measured, core-excised temperature. estimates are required for 17 out of 48 clusters (35%) in the supplementary sample. Core-excised temperatures are taken from Cavagnolo et al. (2008, hereafter C08) if available, otherwise we derive them here (§5.4) in the same manner for uniformity. Errors for those masses are calculated from the temperature statistical uncertainties and include statistical and systematic uncertainties for the relation itself, as estimated by Vikhlinin et al. (2009).
5 CHANDRA data analysis
The ACCEPT sample of C09 contains clusters in the Chandra archive as of 2008. Since then, Chandra observed new clusters, e.g., those in our statistical sample that were discovered by Planck (2 clusters), and reobserved others, including several borderline clusters (“warm cores”) for which it is important for us to have an accurate core temperature profile. Here, we have analyzed Chandra data for such new clusters and important improvements. Seven of the new observations are part of the Chandra Visionary Program to study the X-ray properties of Planck-selected clusters, including the fraction of cool cores (Andrade-Santos et al. 2017).
We will use C08 and C09 entropy and temperature values for those clusters that have been reobserved but for which the old data were accurate enough. Updates of Chandra calibration since C08 and C09 have negligible effects for our current qualitative purposes.
5.1 Data reduction and image preparation
The Chandra observations analyzed in this paper are listed in Table 3, which includes the observation identifiers, clean exposure times and the adopted Galactic absorption column density (§5.3). The Level-1 ACIS event files from the archive were reprocessed following the procedure described in Vikhlinin et al. (2005) using the Chandra Calibration Database (CALDB) 4.6.3. Exclusion of time intervals with elevated background and background modeling were done as described in Markevitch et al. (2003). To model the detector and sky background, we used the blank-sky datasets from the CALDB appropriate for the date of each observation, normalized using the ratio of the observed to blank-sky count rates in the 9.5–12 keV band. Following Markevitch et al. (2000), we also subtracted the ACIS readout artifact, which is an important effect on the radial temperature profiles in the presence of a sharp brightness peak.
We used images in the 0.5–4 keV and 2–7 kev energy bands to detect the unrelated X-ray point sources and small-scale extended sources in each observation. These sources were masked from the image and spectral analysis. For each cluster, we need to extract and fit a radial surface brightness profile and a radial temperature profile.
| Cluster name | Observation | Detector | Exposure | |
|---|---|---|---|---|
| ID | (ACIS) | (ksec) | ( cm-2) | |
| A 2813 | 9409 | I | 20.0 | |
| A 2895 | 9429 | I | 19.7 | |
| RXC J0142.0+2131 | 10440 | I | 20.0 | |
| A 401 | 14024 | I | 111.5 | |
| A 3088 | 9414 | I | 19.2 | |
| PSZ1 G171.96-40.64 | 15302 | I | 25.9 | |
| RXC J0510.7-0801 | 14011 | I | 20.7 | |
| PSZ1 G139.61+24.20 | 15139,15297 | I, I | 17.9,9.3 | |
| A 781 | 15128 | I | 33.7 | |
| A 3444 | 9400 | S | 36.3 | |
| A 1132 | 13376 | I | 9.1 | |
| A 1351 | 15136 | I | 32.9 | |
| A 1423 | 11724 | I | 25.7 | |
| A 1443 | 16279 | I | 18.9 | |
| RXC J1234.2+0947 | 11727 | I | 20.7 | |
| A 1682 | 11725 | I | 19.7 | |
| A 1689 | 6930, 7289 | I, I | 76,75 | |
| A 1733 | 11771 | I | 6.7 | |
| AS 780 | 9428 | S | 39.4 | |
| RXC J1504.1–0248 | 17197,17669,17670 | I, I, I | 29.8,28.5,44.6 | |
| RXC J1514.9-1523 | 15175 | I | 59.1 | |
| A 2142 | 5005,15186 | I, S | 39.4,87.1 | |
| CL 1821+643 | 9398 | S | 34.2 | |
| RXC J2003.5-2323 | 7916 | I | 50.0 | |
| MACS J2135.2-0102 | 11710 | I | 26.9 | |
| A 2355 | 15097 | I | 14.5 | |
| A 2552 | 11730 | I | 22.8 | |
| A 2667 | 2214 | S | 9.3 | |
| Z348 | 10465 | S | 48.7 | |
| A 141 | 9410 | I | 19.7 | |
| Z2089 | 10463 | S | 40.4 | |
| A 1240 | 4961 | I | 51.8 | |
| A 1413 | 5002 | I | 37.1 | |
| A 1576 | 15127 | I | 28.8 | |
| A 1650 | 7242 | I | 37.6 | |
| ZwCl 1742.1+3306 | 8267 | I | 7.8 | |
| RX J2129.6+0005 | 9370 | I | 29.8 | |
| A 2420 | 8271 | I | 7.8 | |
| A 2626 | 3192 | S | 24.9 | |
| Phoenix | 16545 | I | 59.9 |
Note. — Column 1: cluster name. Column 2: observation identification number. Column 3: Chandra ACIS detector. Column 4: Total clean exposure. Column 5: Galactic absorption column density adopted in this paper; values marked with ⋆ are from LAB (§5.3).
5.2 Gas density profiles
For each cluster, we obtained a background-subtracted, exposure-corrected image in the 0.7–2 keV band. For clusters with multiple (typically offset) ACIS observations, we first coadded the individual background-subtracted images and then divided the counts images by the sum of the corresponding exposure maps. We then extracted radial surface brightness profiles, centered on the cluster X-ray centroid.
While a simple spherically-symmetric -model for the gas density (Cavaliere & Fusco-Femiano, 1978) is a reasonable description for non-cool-core clusters, it does not describe cool cores well (e.g., Jones & Forman, 1984). We therefore fit the brightness profiles by projecting a spherically-symmetric double -model,
| (3) |
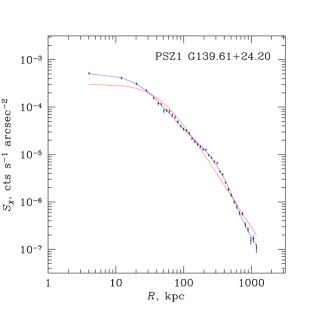
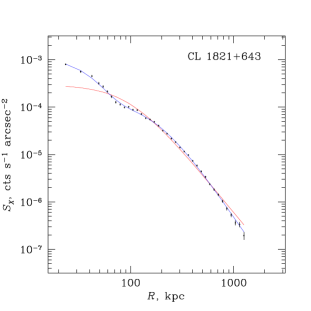
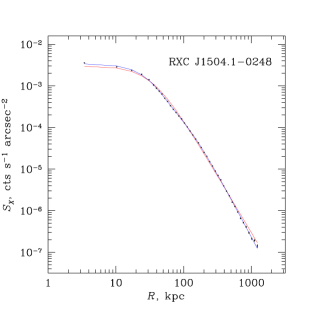
where (central density for the sum of the two components), , , , , and were free parameters. We ignore the very mild temperature dependence of the X-ray emissivity in this Chandra band and the relevant range of temperatures. Fits to the brightness profile were done out to or as far in radius as the Chandra coverage allowed, which in all cases was far beyond the cores. While such a model is not physically motivated (and no physical significance should be assigned to the particular values of and ), it fits all our clusters well, which is what we need for determining the central entropy. For those clusters where a single -model provided a good fit, we set . Example cool-core fits with single and double -models are shown in Fig. 1, and fit results for all clusters are given in Table 4. We do not derive errors on best-fit quantities, because statistical errors are negligible and uncertainties of the geometry dominate. The entropy uncertainties will be dominated by the temperature accuracy.
5.3 Spectral analysis
We derived the intracluster medium temperatures using the Chandra data as follows. For each observation, we extracted a spectrum of the cluster for each region of interest, and generated the instrument responses (ARF and RMF) using the current calibration files (version N0008 for the telescope effective area, N0006 for the CCD quantum efficiency, and N0009 for the ACIS time-dependent low-energy contamination model).
The background spectra were extracted for the same regions from the corresponding blank-sky datasets, normalized as in §5.1. To ensure the sky-variable soft cosmic X-ray background is subtracted correctly, we checked for the presence of significant excess/deficit of soft X-ray thermal emission in the spectrum using local background regions. In those cases where significant systematic residuals were found, they were modeled with a low-temperature APEC or absorbed power-law and then included as a fixed additional background component in the spectral fits, normalized by the region area, as in Vikhlinin et al. (2005). This has little effect in the cores, but affects the fits in the outskirts.
The cluster X-ray emission was modeled with an absorbed, single-temperature APEC model in the the 0.7–7 keV energy band, with the metal abundance free to vary. For the full-cluster spectra, the absorption column density was allowed to vary. If the best-fit value was consistent with that from the Leiden/Argentine/Bonn (LAB) radio survey of Galactic HI (Kalberla et al., 2005), we fixed it at the database value for subsequent analysis. The adopted values are listed in Table 3
For several clusters, we combined multiple Chandra observations (Table 3) by fitting their spectra simultaneously with the temperature and metal abundance of the hot APEC components tied together. For RXC J1504.1-0248, for which the observations had the same pointing position and roll angle and thus had the same responses, we instead coadded the spectra.
| Cluster name | ||||||
|---|---|---|---|---|---|---|
| ( cm-3) | (kpc) | (kpc) | ||||
| A 2895 | 5.6 | 212 | 0.7 | … | … | 0 |
| RXC J0142.0+2131 | 16.1 | 32 | 0.6 | 212 | 0.7 | 0.50 |
| A 401 | 8.6 | 51 | 0.3 | 277 | 1.1 | 0.65 |
| PSZ1G171.96-40.64 | 11.4 | 183 | 3.0 | 376 | 0.8 | 0.73 |
| RXC J0510.7-0801 | 8.9 | 143 | 1.2 | 647 | 1.1 | 0.40 |
| PSZ1 G139.61+24.20 | 77.3 | 22 | 0.5 | 804 | 3.0 | 0.03 |
| A 781 | 4.2 | 237 | 2.3 | 644 | 0.9 | 0.66 |
| A 3444 | 77.9 | 37 | 0.7 | 190 | 0.6 | 0.07 |
| A 1132 | 4.3 | 256 | 0.7 | … | … | 0 |
| A 1351 | 3.0 | 683 | 1.4 | … | … | 0 |
| A 1423 | 18.5 | 56 | 0.6 | 422 | 0.6 | 0.05 |
| A 1443 | 4.3 | 276 | 0.6 | … | … | 0 |
| RXC J1234.2+0947 | 1.6 | 549 | 0.8 | … | … | 0 |
| A 1682 | 6.4 | 156 | 3.0 | 329 | 0.8 | 0.81 |
| A 1689 | 34.3 | 123 | 3.0 | 184 | 0.7 | 0.44 |
| A 1733 | 5.1 | 176 | 0.6 | … | … | 0 |
| AS 780 | 86.5 | 21 | 0.5 | … | … | 0 |
| RXC J1504.10248 | 170.2 | 68 | 3.0 | 75 | 0.7 | 0.41 |
| RXC J1514.91523 | 2.0 | 592 | 0.8 | … | … | 0 |
| A 2142 | 27.6 | 90 | 3.0 | 139 | 0.6 | 0.81 |
| CL 1821+643 | 80.5 | 86 | 3.0 | 186 | 0.7 | 0.18 |
| RXC J2003.52323 | 2.2 | 698 | 1.0 | … | … | 0 |
| MACS J2135.20102 | 5.6 | 191 | 0.6 | … | … | 0 |
| A 2355 | 2.1 | 615 | 1.0 | … | … | 0 |
| A 2552 | 18.1 | 54 | 0.7 | 238 | 0.7 | 0.40 |
| Z348 | 75.2 | 33 | 0.7 | … | … | 0 |
| Phoenix | 209.4 | 34 | 0.6 | … | … | 0 |
Note. — Column 1: cluster name. Columns 2–7: parameters of a -model fit, see eq. (3). Fits were done out to or as far in radius as the Chandra coverage allowed, which in all cases was far beyond the core region.
5.4 Average cluster temperatures
One of the quantities that we correlate with the presence of a radio halo is the global cluster temperature. In addition, for those clusters in the supplementary sample that do not have Planck masses, we estimate total masses from the relation (§4). For 29 clusters in the statistical sample and for most in the supplementary one, we used core-excised global temperatures from C08. For the remaining clusters in the supplementary sample and for 12 in the statistical one with significantly better recent Chandra observations, we derived global temperatures (§5.3) using a spectrum extracted from an annulus with 70 kpc555 is the radius that encloses a mean overdensity of 2500 with respect to the critical density at the cluster redshift. as in C08. The core-excised temperatures, , of all clusters are summarized in Tables 6 and 7. The exceptions are 2A0335+096, Perseus and Ophiuchus, for which we used average temperatures from ASCA666Advanced Satellite for Cosmology and Astrophysics. because of Chandra’s limited radial coverage. Another nearby cluster for which we used the total temperature from the literature is A193, a clear non-cool-core cluster, for which core excision would not change the temperature significantly. For cool cores, this should result in slightly underestimated masses from the relation. This will not affect our qualitative conclusions.
| Cluster | ||||||||||
|---|---|---|---|---|---|---|---|---|---|---|
| name | (keV) | (Mpc) | (kpc) | (keV cm2) | (keV cm2) | (Mpc) | ||||
| A 2895 | 11.1 | 0.3 | 1.0⋆ | … | … | 106 | 1.0 | 1.4 | ||
| RXC J0142.0+2131 | 7.5 | 1.9 | 0.0⋆ | 1.0⋆ | … | … | 90 | 1.2 | 1.8 | |
| A 401 | 7.9 | 3.1 | 0.0⋆ | 1.0⋆ | … | … | 82 | 1.3 | 1.0 | |
| PSZ1G171.9640.64 | 11.6 | 0.9 | 0.0⋆ | 1.0⋆ | … | … | 42 | 1.4 | 2.0 | |
| RXC J0510.70801 | 9.2 | 1.0 | 0.0⋆ | 1.0⋆ | … | … | 129 | 0.9 | 1.0 | |
| PSZ1 G139.61+24.20 | 13.8 | 0.4 | 0.0⋆ | 0.04 | 62 | 0.8 | 186 | 1.1 | 0.1 | |
| A 781 | 8.2 | 1.0 | 0.0⋆ | 1.0⋆ | … | … | 196 | 0.7 | 1.8 | |
| A 3444 | 12.6 | 0.8 | 0.0⋆ | 0.31 | 299 | 1.1 | 100 | 1.3 | 0.5 | |
| A 1132 | 9.5 | 0.4 | 1.0⋆ | … | … | 111 | 0.9 | 1.1 | ||
| A 1351 | 13.4 | 0.6 | 0.0⋆ | 1.0⋆ | … | … | 3 | 2.6 | 1.3 | |
| A 1423 | 9.7 | 0.6 | 1.0⋆ | … | … | 170 | 1.0 | 1.2 | ||
| A 1443 | 8.7 | 5.0 | 0.0⋆ | 1.0⋆ | … | … | 61 | 1.4 | 1.6 | |
| RXC J1234.2+0947 | 6.5 | 0.9 | 0.0⋆ | 1.0⋆ | … | … | 23 | 1.3 | 1.2 | |
| A 1682 | 10.4 | 0.4 | 1.0⋆ | … | … | 139 | 1.0⋆ | 1.1 | ||
| A 1689 | 13.0 | 0.6 | 1.0⋆ | … | … | 109 | 1.7 | 0.1 | ||
| AS 780 | 9.5 | 5.8 | 0.0⋆ | 0.37 | 146 | 3.2 | 110 | 1.7 | 0.2 | |
| RXC J1504.10248 | 19.2 | 0.4 | 0.0⋆ | 0.15 | 348 | 1.0 | 86 | 1.6 | 0.2 | |
| RXC J1514.91523 | 11.4 | 0.8 | 1.0⋆ | … | … | 52 | 1.2 | 0.8 | ||
| A 2142 | 12.8 | 1.3 | 1.0⋆ | … | … | 127 | 1.2 | 1.0 | ||
| CL 1821+643 | 9.5 | 5.0 | 0.0⋆ | 0.38 | 88 | 4.2 | 125 | 1.3 | 0.2 | |
| RXC J2003.52323 | 17.6 | 0.4 | 0.0⋆ | 1.0⋆ | … | … | 11 | 1.3⋆ | 1.1 | |
| MACS J2135.2-0102 | 12.4 | 0.7 | 1.0⋆ | … | … | 145 | 1.0 | 1.9 | ||
| A 2355 | 10.5 | 1.4 | 0.0⋆ | 1.0⋆ | … | … | 57 | 1.3⋆ | 0.8 | |
| A 2552 | 12.8 | 0.7 | 1.0⋆ | … | … | 164 | 1.0 | 1.6 | ||
| Z348 | 4.7 | 0.6 | 0.0⋆ | 0.53 | 95 | 2.6 | 73 | 1.7 | 0.2 | |
| Phoenix | 32.6 | 0.4 | 0.0⋆ | 0.21 | 255 | 1.5 | 123 | 1.7 | 0.3 |
⋆ fixed in the fit.
Note. — Column 1: cluster name. Columns 2–7: best-fit parameters of the temperature fit, see eq. (4). Columns 8–10: best-fit parameters of the entropy fit (see §5.5 for details). Column 11: maximum radius used for the entropy fit.
5.5 Temperature and specific entropy profiles
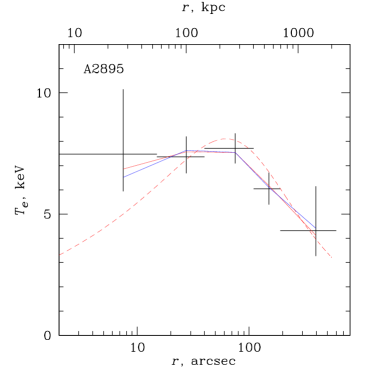
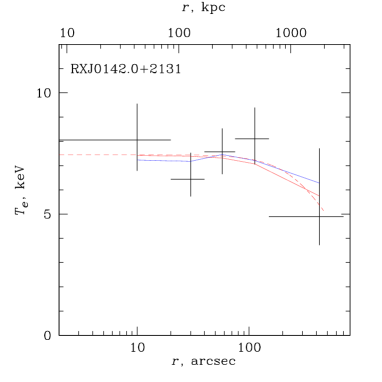
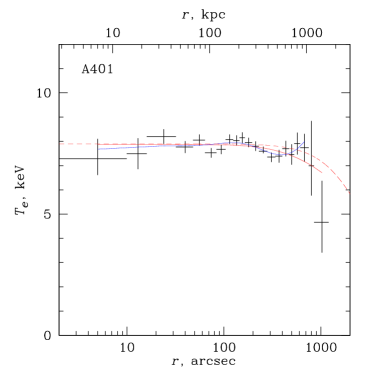
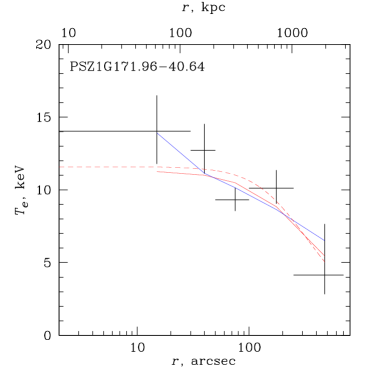
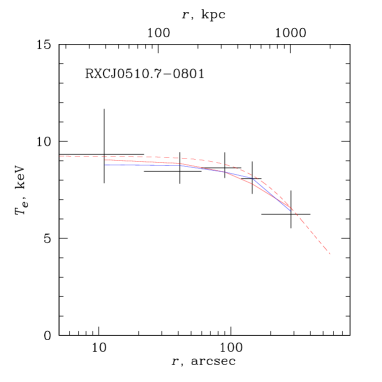
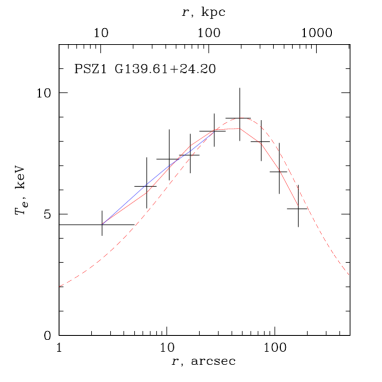
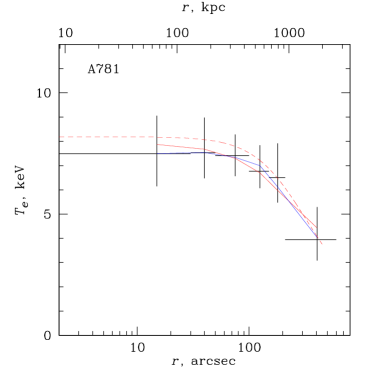
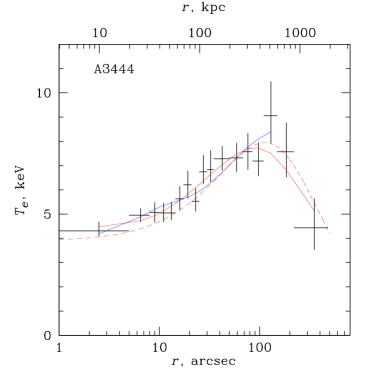
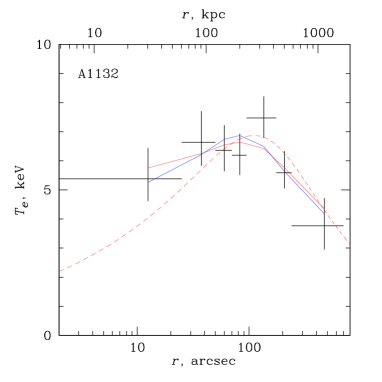
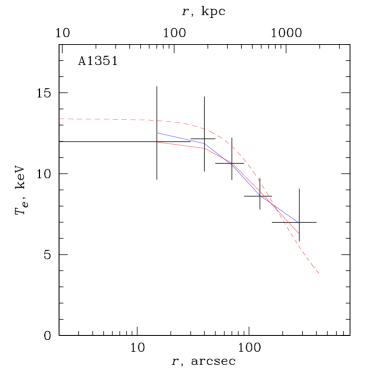
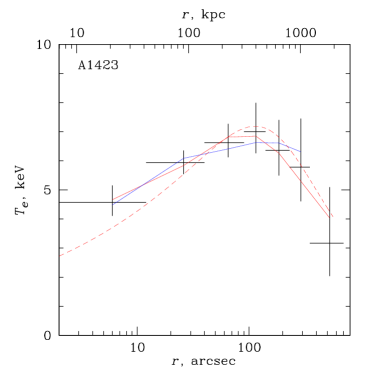
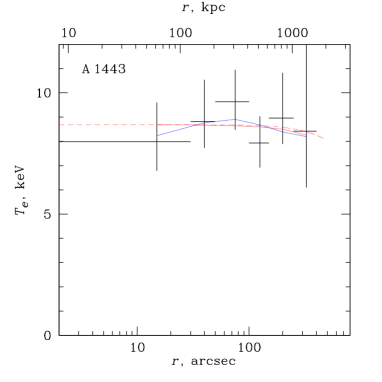
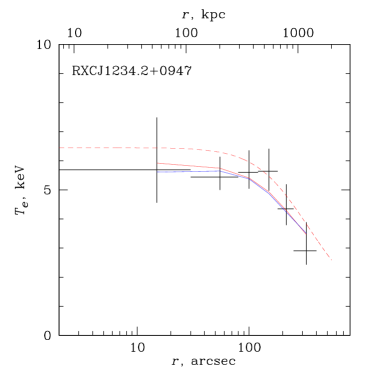
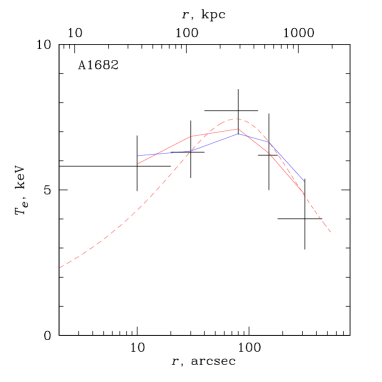
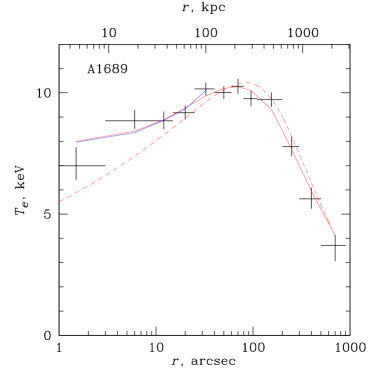
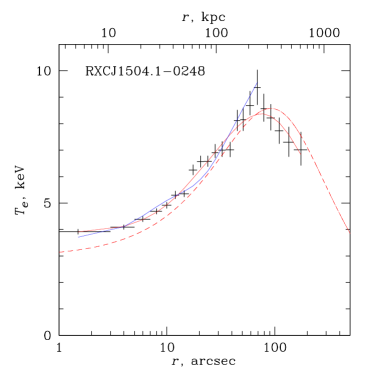
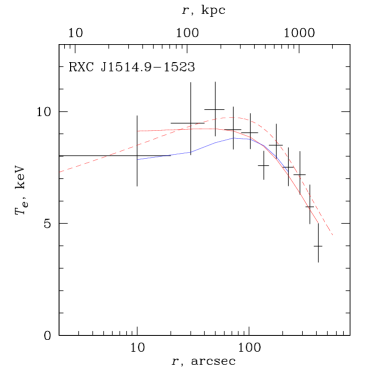
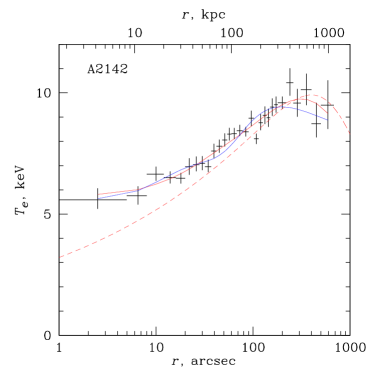
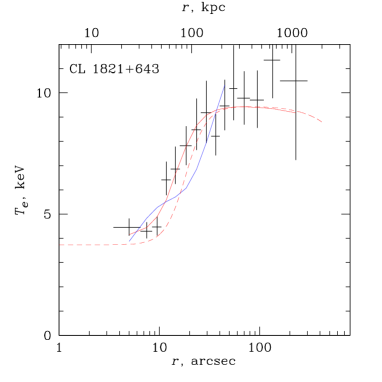
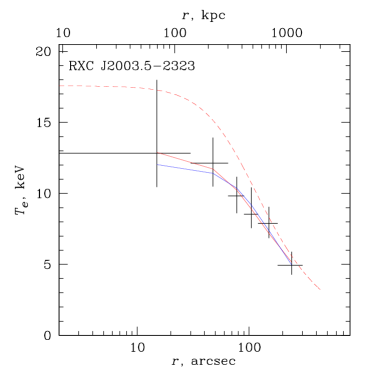
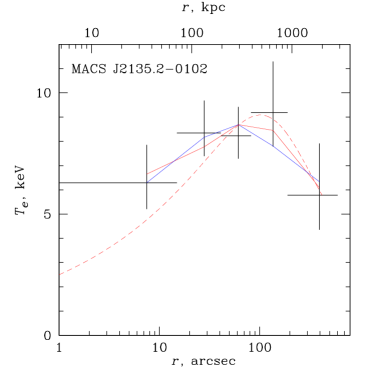
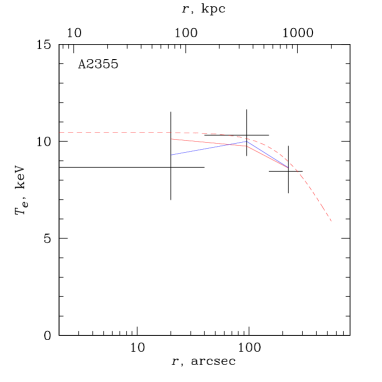
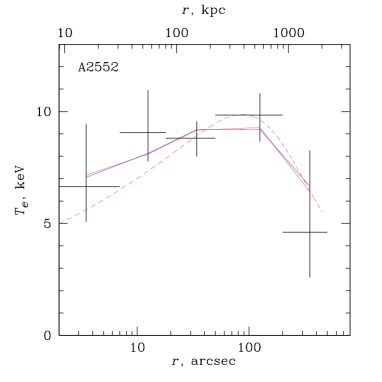
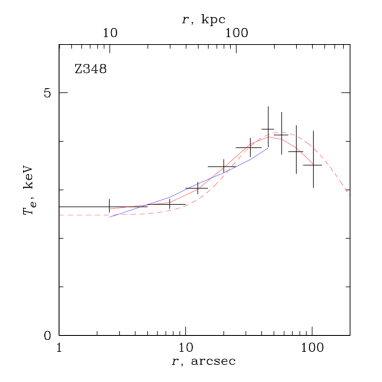
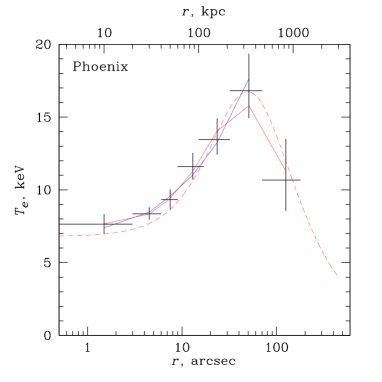
We obtained radial temperature profiles by fitting spectra in annuli centered on the X-ray surface brightness peak or the centroid for disturbed clusters without a well-defined peak. The radial bins were selected as a compromise between the need to sample well the temperature decline in the cores and to keep the uncertainties small. The maximum radius was as far as the detector coverage and the background uncertainties allowed; this is unimportant as we are interested in the cores. The spectra were fit as described in §5.4, with metallicities allowed to vary at small radii (since we expect strong gradients in cool cores) and fixed at 0.2 solar at large radii. The was fixed at the full-cluster values given in Table 3. The resulting projected temperature profiles for the clusters analyzed in this work are shown in Figs. 2–6, except for A 1733, which only has a 7 ks Chandra exposure (see below).
Our goal here is to derive the specific entropy floor in cluster centers, defined in the same way as in C09 (§4). For this purpose, we take our best-fit 3D density profile in the form of eq. (3), assume the entropy radial dependence given by eq. (2), calculate a temperature at a given radius from eq. (1). These temperature values are then averaged within each radial bin of the measured temperature profiles using the weighting of Mazzotta et al. (2004). The average values are compared with the observed temperature profiles, and the parameters , and are fit in such a way. Because of limited modeling freedom of eq. (2), such a temperature profile usually described the cool cores well but often not the regions outside the core. Therefore, we only used the radii where it fit well, similarly to C09. The modeled projected temperature profiles are shown as blue lines overlaid on the measured profiles in Figs. 2–6, and the best-fit entropy profile parameters, as well as the maximum radius used for the fit, are given in Table 5. For A 1733, the central entropy is estimated using the best-fit density profile and the temperature within the central kpc region, which is enough to determine that it is not a cool core (Table 6).
For reference in our future work, and to verify the above model, we also fit the observed temperature profiles with a more complex phenomenological 3D temperature model used by Vikhlinin et al. (2006):
| (4) |
where
| (5) |
describes the temperature profile outside the central cooling region and
| (6) |
describes the temperature decline in the central region. , , , , , , and are free parameters. The term was required only in several cases with a strong radial increase of the temperature profile in the core; in most cases, setting was sufficient for a good fit, as the term alone can describe a temperature dip in the center. We also fixed and , which provides a good fit in all cases. The model was projected along the line of sight and within each radial bin and fit to the observed projected temperature profiles. The best-fit profile parameters are given in Table 5. The 3D and the corresponding projected profiles are shown by red curves (dashed and solid, respectively) in Figs. 2–6. Because this model is more flexible, it can describe the whole radial range of the measured temperatures. Comparison with the profiles for the entropy model (blue lines) shows that the entropy model provides an adequate temperature fit in the cores of all clusters.
Because we will combine the central entropy values from C09 and from our new analysis, we checked their consistency using RXJ1504.1–0248, one of the clusters in the C09 sample for which we used a more recent Chandra dataset. Our best-fit central density (from a double -model fit, see Fig. 1) is only 7% higher than that in C09 (who derived it using the deprojection method), and our entropy floor value of keV cm2 is consistent with, and more accurate than, the C09 value of keV cm2. Other parameters of the core entropy profile are in agreement as well. The accuracy of depends on the number of temperature bins in the core, which is where the new data helped.

| Cluster | Ref. | Cluster | Ref. | ||||
|---|---|---|---|---|---|---|---|
| name | (keV) | (keV cm2) | name | (keV) | (keV cm2) | ||
| A 2744 | 2, 3 | RXC J1234.2+0947 | 1, 1 | ||||
| A 68 | 2, 3 | A 1682 | 1, 1 | ||||
| A 2813 | 1, 3 | A 1689 | 1,1 | ||||
| A 2895 | 1, 1 | A 1733 | aauncertainty from error in the first bin of the temperature profile. | 1, 1 | |||
| A 209 | 2, 3 | A 1758a | 2, 3 | ||||
| RXC J0142.0+2131 | 1, 1 | A 1763 | 2, 3 | ||||
| MACS J0257.62209 | 2, 3 | A 1835 (MH) | 2, 3 | ||||
| A 401 | 1, 1 | A 1914 | 2, 3 | ||||
| A 3088 | 1, 3 | AS 780 (MH) | 1, 1 | ||||
| PSZ1G171.9640.64 | 1, 1 | RXC J1504.10248 (MH) | 1, 1 | ||||
| A 478 (MH) | 2, 3 | A 2029 (MH) | 2, 3 | ||||
| A 521 | 2, 3 | RXC J1514.91523 | 1, 1 | ||||
| A 520 | 2, 3 | A 2142 | 1, 1 | ||||
| RXC J0510.70801 | 1, 1 | A 2163 | 2, 3 | ||||
| RXCJ 0520.71328 | 2, 3 | A 2204 (MH) | 2, 3 | ||||
| PSZ1G139.61+24.20 (cMH) | 1, 1 | A 2218 | 2, 3 | ||||
| A 665 | 2, 3 | A 2219 | 2, 3 | ||||
| A 697 | 2, 3 | A 2256 | 2, 3 | ||||
| A 754 | 4, 3 | RXC J1720.1+2637 (MH) | 2, 3 | ||||
| A 773 | 2, 3 | A 2261 | 2, 3 | ||||
| A 781 | 1, 1 | CL 1821+643 | 1, 1 | ||||
| RBS 797 (MH) | 2, 3 | RXC J2003.52323 | 1, 1 | ||||
| A 3444 (MH) | 1, 1 | MACS J2135.20102 | 1, 1 | ||||
| A 1132 | 1, 1 | A 2355 | 1, 1 | ||||
| RXC J1115.8+0129 (cMH) | 2, 3 | A 2390 | 2, 3 | ||||
| A 1300 | 2, 3 | A 2537 | 2, 3 | ||||
| A 1351 | 1, 1 | A 2552 | 1, 1 | ||||
| A 1423 | 1, 1 | A 2631 | 2, 3 | ||||
| A 1443 | 1, 1 | A 2667 (MH) | 1, 3 |
Note. — Column 1: cluster name. The presence of a minihalo or a candidate is indicated as MH and cMH, respectively. Column 2: temperature within R2500 (R5000 for those clusters marked with ) measured in the keV band; the central kpc region has been excised for all clusters except A 754. Column 3: core entropy. Column 4: references for temperature and the core entropy floor, respectively: (1) this work, (2) C08, (3) C09, (4) Markevitch et al. (2003).
| Cluster | Ref. | Cluster | Ref. | ||||
|---|---|---|---|---|---|---|---|
| name | (keV) | (keV cm2) | name | (keV) | (keV cm2) | ||
| Z348 | 1,1 | A 1413 (cMH) | 1,3 | ||||
| A 119 | 2,3 | A 1576 | 1,3 | ||||
| A 141 | 1,3 | A 1650 | 1,3 | ||||
| A 193 | 5,3 | RX J1347.51145 (MH) | 2,3 | ||||
| A 267 | 2,3 | A 1795 (cMH) | 2,3 | ||||
| MACS J0159.80849 (MH) | 2,3 | A 1995 | 2,3 | ||||
| A 383 | 2,3 | MS 1455.0+2232 (MH) | 2,3 | ||||
| A 399 | 2,3 | A 2034 | 2,3 | ||||
| Perseus (MH) | 4,3 | RX J1532.9+3021 (MH) | 2,3 | ||||
| MACS J0329.60211 (MH) | 2,3 | A 2111 | 2,3 | ||||
| 2A 0335+096 (MH) | 5,3 | A 2125 | 2,3 | ||||
| MACS J0417.51154 | 2,3 | Ophiuchus (MH) | 4,3 | ||||
| MACS J0429.60253 | 2,3 | A 2255 | 2,3 | ||||
| RX J0439.0+0715 | 2,3 | RX J1720.2+3536 (cMH) | 2,3 | ||||
| MS 0440.5+0204 | 2,3 | ZwCl 1742.1+3306 (u) | 1,3 | ||||
| A 611 | 2,3 | A 2319 | 4,3 | ||||
| MS 0839.8+2938 | 2,3 | MACS J1931.82634 (u) | 2,3 | ||||
| Z2089 | 1,3 | RX J2129.6+0005 (MH) | 1,3 | ||||
| ZwCl 2701 | 2,3 | A 2420 | 1,3 | ||||
| A 907 (MH) | 2,3 | MACS J2228.5+2036 | 2,3 | ||||
| ZWCL 3146 (MH) | 2,3 | MACS J2245.0+2637 | 2,3 | ||||
| A 1068 (cMH) | 2,3 | A 2556 | 2,3 | ||||
| A 1204 | 2,3 | A 2626 (u) | 1,3 | ||||
| A 1240 | 1,3 | Phoenix (MH) | 1,1 |
Note. — Column 1: cluster name. The presence of a minihalo, a candidate minihalo or a central diffuse source with uncertain classification (§3.2) are indicated as MH, cMH and u respectively. Column 2: cluster global temperature within R2500 (R5000 for those clusters marked with ) measured in the keV band; the central kpc region has been excised for all clusters except Perseus, 2A 0335+096, Ophiuchus, A 193 and A 2319. Column 3: core entropy. Column 4: references for temperature and the core entropy floor: (1) this work, (2) C08, (3) C09, (4) Ikebe et al. (2002), (5) David et al. (1993).
6 Radio analysis
We analyzed VLA archival observations at 1.4 GHz of those clusters in our supplementary sample with no high-sensitivity and multi-resolution radio images on the minihalo angular scales in the literature (9 clusters). The observations were chosen to be suitable to search for diffuse radio emission on the cluster core scale, i.e., deep and with a good sampling of the –plane, particularly at short spacings, that are crucial to properly image extended, low surface brightness radio emission. Furthermore, we selected observations with a range of angular resolutions that allow us to discriminate between genuine diffuse emission and a blend of individual radio galaxies, as well as to separate a possible minihalo from the radio source associated with the cluster central galaxy.
Here we provide a brief description of the data reduction. The observation details, radio images and notes on the individual clusters are presented in Appendix A. The data were calibrated and reduced in the standard fashion using the NRAO Astronomical Image Processing System (AIPS) package. Self-calibration was applied to reduce the effects of residual phase and amplitude errors in the data and improve the quality of the final images. For each cluster, the observations in different array configurations were processed and imaged separately. When possible, data from different dates and configurations were combined together in the or image plane. Sets of images were produced with different weighting schemes, ranging from pure uniform weighting (Briggs “robustness” parameter (Briggs 1995) ROBUST) to natural weighting (ROBUST), to enhance any possible extended emission. The flux density scale was set using the Perley & Butler (2013) coefficients, and residual amplitude errors are within 3–5%.
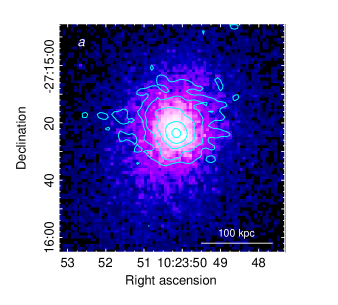
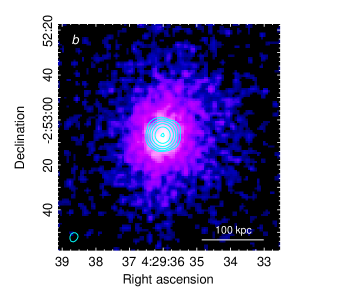
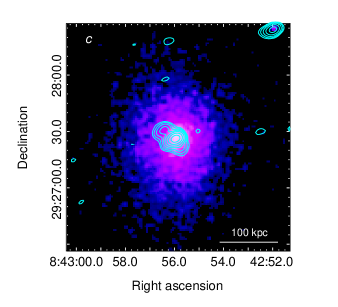
No new minihalos were detected among the 9 clusters analyzed here. As an illustrative example, in Fig. 7 we show a comparison between a known minihalo (in our statistical sample) and two non-detections based on our radio analysis. Panel a shows the minihalo in the cool-core cluster A 3444 (from G17; see also Venturi et al. 2008, Kale et al. 2015). Panels b and c show radio/X-ray overlays for MACS J0429.6-0253 and MS 0839.8+2938, both cool cores in our supplementary sample. All three radio images have similar angular resolution () and sensitivity ( Jy beam-1). The observations also have similar sampling of short spacings in the –plane, that ensures the possibility of detecting extended emission on a largest scale of . This corresponds to a physical scale of kpc for A 3444, kpc for MACS J0429.6-0253 and kpc for MS 0839.8+2938, thus well beyond the region occupied by the central radio galaxy. While a minihalo is clearly well detected in A 3444, no indication of diffuse radio emission is visible in the cores of the other clusters at a similar sensitivity level.
7 Discussion
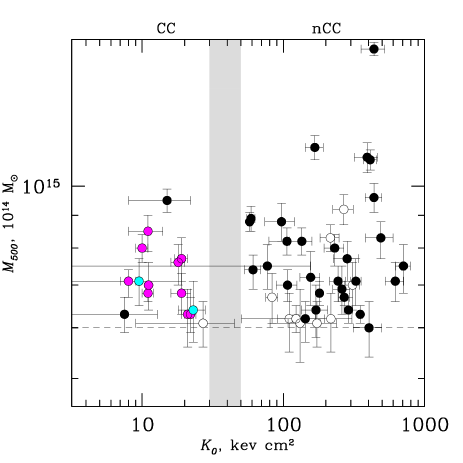
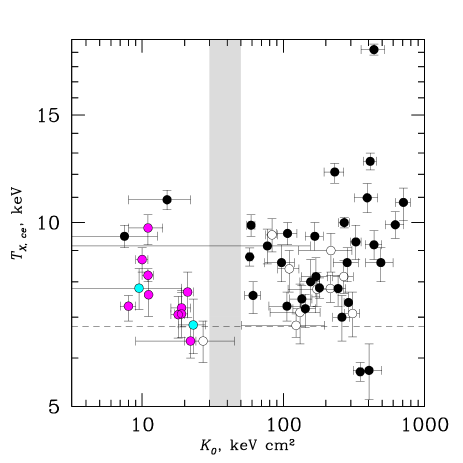
The purpose of this study is to quantify how frequent are radio minihalos in clusters. Top panels in Fig. 8 plot the clusters in our mass-limited sample in the and planes (in the latter panel, the approximate temperature from the relation that corresponds to our mass cut is shown by a dashed line). As noted by C09, Rossetti et al. (2013) and others, the cluster sample clearly separates into two populations, cool cores with keV cm2 and non-cool cores (most of which obvious mergers) with keV cm2. The fraction of cool cores in our Planck-selected sample is (15 out of 58), similar to the fraction found in a much larger Planck-selected sample (Andrade-Santos et al. 2017) and lower than that seen in X-ray selected samples of nearby clusters (e.g., Rossetti et al. 2016).
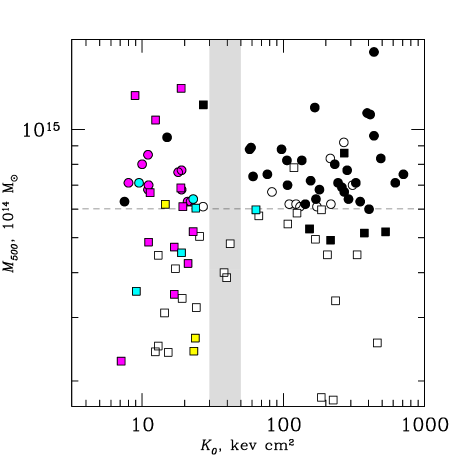
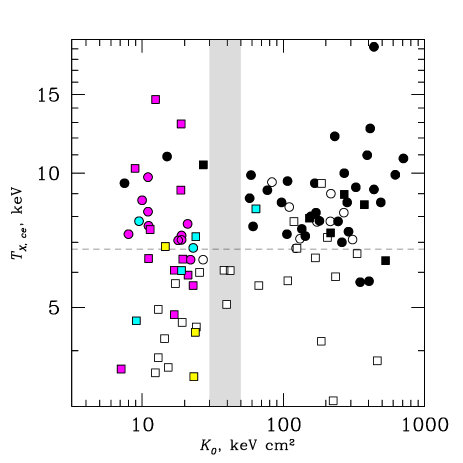
As shown before (e.g., Cassano et al. 2013, Rossetti et al. 2013, Cuciti et al. 2015, Yuan et al. 2015), giant halos (black symbols) are found almost exclusively in non-cool core clusters. We find that minihalos (magenta symbols) are indeed found exclusively in cool cores, confirming previous non-statistical findings (e.g., Giacintucci et al. 2014a, Yuan et al. 2015, Kale et al. 2015). A new result that is evident in Fig. 8 (top panels) is that almost all cool cores in a complete sample of massive clusters — 12 out of 15, or 80% — possess a minihalo. Radio minihalos are not that rare after all.
It is interesting to extend the mass range of the sample toward lower masses and temperatures. According to Cuciti et al. (2015), the probability of finding a giant radio halo in merging clusters increases with the total mass. This is instructive for the origin of giant halos, because it implies a statistical link between the mechanical energy available during mergers and the generation of these sources (e.g., Cassano et al. 2006, 2016). It is interesting to check if minihalos exhibit a similar behavior. Lower panels in Fig. 8 show our combined statistical + supplementary sample, which includes all the known 22 confirmed minihalos (magenta points) and 6 candidates (cyan points). This combined sample extends a factor 3 below the mass cut of the statistical one, as well as adding a number of massive systems. We do see the lower frequency of the giant radio halos in cooler clusters, observed in Cassano et al. (2013) and Cuciti et al. (2015). Similarly, at lower masses, a large fraction of cool cores without minihalos (not detected at a similar radio sensitivity; see §5, Fig. 7 and Appendix A) emerges, while almost all the additional massive cool cores do have minihalos, consistently with our finding for the statistical sample. Minihalos are still absent in the non-cool-core clusters (with the exception of the candidate minihalo in A 1413); a few “warm cores” that appear in the keV cm2 gap do not host minihalos (or giant halos) either. The apparent reduced frequency of minihalos at lower masses needs a proper statistical investigation that accounts for selection effects (e.g., what if the radio luminosity correlates with the cluster mass) and radio upper limits (for instance via injection of fake minihalos in the –data, e.g., Kale et al. 2015), which will be the subject of future work.
8 Conclusions
The two new results of our study are: (a) almost all (12 out of 15, i.e., 80%) massive clusters with cool cores ( or keV) exhibit a radio minihalo, and (b) the fraction of minihalos appears to drop in cool cores with lower cluster total masses (or global temperatures). To make the former observation, we used a mass-limited cluster sample. For the latter result, we extended the sample to include more clusters with available Chandra and radio data, including higher-redshift and lower-mass clusters and all the other known minihalos (for a total of 28 minihalos, including 6 candidates).
These findings may encode information on the origin of minihalos. In the
present study, we used only the presence or absence of a minihalo; we will
investigate the correlation of the radio power with cluster mass, as well as
with cool core thermodynamic parameters, in the follow-up works. A few
outliers may prove especially valuable, such as a minihalo in a low-mass
cool core 2A 0335+096 (Sarazin et al., 1995), a giant halo in a
high-mass cool core CL 1821+643
(Bonafede et al., 2014; Kale & Parekh, 2016), a halo in A 2390 (Sommer
et al. 2017) whose cool core has a similar, unusually large radius
(Vikhlinin et al. 2005), as well as the absence of minihalos in warm cores.
Acknowledgements.
We thank the referee for their critical and helpful comments. SG acknowledges the support by the National Aeronautics and Space Administration, through Chandra Award Numbers G03-14140X, AR5-16013X and G05-16136X. Basic research in radio astronomy at the Naval Research Laboratory is supported by 6.1 Base funding. RC, TV and GB acknowledge partial support from PRIN INAF 2014. This research has made use of the NASA/IPAC Extragalactic Database (NED) which is operated by the Jet Propulsion Laboratory, California Institute of Technology, under contract with the National Aeronautics and Space Administration. The National Radio Astronomy Observatory is a facility of the National Science Foundation operated under cooperative agreement by Associated Universities, Inc.
References
- Andrade-Santos et al. (2017) Andrade-Santos, F., Jones, C., Forman, W., et al., 2017, ApJ, submitted, arXiv:1703.08690
- Ascasibar & Markevitch (2006) Ascasibar, Y., & Markevitch, M. 2006, ApJ, 650, 102
- Bacchi et al. (2003) Bacchi, M., Feretti, L., Giovannini, G., & Govoni, F. 2003, A&A, 400, 465
- Barrena et al. (2007) Barrena, R., Boschin, W., Girardi, M., & Spolaor, M. 2007, A&A, 469, 861
- Bonafede et al. (2009) Bonafede, A., Giovannini, G., Feretti, L., Govoni, F., & Murgia, M. 2009, A&A, 494, 429
- Bonafede et al. (2014) Bonafede, A., Intema, H. T., Brüggen, M., et al. 2014, MNRAS, 444, L44
- Bonafede et al. (2015) Bonafede, A., Intema, H., Brüggen, M., et al. 2015, MNRAS, 454, 3391
- Briggs (1995) Briggs, D. S. 1995, Bulletin of the American Astronomical Society, 27, 112.02
- Bravi et al. (2016) Bravi, L., Gitti, M., & Brunetti, G. 2016, MNRAS, 455, L41
- Brentjens (2008) Brentjens, M. A. 2008, A&A, 489, 69
- Brunetti et al. (2008) Brunetti, G., Giacintucci, S., Cassano, R., et al. 2008, Nature, 455, 944
- Brunetti & Jones (2014) Brunetti, G., & Jones, T. W. 2014, International Journal of Modern Physics D, 23, 1430007
- Burns et al. (1992) Burns, J. O., Sulkanen, M. E., Gisler, G. R., & Perley, R. A. 1992, ApJ, 388, L49
- Cassano & Brunetti (2005) Cassano, R., & Brunetti, G. 2005, MNRAS, 357, 1313
- Cassano et al. (2006) Cassano, R., Brunetti, G., & Setti, G. 2006, MNRAS, 369, 1577
- Cassano et al. (2007) Cassano, R., Brunetti, G., Setti, G., Govoni, F., & Dolag, K. 2007, MNRAS, 378, 1565
- Cassano et al. (2008) Cassano, R., Gitti, M., & Brunetti, G. 2008, A&A, 486, L31
- Cassano et al. (2010) Cassano, R., Ettori, S., Giacintucci, S., et al. 2010, ApJ, 721, L82
- Cassano et al. (2013) Cassano, R., Ettori, S., Brunetti, G., et al. 2013, ApJ, 777, 141
- Cassano et al. (2016) Cassano, R., Brunetti, G., Giocoli, C., & Ettori, S. 2016, A&A, 593, A81
- Cavagnolo et al. (2008) Cavagnolo, K. W., Donahue, M., Voit, G. M., & Sun, M. 2008, ApJ, 682, 821 (C08)
- Cavagnolo et al. (2009) Cavagnolo, K. W., Donahue, M., Voit, G. M., & Sun, M. 2009, ApJS, 182, 12 (C09)
- Cavaliere & Fusco-Femiano (1978) Cavaliere, A., & Fusco-Femiano, R. 1978, A&A, 70, 677
- Clarke & Ensslin (2006) Clarke, T. E., & Ensslin, T. A. 2006, AJ, 131, 2900
- Crawford et al. (1999) Crawford, C. S., Allen, S. W., Ebeling, H., Edge, A. C., & Fabian, A. C. 1999, MNRAS, 306, 857
- Cuciti et al. (2015) Cuciti, V., Cassano, R., Brunetti, G., et al. 2015, A&A, 580, A97
- Dallacasa et al. (2009) Dallacasa, D., Brunetti, G., Giacintucci, S., et al. 2009, ApJ, 699, 1288
- David et al. (1993) David, L. P., Slyz, A., Jones, C., et al. 1993, ApJ, 412, 479
- Doria et al. (2012) Doria, A., Gitti, M., Ettori, S., et al. 2012, ApJ, 753, 47
- Ehlert et al. (2011) Ehlert, S., Allen, S. W., von der Linden, A., et al. 2011, MNRAS, 411, 1641
- Farnsworth et al. (2013) Farnsworth, D., Rudnick, L., Brown, S., & Brunetti, G. 2013, ApJ, 779, 189
- Feretti et al. (1997a) Feretti, L., Boehringer, H., Giovannini, G., & Neumann, D. 1997, A&A, 317, 432
- Feretti et al. (1997b) Feretti, L., Giovannini, G., Boehringer, H. 1997, New Astronomy, 2, 501
- Feretti et al. (2001) Feretti, L., Fusco-Femiano, R., Giovannini, G., & Govoni, F. 2001, A&A, 373, 106
- Feretti et al. (2005) Feretti, L., Schuecker, P., Böhringer, H., Govoni, F., & Giovannini, G. 2005, A&A, 444, 157
- Feretti et al. (2012) Feretti, L., Giovannini, G., Govoni, F., & Murgia, M. 2012, A&A Rev., 20, 54
- Ferrari et al. (2011) Ferrari, C., Intema, H. T., Orrù, E., et al. 2011, A&A, 534, L12
- Fujita et al. (2007) Fujita, Y., Kohri, K., Yamazaki, R., & Kino, M. 2007, ApJ, 663, L61
- Fujita & Ohira (2011) Fujita, Y., & Ohira, Y. 2011, ApJ, 738, 182
- Fujita & Ohira (2013) Fujita, Y., & Ohira, Y. 2013, MNRAS, 428, 599
- Gendron-Marsolais et al. (2017) Gendron-Marsolais, M., Hlavacek-Larrondo, J., van Weeren, R. J., et al. 2017, arXiv:1701.03791
- Giacintucci et al. (2009a) Giacintucci, S., Venturi, T., Cassano, R., Dallacasa, D., & Brunetti, G. 2009, ApJ, 704, L54
- Giacintucci et al. (2009b) Giacintucci, S., Venturi, T., Brunetti, G., et al. 2009, A&A, 505, 45
- Giacintucci et al. (2011a) Giacintucci, S., Markevitch, M., Brunetti, G., Cassano, R., & Venturi, T. 2011, A&A, 525, L10
- Giacintucci et al. (2011b) Giacintucci, S., Dallacasa, D., Venturi, T., et al. 2011, A&A, 534, A57
- Giacintucci et al. (2012) Giacintucci, S., O’Sullivan, E., Clarke, T. E., et al. 2012, ApJ, 755, 172
- Giacintucci et al. (2013) Giacintucci, S., Kale, R., Wik, D. R., Venturi, T., & Markevitch, M. 2013, ApJ, 770, 161
- Giacintucci et al. (2014a) Giacintucci, S., Markevitch, M., Venturi, T., et al. 2014a, ApJ, 781, 9
- Giacintucci et al. (2014b) Giacintucci, S., Markevitch, M., Brunetti, G., et al. 2014b, ApJ, 795, 73
- Giacintucci et al. (2017) Giacintucci, S., et al., 2017, in preparation (G17)
- Gioia et al. (1998) Gioia, I. M., Shaya, E. J., Le Fèvre, O., et al. 1998, ApJ, 497, 573
- Giovannini & Feretti (2000) Giovannini, G., & Feretti, L. 2000, New A, 5, 335
- Giovannini et al. (2009) Giovannini, G., Bonafede, A., Feretti, L., et al. 2009, A&A, 507, 1257
- Gitti et al. (2015) Gitti, M., Tozzi, P., Brunetti, G., et al. 2015, Advancing Astrophysics with the Square Kilometre Array (AASKA14), 76
- Gitti (2013) Gitti, M. 2013, MNRAS, 436, L84
- Gitti et al. (2002) Gitti, M., Brunetti, G., & Setti, G. 2002, A&A, 386, 456
- Gitti et al. (2004) Gitti, M., Brunetti, G., Feretti, L., & Setti, G. 2004, A&A, 417, 1
- Gitti et al. (2006) Gitti, M., Feretti, L., & Schindler, S. 2006, A&A, 448, 853
- Gitti et al. (2007) Gitti, M., Ferrari, C., Domainko, W., Feretti, L., & Schindler, S. 2007, A&A, 470, L25
- Govoni et al. (2001) Govoni, F., Feretti, L., Giovannini, G., et al. 2001, A&A, 376, 803
- Govoni et al. (2005) Govoni, F., Murgia, M., Feretti, L., et al. 2005, A&A, 430, L5
- Govoni et al. (2009) Govoni, F., Murgia, M., Markevitch, M., et al. 2009, A&A, 499, 371
- Govoni et al. (2011) Govoni, F., Murgia, M., Giovannini, G., Vacca, V., & Bonafede, A. 2011, A&A, 529, A69
- Guo & Oh (2008) Guo, F., & Oh, S. P. 2008, MNRAS, 384, 251
- Hitomi Collaboration et al. (2016) Hitomi Collaboration, Aharonian, F., Akamatsu, H., et al. 2016, Nature, 535, 117
- Hlavacek-Larrondo et al. (2013) Hlavacek-Larrondo, J., Allen, S. W., Taylor, G. B., et al. 2013, ApJ, 777, 163
- Hogan et al. (2015) Hogan, M. T., Edge, A. C., Hlavacek-Larrondo, J., et al. 2015, MNRAS, 453, 1201
- Ikebe et al. (2002) Ikebe, Y., Reiprich, T. H., Böhringer, H., Tanaka, Y., & Kitayama, T. 2002, A&A, 383, 773
- Jacob & Pfrommer (2017a) Jacob, S., & Pfrommer, C. 2017a, MNRAS, arXiv:1609.06321
- Jacob & Pfrommer (2017b) Jacob, S., & Pfrommer, C. 2017b, MNRAS, arXiv:1609.06322
- Jones & Forman (1984) Jones, C., & Forman, W. 1984, ApJ, 276, 38
- Kalberla et al. (2005) Kalberla, P. M. W., Burton, W. B., Hartmann, D., et al. 2005, A&A, 440, 775
- Kale et al. (2013) Kale, R., Venturi, T., Giacintucci, S., et al. 2013, A&A, 557, A99
- Kale et al. (2015) Kale, R., Venturi, T., Giacintucci, S., et al. 2015, A&A, 579, A92
- Kale & Parekh (2016) Kale, R., & Parekh, V. 2016, MNRAS, 459, 2940
- Kassim et al. (2001) Kassim, N. E., Clarke, T. E., Enßlin, T. A., Cohen, A. S., & Neumann, D. M. 2001, ApJ, 559, 785
- Macario et al. (2010) Macario, G., Venturi, T., Brunetti, G., et al. 2010, A&A, 517, A43
- Macario et al. (2011) Macario, G., Markevitch, M., Giacintucci, S., et al. 2011, ApJ, 728, 82
- Macario et al. (2013) Macario, G., Venturi, T., Intema, H. T., et al. 2013, A&A, 551, A141
- Macario et al. (2014) Macario, G., Intema, H. T., Ferrari, C., et al. 2014, A&A, 565, A13
- Markevitch et al. (2000) Markevitch, M., Ponman, T. J., Nulsen, P. E. J., et al. 2000, ApJ, 541, 542
- Markevitch et al. (2003) Markevitch, M., Mazzotta, P., Vikhlinin, A., et al. 2003, ApJ, 586, L19
- Mazzotta et al. (2004) Mazzotta, P., Rasia, E., Moscardini, L., & Tormen, G. 2004, MNRAS, 354, 10
- Mazzotta & Giacintucci (2008) Mazzotta, P., & Giacintucci, S. 2008, ApJ, 675, L9
- McDonald et al. (2015) McDonald, M., McNamara, B. R., van Weeren, R. J., et al. 2015, ApJ, 811, 111
- McDonald et al. (2017) McDonald, M., Allen, S. W., Bayliss, M., et al. 2017, arXiv:1702.05094
- McNamara & Nulsen (2007) McNamara, B. R., & Nulsen, P. E. J. 2007, ARA&A, 45, 117
- Mittal et al. (2009) Mittal, R., Hudson, D. S., Reiprich, T. H., & Clarke, T. 2009, A&A, 501, 835
- Murgia et al. (2009) Murgia, M., Govoni, F., Markevitch, M., et al. 2009, A&A, 499, 679
- Murgia et al. (2010) Murgia, M., Govoni, F., Feretti, L., & Giovannini, G. 2010, A&A, 509, A86
- Murgia et al. (2010b) Murgia, M., Eckert, D., Govoni, F., et al. 2010, A&A, 514, A76
- Murgia et al. (2011) Murgia, M., Parma, P., Mack, K.-H., et al. 2011, A&A, 526, A148
- Murgia et al. (2012) Murgia, M., Markevitch, M., Govoni, F., et al. 2012, A&A, 548, A75
- Nagai (2006) Nagai, D. 2006, ApJ, 650, 538
- Owen et al. (2006) Owen, F. N., Keel, W. C., Wang, Q. D., Ledlow, M. J., & Morrison, G. E. 2006, AJ, 131, 1974
- Owen et al. (2005) Owen, F. N., Ledlow, M. J., Keel, W. C., Wang, Q. D., & Morrison, G. E. 2005, AJ, 129, 31
- Owen et al. (1993) Owen, F. N., White, R. A., & Ge, J. 1993, ApJS, 87, 135
- Owen & Ledlow (1997) Owen, F. N., & Ledlow, M. J. 1997, ApJS, 108, 41
- Pandey-Pommier et al. (2016) Pandey-Pommier, M., Richard, J., Combes, F., et al. 2016, arXiv:1612.00225
- Parekh et al. (2015) Parekh, V., van der Heyden, K., Ferrari, C., Angus, G., & Holwerda, B. 2015, A&A, 575, A127
- Parekh et al. (2017) Parekh, V., Dwarakanath, K. S., Kale, R., & Intema, H. 2017, MNRAS, 464, 2752
- Perley & Butler (2013) Perley, R. A., & Butler, B. J. 2013, ApJS, 204, 19
- Pizzo & de Bruyn (2009) Pizzo, R. F., & de Bruyn, A. G. 2009, A&A, 507, 639
- Planck Collaboration et al. (2014) Planck Collaboration, Ade, P. A. R., Aghanim, N., et al. 2014, A&A, 571, 29
- Pfrommer & Enßlin (2004) Pfrommer, C., & Enßlin, T. A. 2004, A&A, 413, 17
- Pizzo & de Bruyn (2009) Pizzo, R. F., & de Bruyn, A. G. 2009, A&A, 507, 639
- Reid et al. (1999) Reid, A. D., Hunstead, R. W., Lemonon, L., & Pierre, M. M. 1999, MNRAS, 302, 571
- Rossetti et al. (2013) Rossetti, M., Eckert, D., De Grandi, S., et al. 2013, A&A, 556, A44
- Rossetti et al. (2016) Rossetti, M., Gastaldello, F., Ferioli, G., et al. 2016, MNRAS, 457, 4515
- Saikia & Jamrozy (2009) Saikia, D. J., & Jamrozy, M. 2009, Bulletin of the Astronomical Society of India, 37, 63
- Sarazin et al. (1995) Sarazin, C. L., Baum, S. A., & O’Dea, C. P. 1995, ApJ, 451, 125
- Sijbring (1993) Sijbring L.G., PhD Thesis, University of Groningen, A radio continuum and HI Line study of the Perseus cluster (1993)
- Sommer et al. (2017) Sommer, M. W., Basu, K., Intema, H., et al. 2017, MNRAS, 466, 996
- Vacca et al. (2011) Vacca, V., Govoni, F., Murgia, M., et al. 2011, A&A, 535, A82
- Vacca et al. (2014) Vacca, V., Feretti, L., Giovannini, G., et al. 2014, A&A, 561, A52
- van Weeren et al. (2010) van Weeren, R. J., Röttgering, H. J. A., Brüggen, M., & Hoeft, M. 2010, Science, 330, 347
- van Weeren et al. (2014) van Weeren, R. J., Intema, H. T., Lal, D. V., et al. 2014, ApJ, 786, L17
- Venturi et al. (2007) Venturi, T., Giacintucci, S., Brunetti, G., et al. 2007, A&A, 463, 937
- Venturi et al. (2008) Venturi, T., Giacintucci, S., Dallacasa, D., et al. 2008, A&A, 484, 327
- Venturi et al. (2011a) Venturi, T., Giacintucci, G., Dallacasa, D., et al. 2011, MNRAS, 414, L65
- Venturi et al. (2011b) Venturi, T., Giacintucci, S., & Dallacasa, D. 2011, Journal of Astrophysics and Astronomy, 32, 501
- Venturi et al. (2013) Venturi, T., Giacintucci, S., Dallacasa, D., et al. 2013, A&A, 551, A24
- Venturi et al. (2017) Venturi T., et al., 2017, A&A, in press (arXiv:1703.06802)
- Vikhlinin et al. (2005) Vikhlinin, A., Markevitch, M., Murray, S. S., et al. 2005, ApJ, 628, 655
- Vikhlinin et al. (2006) Vikhlinin, A., Kravtsov, A., Forman, W., et al. 2006, ApJ, 640, 691
- Vikhlinin et al. (2009) Vikhlinin, A., Burenin, R. A., Ebeling, H., et al. 2009, ApJ, 692, 1033
- White et al. (1997) White, D. A., Jones, C., & Forman, W. 1997, MNRAS, 292, 419
- Yuan et al. (2015) Yuan, Z. S., Han, J. L., & Wen, Z. L. 2015, ApJ, 813, 77
- Zandanel et al. (2014) Zandanel, F., Pfrommer, C., & Prada, F. 2014, MNRAS, 438, 124
- Zhuravleva et al. (2014) Zhuravleva, I., Churazov, E., Schekochihin, A. A., et al. 2014, Nature, 515, 85
- ZuHone et al. (2013) ZuHone, J. A., Markevitch, M., Brunetti, G., & Giacintucci, S. 2013, ApJ, 762, 78
Appendix A RADIO OBSERVATIONS AND IMAGES
Table 8 lists the VLA archival observations at 1.4 GHz reanalyzed in this work, as described in §6. Our final radio images are presented and compared to the cluster optical images (from SDSS777Sloan Digital Sky Survey., POSS-2888Second Palomar Observatory Sky Survey. or HST WFPC2999Hubble Space Telescope Wide-Field Planetary Camera 2. ) and X-ray Chandra images in Figs. 9, 10 and Fig. 11. The radio images of MACS J0429.6-0253 and MS 0839.8+2938 are overlaid on the Chandra images in Fig. 7 and on the optical HST images in Fig. 10 (upper panels). The image properties are summarized in Table 9. All the images shown here have been obtained with the ROBUST parameter set to 0 in the AIPS task IMAGR. The flux density of the unresolved radio galaxies was measured by fitting the sources with a Gaussian model (task JMFIT). For extended radio galaxies, the total flux density was determined using the task TVSTAT. All fluxes were measured on images corrected for the primary-beam attenuation. A brief description of the radio emission in each individual cluster is given below.
| Cluster name | Configuration | Project | Date | Time (min) |
|---|---|---|---|---|
| A 193 | C | AM735 | 2002 Nov 30 | 118 |
| C | AM702 | 2002 Oct 28 | 37 | |
| D | AM702 | 2001 Oct 15 | 55 | |
| A 383 | A | AR369 | 1996 Nov 17 | 54 |
| A | AR369 | 1996 Nov 19 | 100 | |
| C | AM072 | 2002 Oct 28 | 61 | |
| D | AM072 | 2001 Oct 21 | 60 | |
| MS 0440.5+0204 | A | AI0072 | 1998 Apr 19,20 | 360 |
| C | AS0873 | 2006 Dec 14 | 43 | |
| MACS J0429.6-0253 | A | AT0318 | 2006 Apr 03 | 52 |
| B | AT0318 | 2006 Sep 06 | 35 | |
| MS 0839.8+2938 | B | AH0190 | 1985 Apr 25 | 30 |
| C | AH0491 | 1993 Jun 26 | 58 | |
| A 1204 | C | AJ0242 | 1994 Dec 05 | 74 |
| A 2125 | C | AD0311 | 1993 Jul 29 | 343 |
| A 2420 | CnB | AM0702 | 2002 Sep 24,29 | 60 |
| DnC | AM0702 | 2001 Oct 6,7 | 60 | |
| A 2556 | CnB | AM0702 | 2002 Sep 29 | 60 |
| DnC | AM0702 | 2001 Oct 07 | 60 |
Note. — Column 1: cluster name. Column 2: VLA configuration. Columns 3 and 4: project code and observation date. Column 5: total time on source.
| Cluster | Configuration | FWHM, p.a. | rms | LDS | |
|---|---|---|---|---|---|
| name | (, ∘) | (Jy beam-1) | (mJy) | (Mpc) | |
| A 193 | C | , 15 | 40 | 0.8aafrom the temperature measured within the central kpc. | |
| C+D | , | 35 | 0.8 | ||
| A 383 | A | , | 40 | 0.12 | |
| C+D | , 8 | 45 | 2.8 | ||
| MS 0440.5+0204 | A | , | 30 | bbSum of the flux densities of the double source ( mJy) and head-tail radio galaxy ( mJy). | 0.12 |
| C | , | 65 | 2.8aaAlthough the shortest baseline is the same as in D configuration, the surface brightness sensitivity to extended structure is significantly less that that of the D configuration, but still high enough to detect diffuse emission on the core scale at typical brightness of minihalos (Appendix B). | ||
| MACS J0429.6-0253 | A | , | 38 | 0.2 | |
| B | , | 40 | 0.6 | ||
| MS 0839.8+2938 | B | , | 40 | 0.4 | |
| C | , 12 | 53 | 2.9aaAlthough the shortest baseline is the same as in D configuration, the surface brightness sensitivity to extended structure is significantly less that that of the D configuration, but still high enough to detect diffuse emission on the core scale at typical brightness of minihalos (Appendix B). | ||
| A 1204 | C | , | 28 | 2.6aaAlthough the shortest baseline is the same as in D configuration, the surface brightness sensitivity to extended structure is significantly less that that of the D configuration, but still high enough to detect diffuse emission on the core scale at typical brightness of minihalos (Appendix B). | |
| A 2125 | C | , | 58 | 3.5aaAlthough the shortest baseline is the same as in D configuration, the surface brightness sensitivity to extended structure is significantly less that that of the D configuration, but still high enough to detect diffuse emission on the core scale at typical brightness of minihalos (Appendix B). | |
| A 2420 | CnB | , 0 | 50 | 1.4aaAlthough the shortest baseline is the same as in D configuration, the surface brightness sensitivity to extended structure is significantly less that that of the D configuration, but still high enough to detect diffuse emission on the core scale at typical brightness of minihalos (Appendix B). | |
| DnC | , 0 | 65 | 1.4 | ||
| A 2556 | CnB | , 71 | 45 | ccSum of the flux densities of the central radio galaxy ( mJy in the CnB image and mJy in the CnB+DnC image) and head-tail radio galaxy ( mJy and mJy). | 1.5aaAlthough the shortest baseline is the same as in D configuration, the surface brightness sensitivity to extended structure is significantly less that that of the D configuration, but still high enough to detect diffuse emission on the core scale at typical brightness of minihalos (Appendix B). |
| DnC | , 77 | 60 | 1.5 | ||
| CnB+DnC | , 60 | 35 | ccSum of the flux densities of the central radio galaxy ( mJy in the CnB image and mJy in the CnB+DnC image) and head-tail radio galaxy ( mJy and mJy). | 1.5 |
Note. — Column 1: cluster name. Column 2: VLA configuration. Columns 3: Full width half maximum (FWHM) and position angle (p.a.) of the radio beam. Column 4:image root mean square (rms) level () for in IMAGR. Column 5: total flux density of the central radio emission. Column 6: largest linear structure detectable by the observation (LDS), as derived from the maximum angular scale that can be imaged reasonably well by VLA long-synthesis observations.
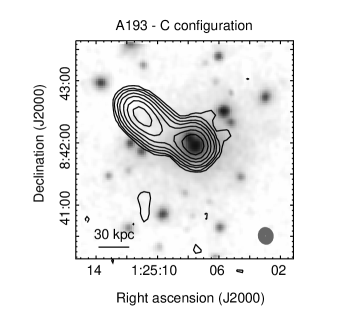
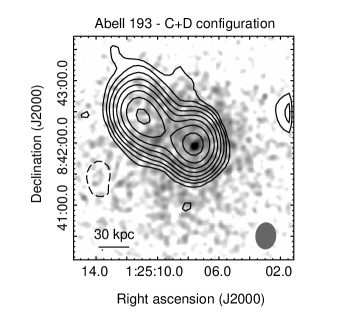
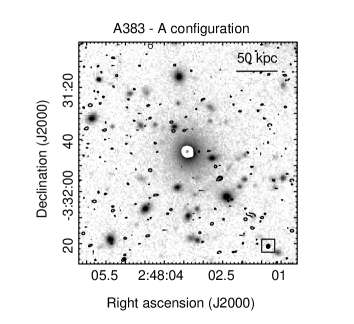
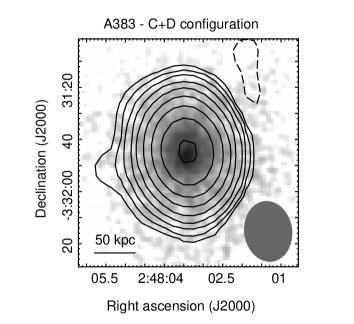
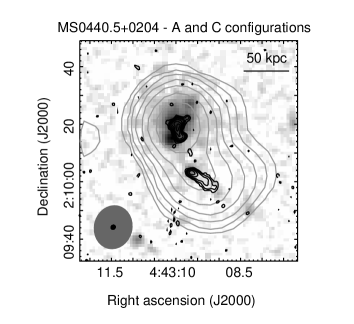
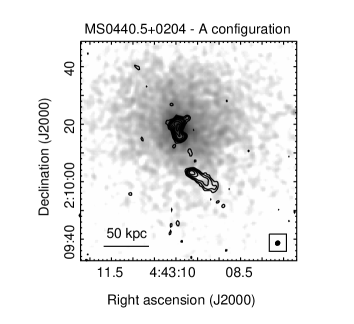
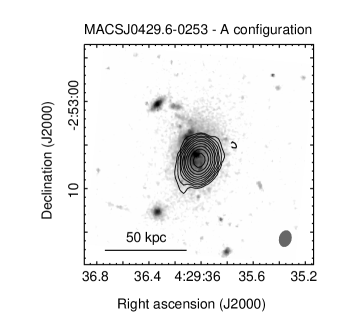
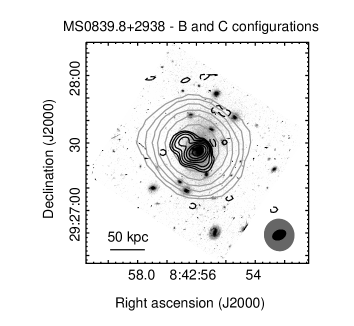
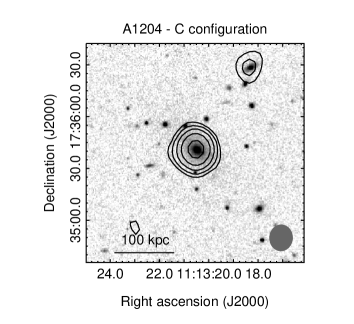
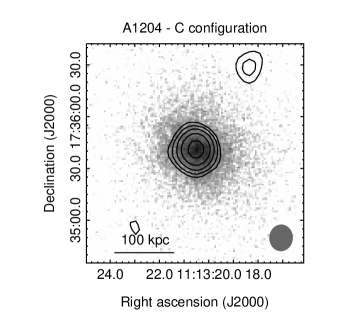
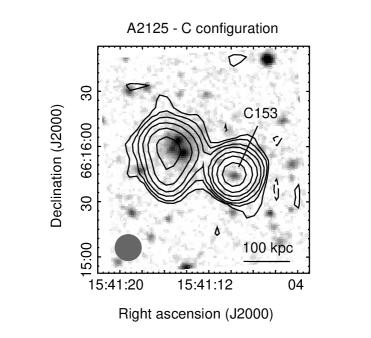
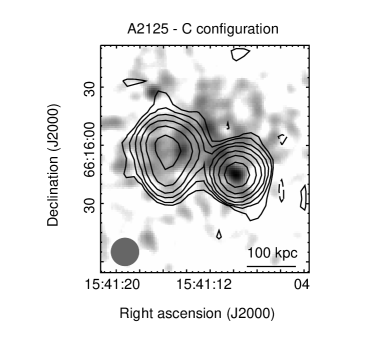
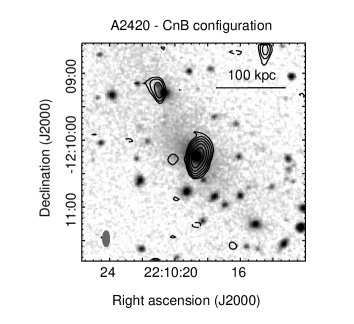
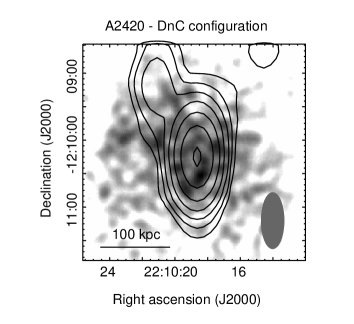
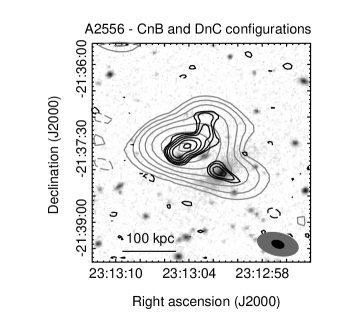
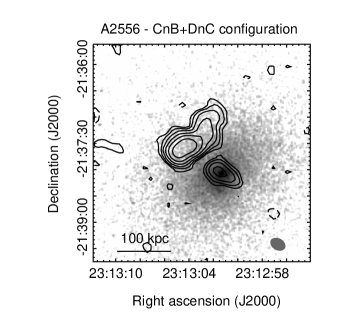
A.1 Notes on individual clusters
A 193. The combined C and D–configuration image (Fig. 9, right upper panel) shows a central double radio source with a flux density of mJy. The combined C–configuration image (Fig. 9, left upper panel) reveals the source to be composed of a bright compact component, coincident with the cluster central galaxy, and a kpc-long “tail” toward North-East (see also Owen et al. (1993) and Owen & Ledlow (1997)). The total flux in this image is mJy, of which mJy are in the compact component.
A 383. A single point source with mJy is detected at cluster central galaxy in all our images (Fig. 9, middle panels). Its size is kpc, based on a Gaussian fit on our highest resolution image, obtained from the combination of the A–configuration observations.
MS 0440.5+0204. A central extended radio source is detected in the C–configuration image (Fig. 9, bottom panels). At the higher-resolution of the A–configuration observation, the source separates into a kpc double, associated with the cluster central galaxy, and a head-tail radio galaxy, identified as a member galaxy (, Gioia et al. 1998). A total flux of mJy is measured on the C–configuration image. This value is consistent with the sum of the flux densities in the double ( mJy) and head tail () measured at higher resolution.
MACS J0429.6-0253. An unresolved source is detected at the cluster center in both A– and B–configuration images (Fig. 10, left upper panel; see also Fig. 7), with a flux density of mJy and mJy, respectively. Based on the A–configuration image, the source is kpc in size.
MS 0839.8+2938. The C–configuration observation detects a central compact radio source, which the B–configuration reveals to be a kpc-long, core-dominated double radio source (Fig. 10, right upper panel; see also Fig. 7). Its flux density is mJy (C configuration) and mJy (B configuration).
A 1204. An unresolved source (size kpc) is detected at the cluster center in the C-configuration image (Fig. 10, middle panels). Its flux density is mJy. An unresolved source is also detected by a slightly higher resolution observation at 5 GHz with the VLA in C configuration (Hogan et al. 2015), with a similar flux of 1.8 mJy, implying a flat spectral index between 1.4 GHz and 5 GHz.
A 2125. A deep radio survey of the cluster region has been carried out by Owen et al. (2005) using the VLA at 1.4 GHz in its A and B configurations. An image of the central cluster region is presented in Owen et al. (2006). The region is occupied by a triple system of optical galaxies, each hosting an extended radio source, and a nearby bright compact radio galaxy, named C153. Here we present a lower resolution image of the cluster center, obtained from an archival VLA observation in C configuration (Fig. 10, bottom panels). The three central sources, individually detected by Owen et al., appear here blended into an single source with a total flux density of mJy. This value is in agreement with the the sum of the flux densities measured by Owen et al. (2005) for these three sources (19.3 mJy). C153 is unresolved in our image; its flux density of mJy is in good agreement with that reported by Owen et al. (22.9 mJy).
A 2420. A slightly extended radio source, oriented north-south and with a flux density of mJy, is detected at the position of the central galaxy in the CnB–configuration image (Fig. 11, left upper panel). In the DnC–configuration image (Fig. 11, right upper panel), the source has a flux of mJy. The compact radio galaxy visible to the north-east has a flux of mJy (CnB configuration) and mJy (DnC configuration).
A 2556. The CnB–configuration and combined CnB+DnC-configuration images (Fig. 11, bottom panels), show an extended radio source associated with the dominant cluster galaxy, with a size of kpc along the NE-SW axis. A radio galaxy with head-tail morphology is located at a projected distance of about kpc from the central galaxy. The flux densities of these sources, measured on the combined image are mJy and mJy, respectively. The two radio galaxies are blended together in the lower-resolution image from the DnC configuration (Fig. 11, left bottom panel)) with a total flux density of mJy.
Appendix B Radio size and average surface brightness of minihalos and halos
In Table 10 we summarize the properties — frequency, angular resolution, sensitivity and the radius of the largest detectable structure (based on full-synthesis nominal values for GMRT, VLA and WSRT) — of the radio images used to estimate the extent of the radio sources in our statistical and supplementary samples (candidates are not included). For each source, the table also lists the measured radius (the average radius of a isocontour, § 2) and the ratio of the source average surface brightness to the rms noise level of the corresponding radio image.
| Cluster name | FWHM | rms () | Reference | ||||
|---|---|---|---|---|---|---|---|
| (GHz) | () | (mJy/beam) | (Mpc) | (Mpc) | |||
| Clusters with minihalos in statistical sample | |||||||
| A 478 | 1.4 | 0.05 | 0.7 | 0.16 | 7.9 | 4 | |
| RBS 797 | 1.4 | 0.04 | 2.2 | 0.12 | 12.2 | 2 | |
| A 3444 | 0.6 | 0.04 | 2.0 | 0.12 | 10.4 | 3 | |
| A 1835 | 1.4 | 0.04 | 1.8 | 0.24 | 23.7 | 2 | |
| AS 780 | 0.6 | 0.07 | 1.9 | 0.05 | 17.0 | 5 | |
| RXC J1504.10248 | 0.3 | 0.10 | 3.3 | 0.14 | 22.7 | 6 | |
| A 2029 | 1.4 | 0.04 | 0.6 | 0.25 | 10.8 | 2 | |
| A 2204 | 1.4 | 0.03 | 0.16 | 0.05 | 7.1 | 4 | |
| RXC J1720.1+2638 | 0.6 | 0.03 | 1.4 | 0.14 | 28.1 | 7 | |
| A 2667 | 1.2 | 0.04 | 1.5 | 0.06 | 5.0 | 2 | |
| Clusters with minihalos in supplementary sample | |||||||
| MACS J0159.80849 | 1.4 | 0.015 | 0.3 | 0.09 | 3.6 | 4 | |
| Perseus | 0.3 | 1.4 | 0.9 | 0.13 | 98.7 | 8 | |
| MACS J0329.60214 | 1.3 | 0.03 | 1.2 | 0.07 | 6.3 | 2 | |
| 2A 0335+096 | 1.4 | 0.04 | 0.3 | 0.07 | 10.2 | 2 | |
| A 907 | 0.6 | 0.05 | 1.5 | 0.06 | 11.0 | 2 | |
| ZwCl 3146 | 0.6 | 0.09 | 2.2 | 0.08 | 6.1 | 5 | |
| RX J1347.51145 | 1.4 | 0.04 | 2.6 | 0.26 | 30.4 | 2 | |
| MS 1455.0+2232 | 0.6 | 0.07 | 2.0 | 0.12 | 4.1 | 9 | |
| RX J1532.9+3021 | 1.4 | 0.01 | 0.3 | 0.10 | 4.3 | 4 | |
| Ophiuchus | 1.4 | 0.12 | 0.25 | 0.25 | 5.8 | 2 | |
| RXC J2129.6+0005 | 0.6 | 0.11 | 1.9 | 0.08 | 4.8 | 5 | |
| Phoenix | 0.6 | 0.04 | 3.4 | 0.23 | 6.7 | 10 | |
| Clusters with radio halos in statistical sample | |||||||
| A 2744 | 1.4 | 0.09 | 2.0 | 0.8 | 12.7 | 34 | |
| A 209 | 1.4 | 0.05 | 1.5 | 0.5 | 9.3 | 12 | |
| A 401 | 1.4 | 0.08 | 0.6 | 0.4 | 3.8 | 2 | |
| PSZ1 G171.9640.64 | 1.4 | 0.12 | 1.9 | 0.6 | 4.5 | 13 | |
| A 521 | 0.2 | 0.22 | 5.1 | 0.7 | 6.5 | 14 | |
| A 520 | 1.4 | 0.03 | 1.5 | 0.5 | 4.2 | 15 | |
| A 665 | 1.4 | 0.07 | 1.4 | 0.7 | 7.0 | 16 | |
| A 697 | 0.3 | 0.15 | 4.1 | 0.6 | 9.6 | 17 | |
| A 754 | 0.3 | 1.0 | 1.0 | 0.6 | 5.1 | 18 | |
| A 773 | 1.4 | 0.03 | 1.6 | 0.5 | 4.7 | 34 | |
| A 1300 | 0.3 | 0.50 | 4.3 | 0.5 | 4.2 | 11 | |
| A 1351 | 1.4 | 0.05 | 2.1 | 0.5 | 3.2 | 19 | |
| A 1443 | 0.3 | 0.36 | 3.9 | 0.6 | 1.8 | 20 | |
| A 1689 | 1.4 | 0.10 | 1.3 | 0.7 | 5.0 | 2 | |
| A 1758a | 0.3 | 0.40 | 4.1 | 0.8 | 3.3 | 11 | |
| A 1914 | 1.4 | 0.05 | 1.3 | 0.6 | 16.7 | 21 | |
| RXC J1514.91523 | 0.3 | 0.27 | 3.4 | 0.7 | 5.5 | 22 | |
| A 2142 | 1.4 | 0.18 | 0.7 | 0.4 | 2.0 | 23 | |
| A 2163 | 1.4 | 0.05 | 1.5 | 1.0 | 23.4 | 24 | |
| A 2218 | 0.6 | 0.07 | 1.5 | 0.4 | 1.7 | 2 | |
| A 2219 | 1.4 | 0.07 | 1.6 | 0.7 | 18.1 | 21 | |
| A 2256 | 0.3 | 0.60 | 3.5 | 0.5 | 7.2 | 25 | |
| A 2261 | 1.4 | 0.05 | 1.6 | 0.5 | 2.8 | 26 | |
| CL 1821+643 | 0.3 | 0.20 | 4.5 | 0.4 | 8.6 | 27 | |
| RXC J2003.52323 | 1.4 | 0.03 | 2.1 | 0.9 | 9.4 | 28 | |
| A 2390 | 1.4 | 0.04 | 1.7 | 0.4 | 8.1 | 26 | |
| RXC J1314.42515 | 0.6 | 0.06 | 1.9 | 0.3 | 3.7 | 12 | |
| Clusters with radio halos in supplementary sample | |||||||
| A 399 | 1.4 | 0.04 | 0.6 | 0.3 | 4.2 | 33 | |
| MACS J0417.51154 | 0.6 | 0.15 | 2.9 | 0.5 | 4.7 | 29 | |
| A 1995 | 1.4 | 0.05 | 2.1 | 0.3 | 4.4 | 30 | |
| A 2034 | 1.4 | 0.04 | 0.9 | 0.3 | 7.0 | 30 | |
| A 2255 | 0.3 | 0.10 | 3.7 | 0.8 | 15.7 | 31 | |
| A 2319 | 1.4 | 0.40 | 0.9aacombination of two VLA pointings offset by . | 0.6 | 6.4 | 32 | |
Note. — Column 1: cluster name. Columns 2–4: frequency, beam FWHM and rms noise (, per beam) of the images used to measure the source radius. Images at 1.4 GHz are from VLA observations, all other frequencies are GMRT observations; for Perseus and A 2255 we used WSRT images. Column 5: radius of the largest linear structure detectable by the observations, as derived from the maximum angular scale that can be imaged reasonably well by long-synthesis observations with the VLA, GMRT and WSRT. Column 6: radius of the central diffuse radio source, defined as in §2, derived from the surface brightness isocontour. Column 7: ratio of the source average surface brightness () and noise level of the image. Column 8: reference for the radio images. Reference code: (1) this work, (2) G17a, (3) G17b, (4) Giacintucci et al. (2014a), (5) Kale et al. (2015), (6) Giacintucci et al. (2011a), (7) Giacintucci et al. (2014b), (8) Sijbring (1993), (9) Venturi et al. (2008), (10) van Weeren et al. (2014), (11) Venturi et al. (2013), (12) Venturi et al. (2007), (13) Giacintucci et al. (2013), (14) Brunetti et al. (2008), (15) Vacca et al. (2014), (16) Giovannini & Feretti (2000), (17) Macario et al. (2010), (18) Macario et al. (2011), (19) Giacintucci et al. (2009a), (20) Bonafede et al. (2015), (21) Bacchi et al. (2003), (22) Giacintucci et al. (2011b), (23) Venturi et al. (2017), (24) Feretti et al. (2001), (25) Brentjens (2008), (26) Sommer et al. (2017), (27) Bonafede et al. (2014), (28) Giacintucci et al. (2009b), (29) Parekh et al. (2017), (30) Giovannini et al. (2009), (31) Pizzo & de Bruyn (2009), (32) Storm et al. (2015), (33) Murgia et al. (2010), (34) Govoni et al. (2001), (35) Vacca et al. (2015).
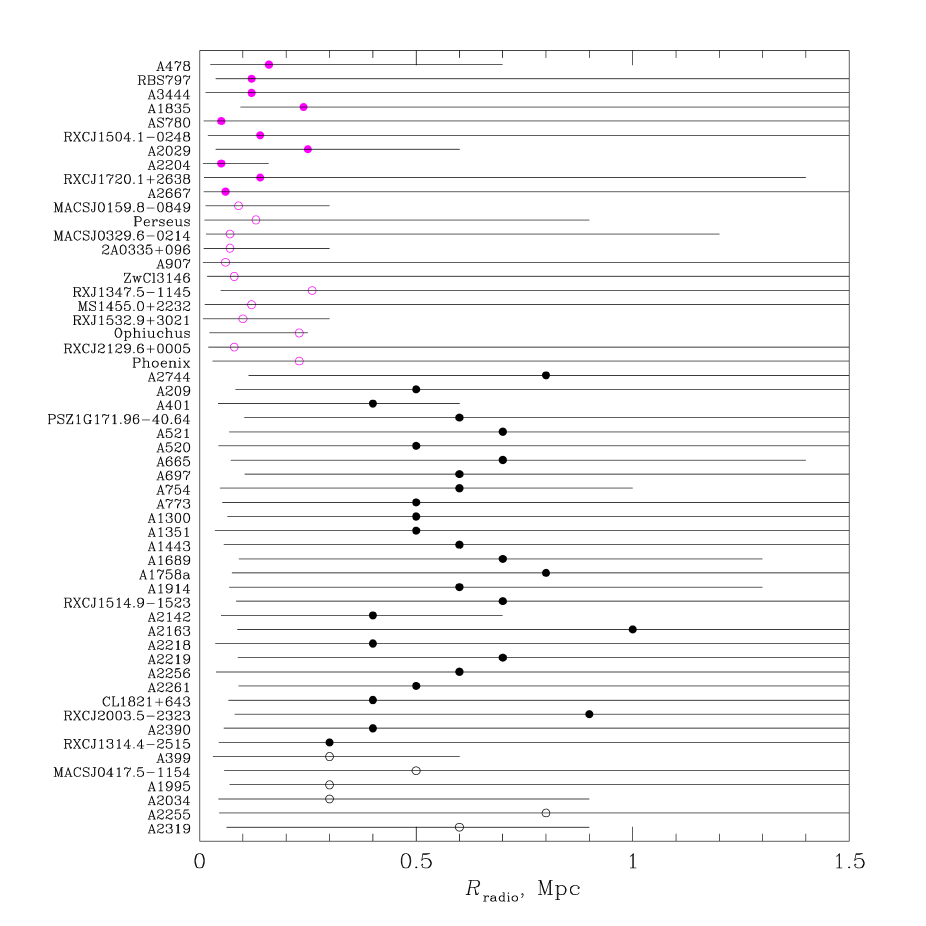
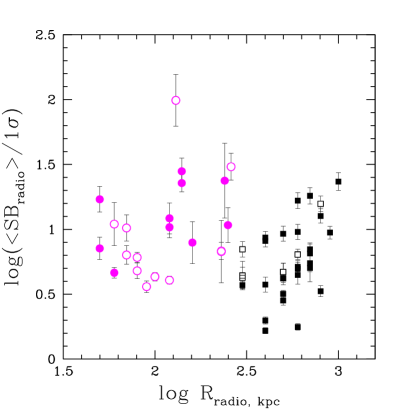
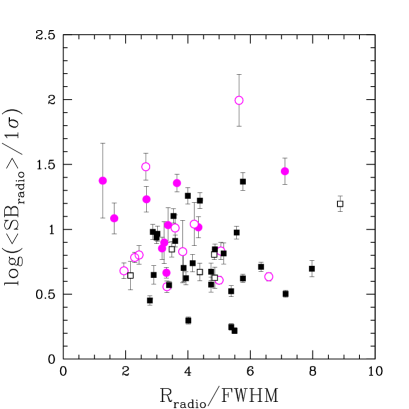
In Fig 12, we compare the measured source radii to the interval of linear scales that can be detected in the respective radio images. The minimum scale is set by the angular resolution of the image (average FWHM, Table 10). We note here that almost all clusters have complementary observations at higher resolution. The maximum scale is the radius of the largest structure that can be detected in this particular observation (Table 10). Even though the actual scale that can be reliably imaged by the observation can be less than the nominal value (due, for instance, to a short exposure or the exclusion of bad data at short baselines), the minihalo and halo radii are typically much less than (one exception is Ophiuchus). This indicates that the observations are not limited by the interferometric coverage; if there was emission outside the minihalo, provided sufficiently low noise, we should be able to detect it well beyond the cool core and, in most cases, on scales comparable to those of large halos. The other obvious instrumental limitation is the noise level — if minihalos and large halos were similar sources with a smoothly declining radial brightness profile, a more sensitive observation would yield a larger radius of the isophote. In Fig. 13, we show the ratio of the source average surface brightness to the image rms noise (Table 10) as a function of the radius in kpc (left panel) or in beam sizes (right panel). There is no correlation between the signal-to-noise ratio and the radius of the halo; the signal-to-noise ratios for the minihalos are similar to those for the large halos and in several cases even slightly higher. This is in agreement with a similar plot for giant halos in Cassano et al. (2007). Based on Figs. 12 and 13, we conclude that most of the minihalo datasets used in this work possess the requisite sensitivity to detect diffuse emission on angular scales greater than the minihalo at a surface brightness level typical of large halos, thus the measured difference between the sizes of minihalos and large halos is physically meaningful. This answers a frequently asked question of whether minihalos are simply the peaks of larger halos in a cluster with the central density peak (and where the radio emission roughly follows the ICM density) — in such a picture, we would be able to detect the rest of the halo emission outside the cool core, and we do not.