Quenching vs. Quiescence: forming realistic massive ellipticals with a simple starvation model
Abstract
The decrease in star formation (SF) and the morphological change necessary to produce the elliptical galaxy population are commonly ascribed to a sudden quenching event, which is able to rid the central galaxy of its cold gas reservoir in a short time. Following this event, the galaxy is able to prevent further SF and stay quiescent via a maintenance mode. We test whether such a quenching event is truly necessary using a simple model of quiescence. In this model, hot gas (all gas above a temperature threshold) in a halo mass galaxy at redshift is prevented from cooling. The cool gas continues to form stars at a decreasing rate and the galaxy stellar mass, morphology, velocity dispersion and position on the color magnitude diagram (CMD) proceed to evolve. By , the halo mass has grown to and the galaxy has attained characteristics typical of an observed elliptical galaxy. Our model is run in the framework of a cosmological, smooth particle hydrodynamic code which includes SF, early stellar feedback, supernova feedback, metal cooling and metal diffusion. Additionally, we post-process our simulations with a radiative transfer code to create a mock CMD. In contrast to previous assumptions that a pure “fade away” model evolves too slowly to account for the sparsity of galaxies in the “green valley”, we demonstrate crossing times of Gyr. We conclude that no sudden quenching event is necessary to produce such rapid colour transitions.
keywords:
1 Introduction
The existence of red elliptical galaxies has perplexed galaxy formation and evolution modelers since the first observations of the bi-modality in the color-magnitude diagram (CMD) by Takamiya et al. (1995). Large-scale surveys such as the Sloan Digital Sky Survey (SDSS) increased the statistical sample and broadened the knowledge of this bi-modality (Strateva et al., 2001; Baldry et al., 2004; Baldry et al., 2006). Before then, the simple morphology and surface brightness profiles of elliptical galaxies lead to the belief that these galaxies were an early stage in the evolution process of galaxies, leading to their commonly used name early-type galaxy.
Further strengthening the distinction of the two populations, research showed bi-modality both locally and at high redshift, not only in galaxy colors and morphologies but also their star formation rates (SFRs) (e.g. Bell et al., 2004; Brammer et al., 2009). Kauffmann et al. (2003) found that red galaxies have on average older stellar populations, higher surface stellar mass densities, and dominate at stellar masses above .
A deeper understanding of stellar evolution has led to the insight that the red color originates from the old stellar populations. Meaning that many “intrinsically” red galaxies are at a later stage in galaxy evolution. Blue galaxies necessarily migrate to the red sequence through a cessation of star formation (Bell et al., 2004; Faber et al., 2007). The resulting gap between the blue galaxies and the red sequence in the CMD is termed the “green valley”. The galaxies in the green valley constitute a transiting population between the two regions (e.g. Bell et al., 2004; Faber et al., 2007; Martin et al., 2007; Schiminovich et al., 2007; Wyder et al., 2007; Mendez et al., 2011; Gonçalves et al., 2012). Various authors have defined the green valley differently, some specifying a region in the UV-optical diagram, some using the optical-optical diagram. Although the precise definition can vary, the results seem to stay consistent.
The more rapid the transition through the green valley, the sparser this region in the CMD will be. But Peng et al. (2010) found the sparsity consistent with an overlap of a fast and a slow quenching mechanism. The timescale commonly used to distinguish fast and slow modes lies around Gyr (Schawinski et al., 2007; Salim, 2014). But Martin et al. (2007) recognised that the number density in the green valley does not deliver a crossing time by itself. Using H and Dn(4000) spectral indices and physically reasonable star formation histories, they found that quenching timescales vary widely and green valley crossing times can be around and above Gyr for some galaxies. Yesuf et al. (2014) used SDSS, GALEX and WISE data to estimate a transit time of Gyr for the slowest galaxies, assuming that by far the majority () of red sequence galaxies follow the slow quenching mode. Trayford et al. (2016) used the EAGLE simulation to estimate crossing times. Although they distinguish between three characteristic evolutionary paths across the green valley, they find no distinct difference in crossing times between them. Using the Galaxy Zoo morphological classification, Smethurst et al. (2015) identified three seemingly distinct quenching timescales: morphologically smooth galaxies quench rapidly, attributed to major mergers. Disc-like galaxies quench on slow timescales caused by secular evolution. Their intermediate population reddens in intermediate timescales, which they attribute to minor mergers and galaxy interactions.
The now commonly used technique to match the luminosity derived stellar masses of galaxies with a dark matter halo mass (generally termed “abundance matching”) gives rise to a clearer picture of how well and efficiently a galaxy at a given dark matter halo mass turns available gas into stars. At halo masses below and above , the star formation efficiency (SFE) decreases significantly. The peak efficiency around is of the order compared to the cosmic baryon fraction. Why star formation is inefficient at high halo masses () is a key question in understanding the existence and formation of “red-and-dead” galaxies.
Galaxy formation models have had trouble simulating the bi-modality of galaxies and, in general, struggle with explaining the low efficiency of star formation especially at the high mass end (e.g. Benson et al., 2003). In attempts at modelling the formation of elliptical galaxies, theorists have proposed and tested a large array of possible mechanisms to quench star formation and trigger a morphological change. In their various implementations, any of these could be a viable physical mechanism preventing the cooling in our quiescence model. The clustering of active galactic nuclei (AGN) host galaxies in the green valley suggest a role for AGN feedback (e.g. Nandra et al., 2007; Hasinger, 2008; Silverman et al., 2008; Cimatti et al., 2013).
In attemps to follow what observations seem to show and ameliorate the over-production of stars, many models implemented both the slow and fast quenching mechanisms by assuming that active galactic nuclei (AGN) quenching (fast) involves episodic, and possibly violent, feedback, while halo quenching (slow) involves the suppression of gas cooling. These models broadly reproduce the colors and mass functions of present day galaxies (e.g. Croton et al., 2006; Cattaneo et al., 2006; Schaye et al., 2015).
Semi-analytical models and hydrodynamical simulations began implementing one mode of AGN feedback (e.g. Di Matteo et al., 2005; Croton et al., 2006; Bower et al., 2006). Based on observations of two different ways in which black holes (BHs) effect surrounding gas, later models distinguished “radio mode” and “quasar mode” feedback (Sijacki et al. 2007; Somerville et al. 2008; Fanidakis et al. 2011, and see also Gutcke et al. 2015 for some effects of the two mode model). The former is induced when BH accretion rates are low, while the latter is active when mergers or disk instabilities trigger high accretion rates. These models successfully create a bi-modal galaxy population with quenched, red galaxies.
But there is still no consensus whether one or two modes are necessary, as shown by recent large-box cosmological simulations such a Illustris Vogelsberger et al. (2014) that employs a two mode model and the Eagle simulations suite Schaye et al. (2015) which uses one mode of AGN feedback. And yet the questions of whether and how the energy released by the AGN can couple efficiently to the surrounding gas is still unresolved (e.g. see Cielo et al., 2014)
At lower galactic masses, feedback from supernovae and stellar winds (e.g. Dekel & Silk, 1986; Murray et al., 2005; Stinson et al., 2013) effectively decreases the amount of gas available in the centers of galaxies and thus forces star formation to dwindle. Another viable quenching scenario is morphological quenching in which a stellar spheroid helps the gas disk to become stable against fragmentation, which leads to less star formation (Martig et al., 2009; Martig et al., 2013; Genzel et al., 2014; Forbes et al., 2014).
The long-term suppression of the external gas supply once the halo mass grows above a threshold mass of also counteracts excessive star formation. This can happen either via virial shock heating (Birnboim & Dekel, 2003; Kereš et al., 2005; Dekel & Birnboim, 2006; Kereš et al., 2009), or by gravitational infall heating (Dekel & Birnboim, 2008; Birnboim & Dekel, 2011; Khochfar & Ostriker, 2008), which can be aided by AGN feedback coupled to the hot halo gas (Dekel & Birnboim, 2006; Cattaneo et al., 2009; Fabian, 2012). The incidence of cosmic rays has been largely neglected in most galaxy evolution models. These energetic particles have the potential to increase the pressure of the gas, retaining energy and preventing it from being radiated away. Increased scale heights of the disc can prevent further star formation (Pfrommer et al., 2016).
Although investigation into quenching mechanisms has gone far and wide, no general agreement has emerged as to which effect dominates in massive galaxies. This has led to models such as Dutton et al. (2015) and Gabor & Davé (2015) who attempt to understand the effects of quenching without defining a physical origin. Motivated by the success of halo quenching models (Cattaneo et al., 2006), Dutton et al. (2015) investigated a ‘forced quenching’ scenario where cooling and star formation are shut off at . They show that this results in present day elliptical galaxies with stellar masses and structural properties in broad agreement with observations.
This paper extends the work of Dutton et al. (2015) by constructing a quiescence model that allows some cooling and star formation to occur after the halo quenching begins. We present the characteristics of the resulting elliptical galaxies and quantify the deviations from observations. Our model makes no assumptions about the cause of the limited cooling and can be compared to all of the above quenching mechanisms.
The structure of this paper is as follows: In section 2 we describe our quiescence model in detail. In section 3 we compare our resulting galaxies to observations: in §3.1 the stellar mass-halo mass relation; in §3.2 the star formation histories (SFHs); in §3.3 the specific star formation rate (sSFR) - stellar mass relation; in §3.4 the CMD; in §3.5 the size-mass relation and in §3.6 the Faber-Jackson relation. Section 4 discusses and summarizes our results.
| Name | |||||||||||
| [K] | [ M⊙] | [M⊙] | [M⊙] | [kpc] | [M⊙] | [M⊙] | [kpc] | [kpc] | million | million | |
| Halo1 | 1.0 | 1.375 | 0.85 | 510 | 20.71 | 1.139 | 2.127 | 1.192 | 1.24 | 1.25 | |
| Halo2 | 1.0 | 1.222 | 1.55 | 509 | 20.71 | 1.146 | 2.033 | 1.114 | 1.26 | 1.04 | |
| Halo3 | 1.0 | 1.229 | 1.17 | 496 | 20.71 | 1.146 | 1.987 | 1.114 | 1.34 | 1.14 | |
| Halo3late | 1.0 | 1.268 | 2.62 | 495 | 20.71 | 1.145 | 2.127 | 1.192 | 1.34 | 1.30 | |
| Halo2h | 1.0 | 1.232 | 1.70 | 490 | 2.6 | 0.140 | 1.060 | 0.600 | 15.4 | 10.05 | |
| Halo1c | - | - | 1.363 | 6.74 | 507 | 20.71 | 1.144 | 2.127 | 1.192 | 1.26 | 1.11 |
| Halo2c | - | - | 1.241 | 8.68 | 492 | 20.71 | 1.147 | 2.127 | 1.192 | 1.26 | 1.07 |
| Halo3c | - | - | 1.268 | 7.5 | 495 | 20.71 | 1.147 | 2.127 | 1.192 | 1.34 | 1.18 |
| H3-5e4 | 0.5 | 1.259 | 0.45 | 472 | 165.7 | 9.509 | 3.989 | 1.709 | 0.17 | 0.17 | |
| H3-1e5P | 1.0 | 1.268 | 1.09 | 471 | 165.7 | 9.416 | 3.989 | 1.709 | 0.17 | 0.17 | |
| H3-1e5 | 1.0 | 1.249 | 0.63 | 471 | 165.7 | 9.416 | 3.989 | 1.709 | 0.17 | 0.17 | |
| H3-5e5 | 5.0 | 1.223 | 1.11 | 468 | 165.7 | 9.453 | 3.989 | 1.709 | 0.17 | 0.17 | |
| H3-1e6 | 10.0 | 1.219 | 1.54 | 467 | 165.7 | 9.262 | 3.989 | 1.709 | 0.17 | 0.17 |
2 Numerical Simulations
Numerical simulations have been performed using a improved version of the smooth particle hydrodynamics (SPH) code gasoline (Wadsley et al., 2004; Keller et al., 2014), this new version promotes mixing and strongly alleviates the well known issues of the classical SPH formulation (Agertz et al., 2007). The baryonic physics treatment is the same adopted for the NIHAO simulation suite (Wang et al., 2015). Namely the code includes a subgrid model for metals mixing (Wadsley et al., 2008), ultraviolet heating and ionization and cooling due to hydrogen, helium and metals as detailed in Shen et al. (2010).
The star formation and stellar feedback follow the implementation of the MaGICC simulations by Stinson et al. (2013). We set the star formation threshold as suggested in Wang et al. (2015), using a critical density of 5.17 cm-3. The density threshold is defined as a kernel of 52 gas particles within a sphere of radius equal to the softening length. Stars can return energy back to the inter-stellar medium (ISM) via blast-wave supernova (SN) feedback (Stinson et al., 2006) and via ionizing radiation from massive stars (early stellar feedback) before they turn in SN (Stinson et al., 2013). Metals are produced by type II and type Ia SN. Stars also return mass to the ISM via asymptotic giant branch stars. We adopt a Chabrier (2003) stellar initial mass function which sets the fraction of stellar mass that results in SN and winds.
We select three haloes with a present-day mass of about from the Planck simulations from Dutton & Macciò (2014) to be re-run at higher resolution. The initial conditions were created using a modified version of grafic2 (Penzo et al., 2014); the starting redshift is .
We run three halos which we call Halo1, Halo2 and Halo3. Halo1 has a quiescent merger history, while Halo2 and Halo3 have one major merger each (at 11 Gyr and 7 Gyr, respectively) and some minor mergers in their past. We also run a control simulation of each halo without any changes to the cooling (Halo1c, Halo2c, Halo3c). To check for convergence, we run Halo2 at three different resolution levels and Halo3 at two. See table 1 for an overview of the simulations and the halo properties.
We use the Amiga Halo Finder (AHF, Knollmann & Knebe 2009) to identify gravitationally bound structures and to track these throughout cosmic time. We rely on the AHF output for estimating the viral radius, which is defined so that it encloses an overdensity of 200 times the critical density of the Universe.
2.1 A simple model of quiescence
Numerical simulations without any form of feedback consistently overestimate the number of stars created in low mass and high mass galaxies. At the low mass end, it has become accepted to implement feedback from supernova and even radiation from young stars. For high mass galaxies often AGN feedback is assumed to limit the cooling. But observations are still very ambivalent as to whether this heating mechanism truly is able to affect such a large fraction of the gas in the centers of galaxies (see Cielo et al. 2014 for numerical simulations showing this). Many other physical mechanisms have been tested in simulations to limit SF, each varying in physical viability and success.
Here we are interested in a much simpler question: would it be enough to prevent accretion of cold gas to create a realistic elliptical galaxy? In other words, can we create a red-and-dead galaxy simply by starving galaxies above a critical mass? To test this, we implement a very simple model to force a quiescent evolution: up to a critical total mass (called ) a galaxy is allowed to evolve freely. Then, once this mass is reached we shut off cooling for all gas particles above a critical temperature . The critical mass and temperature are the only two parameters of our simple model. It is important to notice that even for haloes above we halt neither cooling nor star formation completely. Cold gas (i.e. below ) is still able to cool and form stars, which in turn will be sources of stellar feedback. We simply prevent the cooling (and hence accretion) of gas above onto the galaxy.
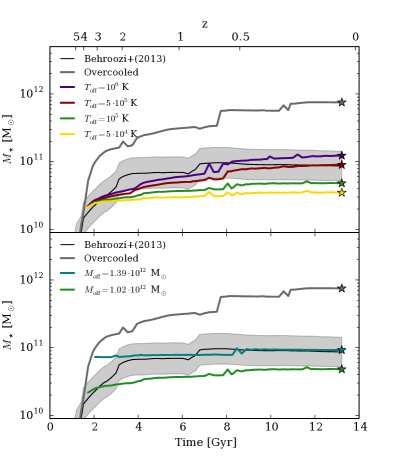
In figure 1 we show the effects of different choices for the two parameters in our model on the evolution of the stellar mass for Halo3 at low resolution (third part of Table 1). Here and in the rest of this work, the stellar mass is defined as all stellar particle masses within 0.1. The black line shows the expected evolution of the stellar mass according to abundance matching results from Behroozi et al. (2013), the (thick) dark grey line represents the simulation without suppressed cooling which overproduces the final stellar mass by a factor of almost 10. In the upper panel we present results for four different values of at a fixed , while in the lower panel we vary at a fixed K.
This simple study seems to justify using . However, increased resolution slightly changes the star formation history (due to lower stellar mass, see Mayer et al., 2008) and we have to increase to to get the correct final stellar mass. So, for the rest of this work, the fiducial parameters for our model are: K and . There is some variation from simulation to simulation in the parameter , given that we restart from the snapshot with a halo mass closest to the fiducial value, and snapshots are on average 200 Myr apart. Given the intrinsic simplicity of our model we didn’t see the need for any more fine tuning of our parameters.
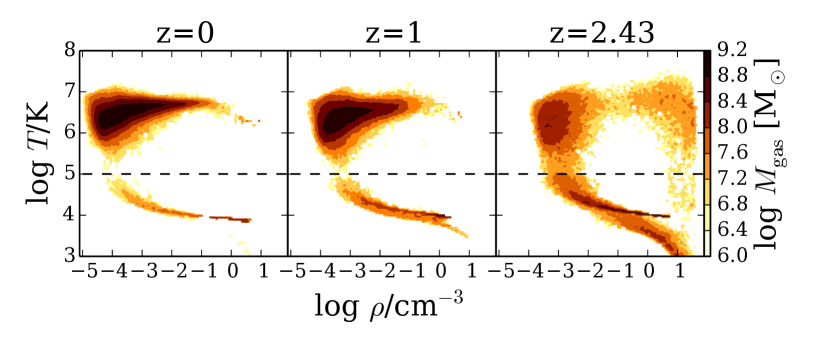
Fig. 2 shows the phase diagram for Halo3 at three redshifts, , , and . The black dashed line indicates our choice of . This choice is in line with previous studies such as Gabor & Davé (2015). They heat the circum-galactic gas to K, preventing further star formation and successfully producing hot halos. The temperature is a local minimum in the cooling curve of simulations, distinguishing free-free emission and helium cooling. The temperature break forces the Halo3 phase diagram to separate along this temperature, resulting in a hot halo phase in the upper left and a denser, colder disk phase below our temperature threshold. The disc phase ( K, cm-3) is depleted over time since each cycle of star formation produces stellar winds and supernovae that heat a fraction of the gas to above the threshold temperature, thus making it unavailable for further cooling and star formation.
In this analysis, we are interested in affecting the gas and creating a galaxy that has a morphology and other properties typical of the elliptical population. This allows us to get a grasp on the conditions necessary in simulations for creating a quiescent environment. Our primary concern is to understand whether a pure fade-away model where gas is slowly consumed by star formation can match observational constraints without an abrupt, violent quenching event. The quiescence model makes no assumptions about the physical process that quenches a galaxy. Being agnostic about the mechanism can be used to our advantage. It can in principle be either a model of inefficient cooling or of a supplementary heating mechanism that counteracts cooling. This way, our results can be freely compared to a variety of quenching models.
3 Comparing to observations
We compare our model galaxies with observations of elliptical galaxies. We compare the stellar mass-halo mass relation, the SF history, the size-mass relation, the stellar mass-velocity dispersion relation and the transition from the blue cloud to the red sequence on the color magnitude diagram. To obtain a fairer comparison with observables, we run the Monte Carlo radiative transfer code SUNRISE (v5.0, Jonsson, 2006). The code uses the stellar population synthesis model Starburst99 (Leitherer et al., 1999), assumes a Kroupa initial mass function (IMF) and traces 10 million rays par galaxy. The calculation includes dust estimates that absorb and scatter the rays. The dust mass is set to 0.4 times the metal mass for each gas particle. Additionally, dust within the birth cloud around newly formed star particles ( Myr) is modeled in sub-grid using MAPPINGS III (Groves et al., 2008).
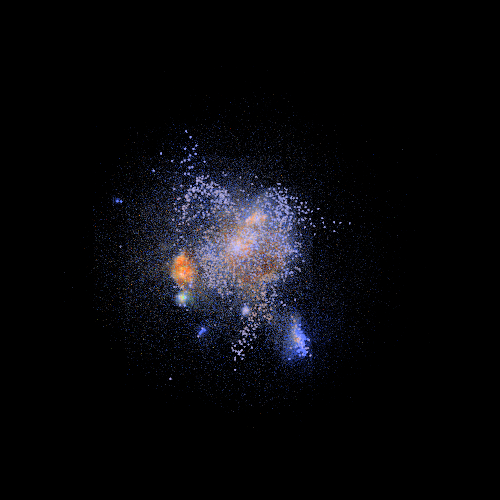
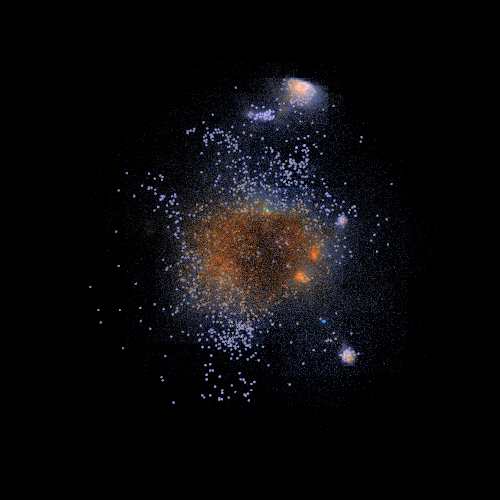
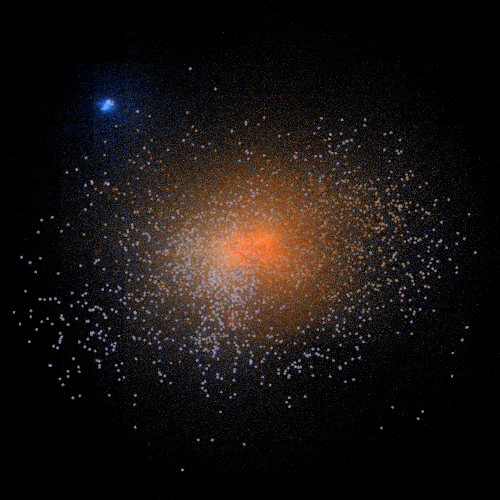
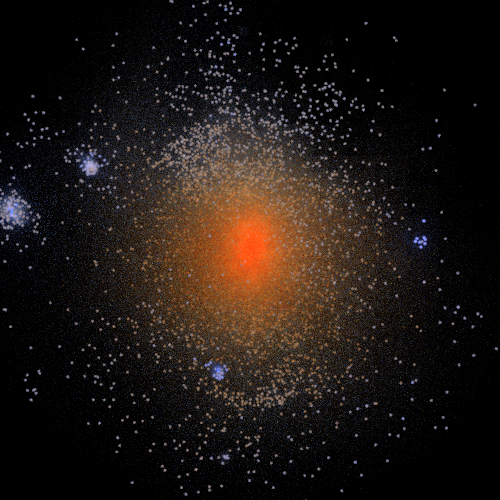
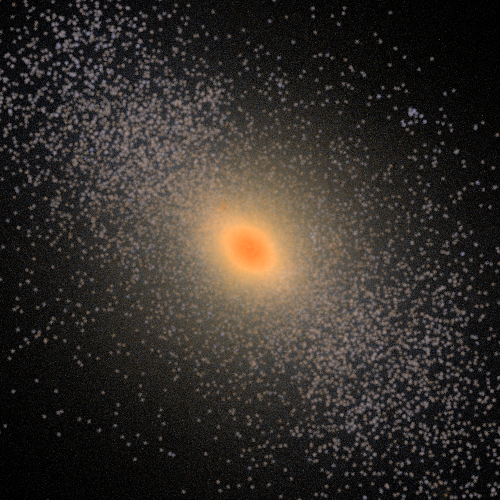
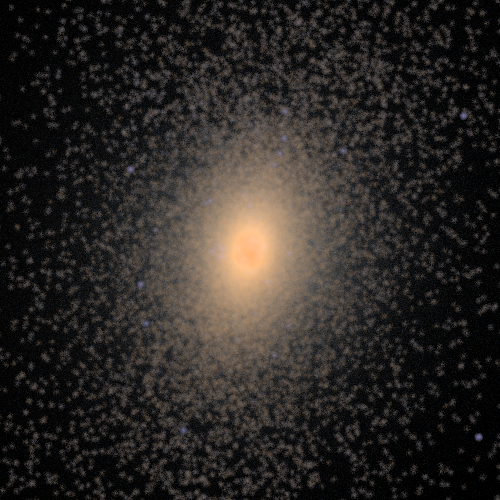
For the transformation from the particle positions to the grid needed by SUNRISE, the radius of a gas particle is defined as the distance to the 32nd nearest neighbour. The stellar radius is defined as 0.2 times the gravitational force softening. Figure 3 shows six SUNRISE images of the Halo1. From left to right the redshifts (Gigayears) are 2.9 (2.2), 2.6 (2.5), 1.8 (3.5), 1.6 (4.0), 0.7 (7.1) and 0.0 (13.8) Morphologically, the galaxies look elliptical and red.
3.1 Stellar mass - halo mass relation
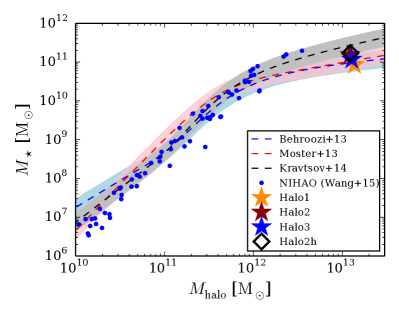
The relation between the stellar mass of a galaxy and the total mass of the halo including dark matter is a strong constraint on galaxy formation models. For the stellar mass, , we consider all stars within of the virial radius, . The total halo mass, , includes all particles within . The relation constructed between these two quantities is our primary observational constraint, and we choose our two model parameters to reproduce it. Figure 4 shows the abundance matching results for - from Moster et al. (2013), Behroozi et al. (2013) and Kravtsov et al. (2014). The star markers show our three elliptical halos at and the blue dots show the high resolution NIHAO sample. The NIHAO sample follows the relation across two orders of magnitude in halo mass, from . Our quiescence model galaxies also lie on the relation at . In this context, our model is the high mass extension of the NIHAO sample.
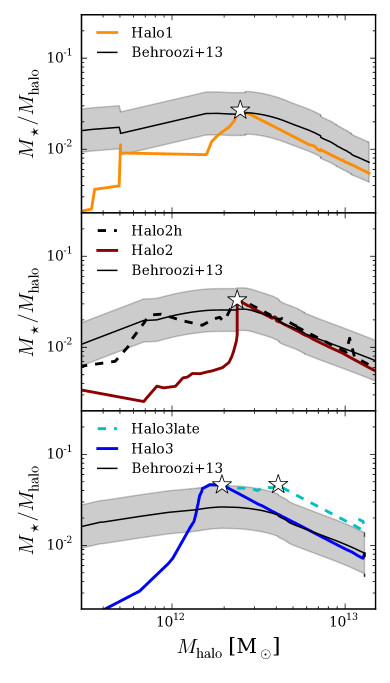
Figure 5 shows the evolution of -/ of our three galaxies (one galaxy per panel) at the fiducial resolution level. The black stars mark the point at which the cooling mode is switched from regular metal-line cooling to the quiescence mode. The black solid lines show the abundance matching results reported by Behroozi et al. (2013), where the gray band encloses the scatter. We match the slope of the relation after the onset of the quiescence mode by construction, since the parameter determines its behaviour. A lower produces a steeper slope, while a higher produces a flatter evolution. The parameter was also chosen to match this relation since the knee generally appears around . Halo3 in the lowest panel of figure 5 shows a slight bump above the abundance matching area around due to a merger. We also show the relation for Halo3late, which is the same as Halo3 except that is higher by a factor of about two. This leads to a higher final stellar mass. The change in final stellar mass and the intrinsic scatter in the Behroozi et al. (2013) relation show that a range of are allowed while still reproducing the necessary shape.
3.2 Star formation history
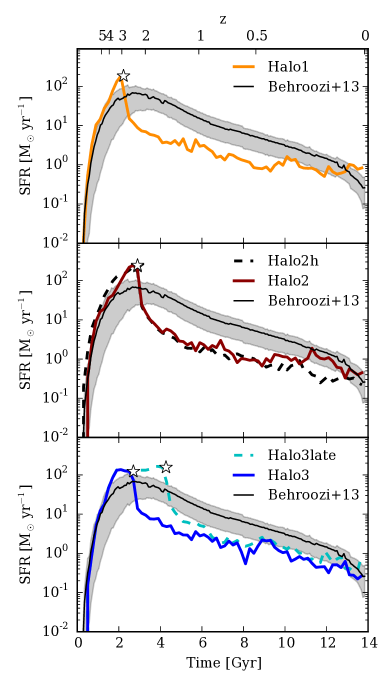
The abundance matching technique predicts the expected stellar mass for a given halo mass at a given time. This information can be translated into the star formation rate of a galaxy throughout it’s lifetime, it’s star formation history (SFH). The SFH is constructed by considering the formation time of all stars and summing their mass in bins of Gyr. Figure 6 shows the SFHs of each galaxy. The SF decreases over time after the onset of the quiescence mode (the black star in each panel). The initial ( Gyr) and the final ( Gyr) times broadly agree with the abundance matching results (black solid line, Behroozi et al., 2013). It should be noted that the SFHs from abundance matching shown here are for generic galaxies with halo masses in the range . Our galaxies’s final halo masses all fall within this range.
Due to the swiftness with which the star formation drops at the onset of the quiescence mode, there is a discrepancy at intermediate times ( Gyr). Again, we compare Halo3 (blue line) and Halo3late (light blue dotted line) where the cooling mode is switched later, at . The SF drops to values below yr-1 after the switch and then progesses similarly to Halo3. From figure 5, we know the final stellar mass lies just outside the range of the abundance matching relation. This shows that some amount of scatter in is necessary (and expected) to reproduce the knee of the relation.
The intermediate times are not reproduced by these SFHs and we acknowledge the limitations of the model in this respect here, since we are not trying to produce the diversity of galaxies and SFHs seen in observations with this simulation. Ours is a heuristic quenching model with which we are merely trying to show that it can make large ellipticals. In the central panels the black dashed line shows results for the high resolution version of Halo2 (Halo2h); the fiducial and high resolution simulations agree well.
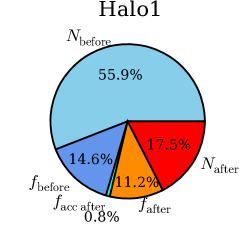
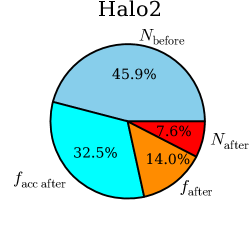
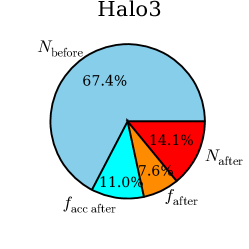
Figure 7 shows the origin of all stars in each halo at . The red and orange wedges are the fraction of stars that formed (in-situ and ex-situ) after the change in cooling mode. The total percentages are 28.7%, 21.6% and 21.7% for Halo1, Halo2 and Halo3, respectively. This means a small, but non-negligible fraction of stars form at late times after the onset of the quiescence model. The accreted fraction, or fraction of stars formed ex-situ is 26.6%, 46.5% and 18.6%, respectively, in good agreement with the results from the Illustris simulation (Rodriguez-Gomez et al., 2016), in which quenching is achieved via AGN feedback using both radio and quasar mode.
3.3 Specific star formation rate
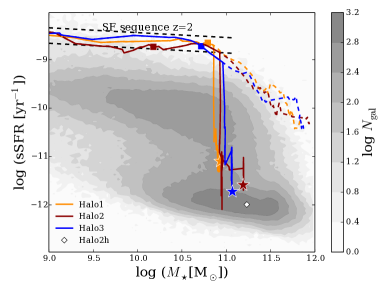
The specific star formation rate (sSFR) defined as SFR/M∗ is a measure of the efficiency with which a galaxy turns gas into stars. The bi-modality of “blue” and “red” galaxies is apparent in their sSFRs. The distribution of galaxies in the stellar mass - sSFR plane shows a clear distinction between the “star forming main sequence” of galaxies with sSFRyr-1 at and a population of galaxies with higher average stellar masses and sSFRyr-1. Figure 8 shows the SDSS density of galaxies on this plane as a grey contours. The stellar masses are taken from Kauffmann et al. (2003) and Salim et al. (2007) while the sSFRs are from Brinchmann et al. (2004).
Our galaxies’s evolutionary tracks are the coloured lines as detailed in the legend. Their and positions are marked by squares and stars, respectively. The star forming main sequence from Daddi et al. (2007) is shown as the area between the two black dashed lines. The tracks evolve on this sequence until the cooling mode is changed. Then they lose the majority of their active star formation and arrive at sSFRs of yr-1. These values are in agreement with massive galaxies in the SDSS observations. The dashed lines in the respective colours show the evolution of the galaxies without a switch into quiescence mode. In this case, the sSFRs decrease more slowly and don’t arrive at the low values necessary to match the SDSS sample.
We note that models such as Dutton et al. (2015), although similar in other respects, will not be able to reproduce the sSFR as our model does. Their model has zero SF after and, thus, predicts no absolute value for the sSFR at late times. As shown in figure 7, of the order of of our final stellar mass is formed after the cooling mode switch. This amount of SF is in agreement with the SDSS measurements of the present-day sSFR of massive ellipticals.
3.4 Color magnitude diagram - The green valley
The relatively sparse number of galaxies populating the color magnitude diagram between the blue cloud and the red sequence, a.k.a. the green valley, presents a difficulty in understanding the transition from blue, star forming galaxies to red-and-dead galaxies. In this work, we will use the term green valley to describe the region of the UV-optical diagram between , following Salim (2014). Other authors have defined it in different ways, which we note might lead to variations to the results we present here. This difficulty lies in the expected time it takes for a chromatic and morphological transition.
SDSS/GALEX data (, see Salim et al. 2007) obtain an estimate of approximately 1 Gyr for the transition. To compare our galaxies’s evolutionary paths across the green valley, we run the radiative transfer code SUNRISE to take the dust extinction and induced reddening into account. We obtain mock fluxes of the Sloan -band and the GALEX near ultra-violet (NUV) filter at a few redshifts. The derived magnitudes are rest-frame magnitudes inside our SUNRISE box of kpc.
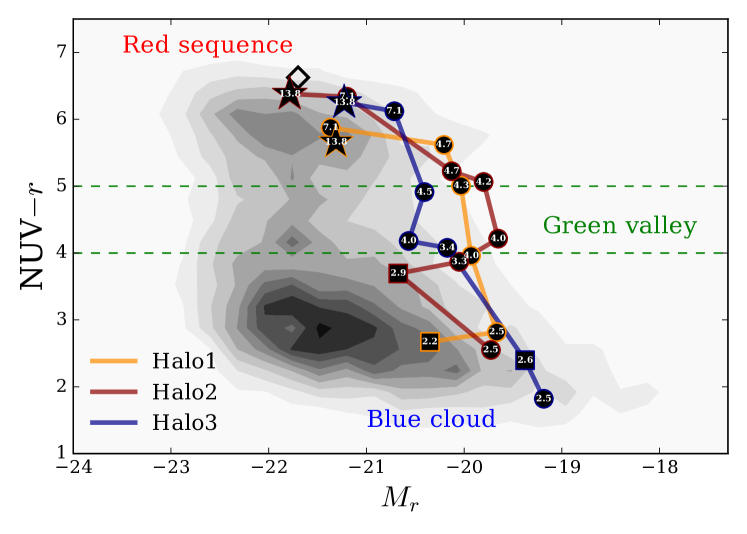
The resulting tracks across the CMD are shown in figure 9. The grey contours are the SDSS/GALEX density map. We follow Salim (2014) and define the green valley between NUV-. The lines constitute the tracks of our three galaxies, while the black dots show the points at which a radiative transfer calculation was made. The number in the dots denotes the time in Gigayears at each point. Halo2 (dark red line) transits the green valley between Gyr and Gyr. Consequently, it transits the green valley in approximately Gyr. Halo3 (blue line) crosses in Gyr, while Halo1 (dark yellow line) has an even shorter transit time of Gyr. Finally, since we have a finite number of simulations outputs, we approximate the error on the crossing times with the average time between two consecutive snapshots, which is around Gyr.
The SUNRISE dust model affects the resulting magnitudes most strongly during ongoing SF, because new stars are assumed to stay enshrouded in their birth cloud for up to Myr. Without SF, the dust mass scales with the gas metallicity. This effect is important after the cooling switch, since much gas is initially still in the central galaxy. With time, the effect decreases since gas, and hence dust, is expelled due to feedback. It is worth noting that our galaxies do not cross the green valley along the area of highest density in the observations, which would be around . Instead, they cross around and become brighter after transiting the green valley. Since there is little SF at late times, this brightening is caused by the loss of dust in the galaxy. Decreasing cold gas fractions in the center cause the estimated dust extinction to decrease when more gas is heated and held in the hot halo outside of the galaxy.
We acknowledge that there are many parameters in the SUNRISE model that could change the resulting magnitudes, i.e. the grid cell size and the dust grain size among others. Due to the simplicity of our starvation model, we did not see the need to fine tune these. The important result of this exercise is that the relative change in color (here the NUV-) happens in less than 1 Gyr. We expect this relative result to be less affected by the specific model parameters.
Moreover, our model is just one quenching scenario to rapidly cross the green valley. Authors such as Smethurst et al. (2015) and Trayford et al. (2016) show that different galaxy populations might well quench through a variety of mechanisms that happen with differing timescales. Some proposed causes of reddening and morphological change are secular evolution, major mergers and AGN.
3.5 Sizes and profiles
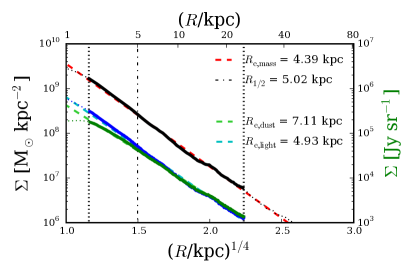
Matching the sizes of elliptical galaxies in simulations has been notoriously difficult, generally producing too compact centers. This difficulty might in part be related to the task of measuring the size in a comparable manner. Figure 10 shows the SUNRISE surface brightness profile in radial annuli (green with dust and blue without). The cyan and light green dashed lines shows de Vaucouleur (Sersic profile with ) fit to the surface brightness profile and the resulting effective radius is shown in the legend. The fit is performed in the radial range from 3 smoothing lengths (kpc for the fiducial resolution) out to 25 kpc. The fitting range is shown between the vertical dotted lines. We compare the light profile with the mass profile by projecting the galaxy onto the same axis as the SUNRISE image, resulting in a surface mass density profile. The same fit is performed and shown as a red dashed line. The dot-dashed line shows half-mass radius, , obtained from the integrated stellar mass profile as indicated in the legend.
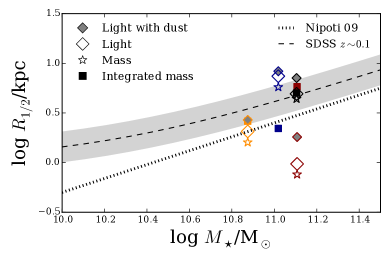
Figure 11 shows the sizes of all three galaxies using all four of the above measures. The filled squares are the half-mass sizes when considering the integrated mass profile, . The gray and open diamonds are the effective radius from the fit to the surface brightness profile with and without dust, and respectively. The open star symbols are the sizes derived from the surface density profiles, . We compare these with the fitting function (black dashed line) from Dutton et al. (2013) who used SDSS early-type galaxies within the redshift range and a median redshift of to produce the average as well as the and percentiles (grey area) of the observational sample. The observed relation from Nipoti et al. (2009) who used the SLACS sample of local early-type galaxies is shown as a black dotted line.
The extent of Halo1 and Halo2h are in good agreement with the observational data. Halo3 has a dense stellar core which decreases the integrated mass profile and is too compact to be consistent with a deVaucouleur in the center. The profile of Halo2 is different from its high resolution counterpart due to an incoming merger. We are only able to fit the central part of the profile (kpc) and, thus, get a steeper slope and smaller size. The integrated mass profile for both Halo2 (dark red) and Halo2h (black) are well within the observational constraints. The similarity of the high resolution Halo2h with the lower resolution Halo2 sizes gives confidence to the results of our fiducial resolution simulations. Given this simple quiescence model, the agreement between the simulation and observations is encouraging.
3.6 Faber-Jackson relation
The stellar mass - stellar velocity dispersion relation is one projection of the fundamental plane of elliptical galaxies. Elliptical galaxies have on average higher velocity dispersions than star-forming galaxies. This kinematical change is likely linked to the quenching mechanism and therefore provides a critical constraint for quenching models.
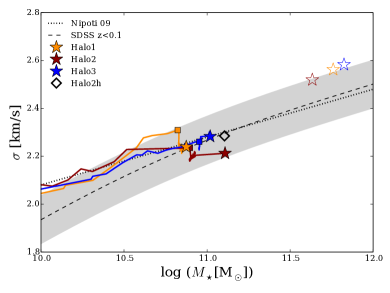
Figure 12 shows where on the relation our three galaxies fall at . Lines in the appropriate color show the tracks of each galaxy up to . To portray the observational relation, we show the analytical fit to SDSS early-type galaxies () from Dutton et al. (2013) as a black dashed line and the scaling relation derived by Nipoti et al. (2009) (using SLACS early-type galaxies at ) as a black dotted line.
Both Halo1 and Halo3 fall directly on the mean today, while Halo2 lies slight below but still inside the scatter. The high resolution version of Halo2 sits on the mean. The simulations without a change in the cooling mode produce velocity dispersion values too high for their given stellar mass, as shown with the open star symbols. This is corrected with our simple quiescence model.
4 SUMMARY
In this paper we have critically examined the properties exhibited by massive galaxies whose star formation is quenched entirely by starvation. The starvation is initiated by means of a simple quiescence model in which all halo gas above a threshold temperature is prevented from cooling. This is a simple way to simulate the effects of star formation fading away. Existing stars drive winds and end as supernovae, removing cold gas from the galaxy. The cold gas reservoir is depleted over time because it is: 1) turned into stars or 2) heated. Each cycle of star formation heats a varying fraction of the star forming gas to above the temperature threshold. The threshold temperature, , and halo mass at which the switch is initiated, , are chosen to match the halo mass - stellar mass relation derived by abundance matching.
Over time, this causes less and less gas to be available for future cycles of star formation. Since we switch to this cooling mode at the height of SF (SFRyr-1), the initial effect is large and SF drops quickly (to SFRyr-1 in Gyr). Later, the SFR slowly settles down to a value of yr-1.
The resulting galaxy properties are compared to an array of observations. The SFRs follow the downward trend after the height of SF at around . But they are about 1 dex too low at intermediate times (). We vary the parameter to show that a galaxy-to-galaxy scatter in the quenching time may smooth the knee of the SFH derived from abundance matching. Since we do not include other galaxy types, we don’t expect it to be able to represent the overall envelope. The sSFR evolution with increasing stellar mass initially follows the SF main sequence and then drops to low values (sSFR) in accordance with the SDSS values for the quenched population at .
A key insight of this paper is that allowing star formation to fade by starvation can produce green valley crossing times of well below 1 Gyr, contrary to common assumptions of the opposite. We were able to show this by performing radiative transfer post-processing on the evolving galaxies and estimating their mock -band and fluxes. These were used to construct evolutionary tracks across the CMD and estimating crossing times. The three galaxies presented in this work deliver crossing times in the range Gyr. The swiftness of the chromatic transformation is surprising and we conclude that the quenching process does not require a single event that instantaneously rids the galaxy of its gas reservoir. Rather a gradual process in which the gas is heated and made unavailable for SF is sufficient to produce the required transformation. Although we note that this result is dependent on our quenching model, and also on the dust modelling in SUNRISE.
Additionally, we compare the mass profiles and resulting sizes of our galaxies with the observed elliptical population at . These match surprisingly well. The two galaxies with smaller stellar masses might be slightly too compact, depending on the method of calculating the sizes. Dust affects the sizes to some degree, making them slightly larger due to the decreased brightness in the central regions of the galaxies. Also the velocity dispersion at matches observations, signifying that the stellar kinematics correctly change with the morphological transformation.
We recognise that this simple model is too simple to delve further into the properties of these elliptical galaxies. It is necessary to move towards more physically motivated models of quenching in future work to be able to further understand the quenching process.
Acknowledgments
We thank the anonymous referee for very helpful and constructive comments. We thank Aura Obreja and Glenn van de Ven for helpful suggestions and useful conversations. The simulations were run using the galaxy formation code GASOLINE2, developed and written by Tom Quinn and James Wadsley. Without their contributions, this paper would have been impossible. TAG and AVM acknowledge funding by Sonderforschungsbereich SFB 881 “The Milky Way System” (subproject A1) of the German Research Foundation (DFG). The analysis was performed using the pynbody package (http://pynbody.github.io/, Pontzen et al., 2013), written by Andrew Pontzen and Rok Roškar. This research was carried out on the High Performance Computing resources at New York University Abu Dhabi; on the theo cluster of the Max-Planck-Institut für Astronomie and the hydra cluster at the Rechenzentrum in Garching through the Collaborative Research Center (SFB 881) “The Milky Way System” (subproject Z2), hosted and co-funded by the Jülich Supercomputing Center (JSC). We are happy to use pie charts in a scientific publication that show something other than the cosmological distribution of matter and energy in the Universe.
References
- Agertz et al. (2007) Agertz O., et al., 2007, MNRAS, 380, 963
- Baldry et al. (2004) Baldry I. K., Glazebrook K., Brinkmann J., Ivezić Ž., Lupton R. H., Nichol R. C., Szalay A. S., 2004, ApJ, 600, 681
- Baldry et al. (2006) Baldry I. K., Balogh M. L., Bower R. G., Glazebrook K., Nichol R. C., Bamford S. P., Budavari T., 2006, MNRAS, 373, 469
- Behroozi et al. (2013) Behroozi P. S., Wechsler R. H., Conroy C., 2013, ApJ, 770, 57
- Bell et al. (2004) Bell E. F., et al., 2004, ApJ, 608, 752
- Benson et al. (2003) Benson A. J., Bower R. G., Frenk C. S., Lacey C. G., Baugh C. M., Cole S., 2003, ApJ, 599, 38
- Birnboim & Dekel (2003) Birnboim Y., Dekel A., 2003, MNRAS, 345, 349
- Birnboim & Dekel (2011) Birnboim Y., Dekel A., 2011, MNRAS, 415, 2566
- Bower et al. (2006) Bower R. G., Benson A. J., Malbon R., Helly J. C., Frenk C. S., Baugh C. M., Cole S., Lacey C. G., 2006, MNRAS, 370, 645
- Brammer et al. (2009) Brammer G. B., et al., 2009, ApJ, 706, L173
- Brinchmann et al. (2004) Brinchmann J., Charlot S., White S. D. M., Tremonti C., Kauffmann G., Heckman T., Brinkmann J., 2004, MNRAS, 351, 1151
- Cattaneo et al. (2006) Cattaneo A., Dekel A., Devriendt J., Guiderdoni B., Blaizot J., 2006, MNRAS, 370, 1651
- Cattaneo et al. (2009) Cattaneo A., et al., 2009, Nature, 460, 213
- Chabrier (2003) Chabrier G., 2003, PASP, 115, 763
- Cielo et al. (2014) Cielo S., Antonuccio-Delogu V., Macciò A. V., Romeo A. D., Silk J., 2014, MNRAS, 439, 2903
- Cimatti et al. (2013) Cimatti A., et al., 2013, ApJ, 779, L13
- Croton et al. (2006) Croton D. J., et al., 2006, MNRAS, 365, 11
- Daddi et al. (2007) Daddi E., et al., 2007, ApJ, 670, 156
- Dekel & Birnboim (2006) Dekel A., Birnboim Y., 2006, MNRAS, 368, 2
- Dekel & Birnboim (2008) Dekel A., Birnboim Y., 2008, MNRAS, 383, 119
- Dekel & Silk (1986) Dekel A., Silk J., 1986, ApJ, 303, 39
- Di Matteo et al. (2005) Di Matteo T., Springel V., Hernquist L., 2005, Nature, 433, 604
- Dutton & Macciò (2014) Dutton A. A., Macciò A. V., 2014, MNRAS, 441, 3359
- Dutton et al. (2013) Dutton A. A., Macciò A. V., Mendel J. T., Simard L., 2013, MNRAS, 432, 2496
- Dutton et al. (2015) Dutton A. A., Macciò A. V., Stinson G. S., Gutcke T. A., Penzo C., Buck T., 2015, MNRAS, 453, 2447
- Faber et al. (2007) Faber S. M., et al., 2007, ApJ, 665, 265
- Fabian (2012) Fabian A. C., 2012, ARA&A, 50, 455
- Fanidakis et al. (2011) Fanidakis N., Baugh C. M., Benson A. J., Bower R. G., Cole S., Done C., Frenk C. S., 2011, MNRAS, 410, 53
- Forbes et al. (2014) Forbes J. C., Krumholz M. R., Burkert A., Dekel A., 2014, MNRAS, 438, 1552
- Gabor & Davé (2015) Gabor J. M., Davé R., 2015, MNRAS, 447, 374
- Genzel et al. (2014) Genzel R., et al., 2014, ApJ, 785, 75
- Gonçalves et al. (2012) Gonçalves T. S., Martin D. C., Menéndez-Delmestre K., Wyder T. K., Koekemoer A., 2012, ApJ, 759, 67
- Groves et al. (2008) Groves B., Dopita M. A., Sutherland R. S., Kewley L. J., Fischera J., Leitherer C., Brandl B., van Breugel W., 2008, ApJS, 176, 438
- Gutcke et al. (2015) Gutcke T. A., Fanidakis N., Macciò A. V., Lacey C., 2015, MNRAS, 451, 3759
- Hasinger (2008) Hasinger G., 2008, A&A, 490, 905
- Jonsson (2006) Jonsson P., 2006, MNRAS, 372, 2
- Kauffmann et al. (2003) Kauffmann G., et al., 2003, MNRAS, 346, 1055
- Keller et al. (2014) Keller B. W., Wadsley J., Benincasa S. M., Couchman H. M. P., 2014, MNRAS, 442, 3013
- Kereš et al. (2005) Kereš D., Katz N., Weinberg D. H., Davé R., 2005, MNRAS, 363, 2
- Kereš et al. (2009) Kereš D., Katz N., Fardal M., Davé R., Weinberg D. H., 2009, MNRAS, 395, 160
- Khochfar & Ostriker (2008) Khochfar S., Ostriker J. P., 2008, ApJ, 680, 54
- Knollmann & Knebe (2009) Knollmann S. R., Knebe A., 2009, ApJS, 182, 608
- Kravtsov et al. (2014) Kravtsov A., Vikhlinin A., Meshscheryakov A., 2014, preprint, (arXiv:1401.7329)
- Leitherer et al. (1999) Leitherer C., et al., 1999, ApJS, 123, 3
- Martig et al. (2009) Martig M., Bournaud F., Teyssier R., Dekel A., 2009, ApJ, 707, 250
- Martig et al. (2013) Martig M., et al., 2013, MNRAS, 432, 1914
- Martin et al. (2007) Martin D. C., et al., 2007, ApJS, 173, 342
- Mayer et al. (2008) Mayer L., Governato F., Kaufmann T., 2008, Advanced Science Letters, 1, 7
- Mendez et al. (2011) Mendez A. J., Coil A. L., Lotz J., Salim S., Moustakas J., Simard L., 2011, ApJ, 736, 110
- Moster et al. (2013) Moster B. P., Naab T., White S. D. M., 2013, MNRAS, 428, 3121
- Murray et al. (2005) Murray N., Quataert E., Thompson T. A., 2005, ApJ, 618, 569
- Nandra et al. (2007) Nandra K., et al., 2007, ApJ, 660, L11
- Nipoti et al. (2009) Nipoti C., Treu T., Auger M. W., Bolton A. S., 2009, ApJ, 706, L86
- Peng et al. (2010) Peng Y.-j., et al., 2010, ApJ, 721, 193
- Penzo et al. (2014) Penzo C., Macciò A. V., Casarini L., Stinson G. S., Wadsley J., 2014, MNRAS, 442, 176
- Pfrommer et al. (2016) Pfrommer C., Pakmor R., Schaal K., Simpson C. M., Springel V., 2016, preprint, (arXiv:1604.07399)
- Pontzen et al. (2013) Pontzen A., Roškar R., Stinson G., Woods R., 2013, pynbody: N-Body/SPH analysis for python, Astrophysics Source Code Library (ascl:1305.002)
- Rodriguez-Gomez et al. (2016) Rodriguez-Gomez V., et al., 2016, MNRAS, 458, 2371
- Salim (2014) Salim S., 2014, Serbian Astronomical Journal, 189, 1
- Salim et al. (2007) Salim S., et al., 2007, ApJS, 173, 267
- Schawinski et al. (2007) Schawinski K., Thomas D., Sarzi M., Maraston C., Kaviraj S., Joo S.-J., Yi S. K., Silk J., 2007, MNRAS, 382, 1415
- Schaye et al. (2015) Schaye J., et al., 2015, MNRAS, 446, 521
- Schiminovich et al. (2007) Schiminovich D., et al., 2007, ApJS, 173, 315
- Shen et al. (2010) Shen S., Wadsley J., Stinson G., 2010, MNRAS, 407, 1581
- Sijacki et al. (2007) Sijacki D., Springel V., Di Matteo T., Hernquist L., 2007, MNRAS, 380, 877
- Silverman et al. (2008) Silverman J. D., et al., 2008, ApJ, 675, 1025
- Smethurst et al. (2015) Smethurst R. J., et al., 2015, MNRAS, 450, 435
- Somerville et al. (2008) Somerville R. S., Hopkins P. F., Cox T. J., Robertson B. E., Hernquist L., 2008, MNRAS, 391, 481
- Stinson et al. (2006) Stinson G., Seth A., Katz N., Wadsley J., Governato F., Quinn T., 2006, MNRAS, 373, 1074
- Stinson et al. (2013) Stinson G. S., Brook C., Macciò A. V., Wadsley J., Quinn T. R., Couchman H. M. P., 2013, MNRAS, 428, 129
- Strateva et al. (2001) Strateva I., et al., 2001, AJ, 122, 1861
- Takamiya et al. (1995) Takamiya M., Kron R. G., Kron G. E., 1995, AJ, 110, 1083
- Trayford et al. (2016) Trayford J. W., Theuns T., Bower R. G., Crain R. A., Lagos C. d. P., Schaller M., Schaye J., 2016, MNRAS, 460, 3925
- Vogelsberger et al. (2014) Vogelsberger M., et al., 2014, MNRAS, 444, 1518
- Wadsley et al. (2004) Wadsley J. W., Stadel J., Quinn T., 2004, New Astron., 9, 137
- Wadsley et al. (2008) Wadsley J. W., Veeravalli G., Couchman H. M. P., 2008, MNRAS, 387, 427
- Wang et al. (2015) Wang L., Dutton A. A., Stinson G. S., Macciò A. V., Penzo C., Kang X., Keller B. W., Wadsley J., 2015, preprint, (arXiv:1503.04818)
- Wyder et al. (2007) Wyder T. K., et al., 2007, ApJS, 173, 293
- Yesuf et al. (2014) Yesuf H. M., Faber S. M., Trump J. R., Koo D. C., Fang J. J., Liu F. S., Wild V., Hayward C. C., 2014, ApJ, 792, 84