A luminous and isolated gamma-ray flare from the blazar B2 1215+30
Abstract
B2 1215+30 is a BL Lac-type blazar that was first detected at TeV energies by the MAGIC atmospheric Cherenkov telescopes, and subsequently confirmed by the VERITAS observatory with data collected between 2009 and 2012. In 2014 February 08, VERITAS detected a large-amplitude flare from B2 1215+30 during routine monitoring observations of the blazar 1ES 1218+304, located in the same field of view. The TeV flux reached 2.4 times the Crab Nebula flux with a variability timescale of h. Multiwavelength observations with Fermi-LAT, Swift, and the Tuorla observatory revealed a correlated high GeV flux state and no significant optical counterpart to the flare, with a spectral energy distribution where the gamma-ray luminosity exceeds the synchrotron luminosity. When interpreted in the framework of a one-zone leptonic model, the observed emission implies a high degree of beaming, with Doppler factor , and an electron population with spectral index .
1 Introduction
Extreme flux variability is one of the defining properties of the blazar class of active galactic nuclei, appearing at all wavelengths over a wide range of timescales. Flares with amplitudes up to hundred times the quiescent flux and variability timescales as short as 3 minutes have been observed at TeV energies (; see, e.g., Aharonian et al., 2007). To date, six flaring BL Lac-type blazars have been detected to exceed the flux of the Crab Nebula ( cm-2 s-1 at , Hillas et al., 1998) at TeV energies. The large signal statistics obtained during bright flares enable flux-variability studies on minute timescales, resulting in tighter constraints on the size and location of the gamma-ray emitting region (see, e.g., Begelman et al., 2008) and probing the particle acceleration and cooling mechanisms in blazar jets (see, e.g., Bykov et al., 2012).
| Instrument | Energy range | Dates | Live time | Significance | Flux [cm-2 s-1] |
| VERITAS | TeV | 2013 Jan 06 – 2013 May 12 (MJD 56298–56424) | 631 min | ||
| 2013 Feb 07 (MJD 56330) | 25 min | ||||
| 2014 Jan 29 – 2014 May 25 (MJD 56686–56802) | 748 min | ||||
| 2014 Feb 08 (MJD 56696) | 45 min | ||||
| 2014 Feb 09 (MJD 56697) | 25 min | ||||
| Fermi-LAT | 0.1–500 GeV | 2013 Jan 06 – 2013 May 12 (MJD 56298–56424) | |||
| 2014 Jan 01 – 2014 May 25 (MJD 56658–56802) | |||||
| 2014 Feb 05 – 2014 Feb 09 (MJD 56693–56696) |
This paper describes a large-amplitude gamma-ray flare from the blazar B2 1215+30 detected on UT date 2014 Feb 08, and compares its broadband properties to long-term observations of the source with VERITAS (TeV energies), Fermi-LAT (GeV energies; ), and the Tuorla optical observatory. B2 1215+30 (R.A. = , decl. = , J2000), also known as ON 325 or 1ES 1215+303, was first detected at TeV energies by MAGIC (Aleksić et al., 2012). At GeV energies it is associated with 3FGL J1217.8+3007 (Acero et al., 2015). There is some uncertainty in the distance to this source, with values of (Akiyama et al., 2003) and (Lanzetta et al., 1993) being quoted for its spectroscopic redshift. Based on the location of its synchrotron peak, B2 1215+30 has been either classified as an intermediate (IBL, Nieppola et al., 2006) or high-frequency peaked BL Lac (HBL, Ackermann et al., 2015).
Throughout this paper we assume a Friedmann universe with km s-1 Mpc-1, and . All distance-dependent quantities are calculated assuming a redshift ( Mpc) for B2 1215+30. Measurement uncertainties are statistical only unless indicated otherwise.
2 VERITAS Observations
VERITAS (Very Energetic Radiation Imaging Telescope Array System) is an array of four imaging atmospheric Cherenkov telescopes located at the Fred Lawrence Whipple Observatory in southern Arizona, USA. VERITAS operates by recording Cherenkov light from particle showers initiated by gamma rays in the upper atmosphere and is sensitive to gamma-ray energies from about 85 GeV to more than 30 TeV (Park, 2015).
Table LABEL:obs summarizes the VERITAS observations and results on B2 1215+30. Observations were made in “wobble” pointing mode (Fomin, et al., 1994) considering the presence of another TeV source in the field of view (1ES 1218+304, offset from B2 1215+30) as described in Aliu et al. (2013). Data were processed using standard VERITAS analysis pipelines (Acciari et al., 2009; Archambault et al., 2013). The energy threshold of the analysis is 200 GeV, with a systematic uncertainty of 20% on the energy estimation.
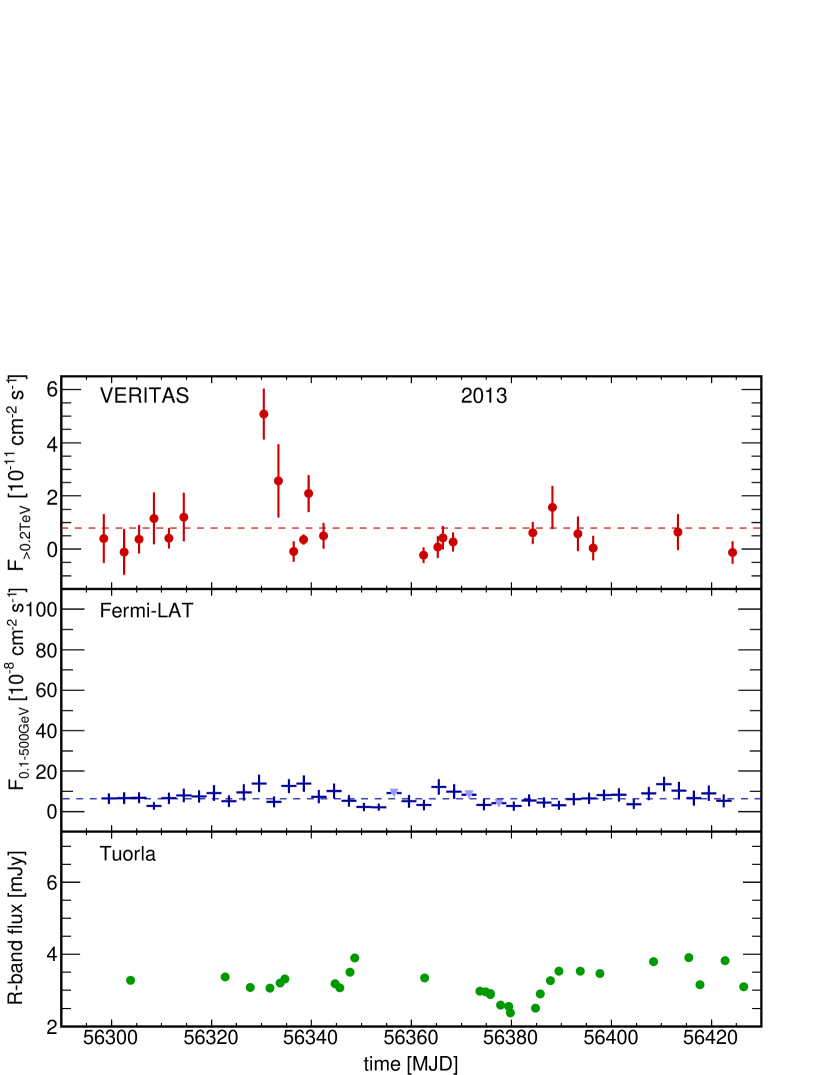
A TeV flare from B2 1215+30 was detected in 2013 Feb 07 (MJD 56330, Figure 1) with flux , or 0.24 Crab. The measured gamma-ray spectrum is compatible with a power-law with photon index , in line with reported in Aliu et al. (2013) and from Aleksić et al. (2012). A fit of the decaying phase of the flare (MJD 56330-56639) to a function results in an upper limit on the flux halving time of h at a 90% confidence level (c.l.).
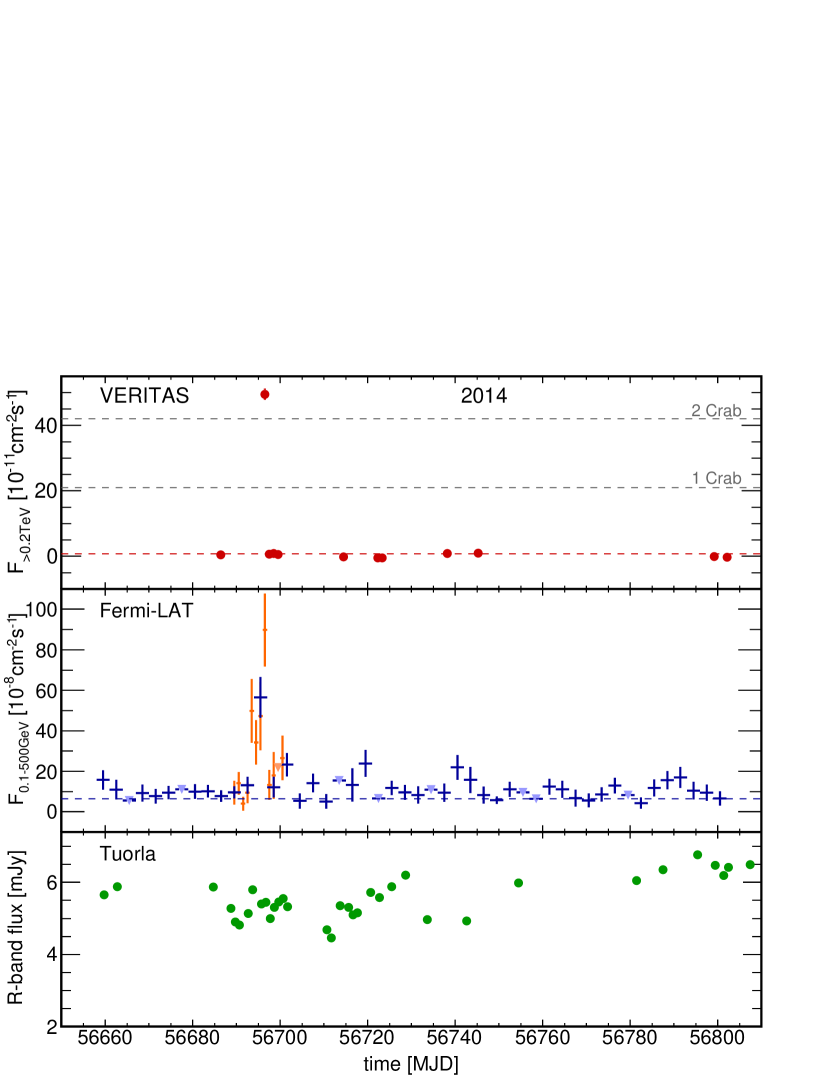
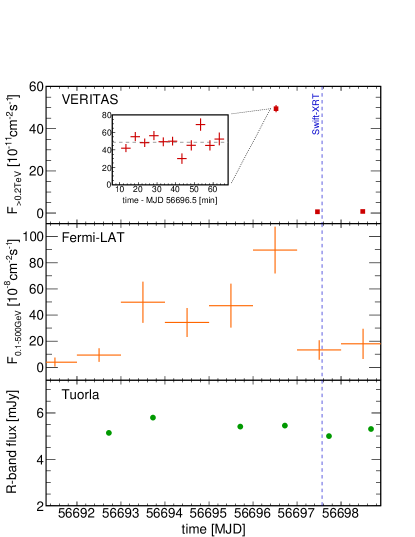
A brighter subsequent flare from B2 1215+30 was observed on 2014 Feb 08 (MJD 56696, Figure 1) with flux , or 2.4 Crab. The reconstructed energy spectrum is compatible with a power-law with photon index between 0.2 and 2 TeV (Figure 2). The observations targeted 1ES 1218+304 and had a mean zenith distance of , accumulating 45 min of live-time exposure. On that night, a high-cloud layer at an altitude of km a.s.l. was measured by an onsite Vaisala CL51 ceilometer. On average, 30% of the Cherenkov light output in particle showers initiated by 200 GeV gamma rays is produced above 11.2 km (see, e.g., Rossi & Greisen, 1941). This fraction decreases with increasing gamma-ray energy (see, e.g., Weekes, 2003). If all Cherenkov light emitted above the cloud layer is lost, VERITAS would underestimate the energy of incoming gamma rays by , which added to the 20% systematic uncertainty on the energy estimation results in the increased systematic error on the gamma-ray flux and spectral index measured in 2014 Feb 08. The large signal statistics during the flare allow flux measurements in 5-minute time bins (Figure 3). No significant flux variability was detected during the 45 min exposure, with the light curve deviating from a constant flux hypothesis at a level of 2.8 standard deviations. Observations on the next night (2014 Feb 09) did not show an elevated flux from B2 1215+30 (Table LABEL:obs), implying a 90% c.l. limit on the flux halving time of h.
3 Fermi-LAT Observations
The Large Area Telescope (LAT) is a pair-conversion gamma-ray telescope on board the Fermi satellite covering energies from about 20 MeV to more than 500 GeV (Atwood et al., 2009). Table LABEL:obs summarizes the Fermi-LAT observations and results on B2 1215+30. Data were analyzed using the unbinned likelihood analysis in LAT ScienceTools (v10r0p5) with P8R2_SOURCE_V6 instrument response functions, selecting photons with energy in a circular region of radius centered on the position of B2 1215+30. The energy spectrum of B2 1215+30 was modeled with a power law. Further analysis details and standard quality cuts followed Acero et al. (2015). Light curves were derived by dividing the data in bins of one and three days duration.
A clear flux peak is seen coinciding with the VERITAS-detected flare of 2014 Feb 08 (Figure 1), followed by a rapid decay that constrains the flux halving time to h at 90% c.l. (Figure 3). The GeV spectrum shows some evidence of hardening (), going from an averaged during the 2014 campaign to in the four days of highest GeV flux (MJD 56693-56696). In 2013, the LAT light curve shows no significant flux variability (Figure 1). However, the same TeV to GeV flare amplitude ratio seen in 2014 can be accomodated within the error bars of the 2013 LAT light curve.
4 Swift observations
An observation by the Swift Observatory (ObsId 00031906012) was carried out one day after the VERITAS-detected flare (Figure 3) with an exposure of 1.97 ks. X-ray Telescope (XRT, keV, Burrows et al., 2005) data were obtained in photon-counting mode and processed with the xrtpipeline tool (HEASOFT 6.16). The exposure shows a stable source-count rate of , suggesting negligible pile-up effects.
The spectrum was rebinned to have at least 20 counts per bin, ignoring channels with energy below 0.3 keV, and fit using PyXspec v1.0.4 (Arnaud, 1996). An absorbed power law with column density (Kalberla et al., 2005) and photon index gives a good description of the spectral data (). The unabsorbed flux is .
To analyze the Swift-UVOT data ( eV), source counts were extracted from an aperture of 5.0 arcsec radius around the source. Background counts were taken from four neighboring regions with equal radius. Magnitudes were computed using the uvotsource tool (HEASOFT v6.16), corrected for extinction according to Roming et al. (2009) using from Schlafly & Finkbeiner (2011), and converted to fluxes following Poole et al. (2008).
5 Optical observations
Optical R-band data were obtained as part of the Tuorla blazar monitoring program (http://users.utu.fi/kani/1m, Takalo et al., 2008). Observations were taken using a 35 cm Celestron telescope attached to the KVA 60 cm telescope (La Palma, Canary Islands, Spain) and the 50 cm Searchlight Observatory Network telescope (San Pedro de Atacama, Chile). Data were analyzed using a semi-automatic pipeline developed at the Tuorla Observatory. The host galaxy flux of 1.0 mJy (Nilsson et al., 2007) was subtracted from the observed fluxes, and a correction for Galactic extinction was applied using values from Schlafly & Finkbeiner (2011). The yearly-averaged optical flux of mJy in year 2013 is similar to historical values dating back to 2003.111http://users.utu.fi/kani/1m/ON_325_jy.html In 2014, B2 1215+30 appeared to be in a long-lasting high optical state, with average flux of mJy. No significant enhancement of the optical emission was detected in coincidence with the two gamma-ray flares reported in Sections 2 and 3.
6 Discussion
With the data presented here and in Aliu et al. (2013), VERITAS has published TeV observations of B2 1215+30 spanning over 50 nights between 2008 and 2014, finding no significant deviations from yearly-averaged fluxes other than the flares on 2013 Feb 07 and 2014 Feb 08 reported in this paper. These two TeV flares had amplitudes of and times the average quiescent flux from B2 1215+30, with associated flux halving times of and hours, respectively. Such large-amplitude, short-lived, isolated flares are not common in TeV-emitting blazars. Fast variability is typically measured during longer high-flux states in HBLs (see, e.g., Krawczynski et al., 2004; Albert et al., 2007), while some quasars and IBLs show short periods of TeV emission in epochs where multiple GeV flares are seen (Aleksić et al., 2011; Arlen et al., 2013).
In the following we summarize the main observational properties of the brightest flare of 2014 Feb 08 and interpret them in the framework of an homogeneous one-zone leptonic emission scenario:
(i) The measured flux above 0.2 TeV was . This corresponds to an isotropic luminosity erg s-1. To date, only four other blazars have episodically been observed to emit TeV radiation with luminosity exceeding erg s-1. For comparison, the historical TeV blazar Mrk 421 would have to exhibit a 35 Crab flare to reach the luminosity of the B2 1215+30 outburst reported here.
(ii) A non-detection by VERITAS 24 h after the flare indicates a flux halving time h at TeV energies. Causality implies that the observed variability timescale is related to the size () and Doppler factor () of the gamma-ray emitting region by
| (1) |
(iii) The TeV flare was accompanied by a significant GeV flare measured by Fermi-LAT that extended over four days and displayed some evidence for spectral hardening, with .
(iv) Optical observations did not show enhanced emission in coincidence with the GeV and TeV flare, although the overall optical flux in 2014 was approximately two times brighter than in previous years.
(v) Non-detections by Swift-BAT222 http://swift.gsfc.nasa.gov/results/transients/weak/QSOB1215p303/ (15-50 keV) and MAXI333 http://maxi.riken.jp/mxondem/ (4-10 keV) on the day of the TeV flare (MJD 56696) can be interpreted as a limit on the hard X-ray flux of the order of erg cm-2 s-1 (Krimm et al., 2013; Hiroi et al., 2013). This effectively limits the peak synchrotron luminosity to
| (2) |
(vi) No change in the 15 GHz radio brightness of B2 1215+30 was seen in the OVRO light curves in coincidence or after the TeV flare.444 http://www.astro.caltech.edu/ovroblazars/data/data.php?page=data_return&source=J1217+3007 B2 1215+30 is in fact in the lower third of the OVRO sample in terms of radio flux variability (Richards et al., 2014).
(vii) Swift-XRT data taken 24 h after the flare showed an X-ray flux comparable with historical average values (Aleksić et al., 2012; Aliu et al., 2013), although the TeV flux was back to a quiescent level at that point.
A lower limit on can be derived by estimating the required Doppler boosting for gamma rays with energy to escape pair production on a co-spatial synchrotron photon field with density , where . For photons with TeV measured by VERITAS the mean interaction energy for pair production is eV. Using the expression for optical depth from Dondi & Ghisellini (1995), imposing , and estimating from the Swift-XRT and UVOT measurements described in Section 4 results in
| (3) |
where is the Thomson cross section and is the spectral index of the synchrotron emission around . We note that the Swift observations were made 24 h after the TeV flare (Figure 3). The lower limit on is still valid, however, as long as the density of synchrotron photons was not lower during the flare than that measured on the subsequent day.
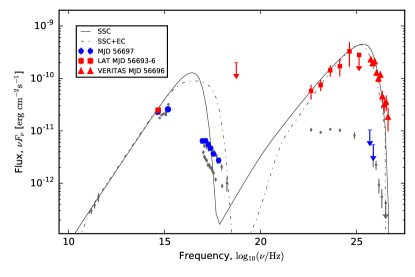
The spectral energy distribution (SED) of B2 1215+30 during the flare is shown in Figure 2. TeV emission can be explained by a fresh injection of relativistic electrons, where the injected perturbation propagates down in energy as the plasma cools, explaining the smaller amplitude of the GeV flare and the lack of optical variability (see, e.g., Giebels et al., 2007). Taking the radio spectrum from Antón et al. (2004) and the R-band flux from the Tuorla observatory we derive a radio-to-optical spectral index . If the cooling break555corresponding to emitting electron energies at which the radiative cooling and escape timescales are equal. in the synchrotron SED happens beyond optical frequencies, as assumed in Aleksić et al. (2012) and Aliu et al. (2013) and typically observed in BL Lac objects (Tavecchio et al., 2010), determines the power-law spectral index () of the emitting electrons (see, e.g., Rybicki & Lightman, 1979):
| (4) |
Beyond the cooling break, the electron distribution has to extend to Lorentz factors () of the order
| (5) |
to produce the TeV photons detected by VERITAS. In the simplest leptonic emission scenario, the high-energy component of the SED is produced via the synchrotron self-Compton mechanism (SSC; Maraschi et al., 1992). In an SSC scenario, the ratio between the synchrotron and inverse-Compton luminosities can be used to estimate the magnetic field. Following Ghisellini et al. (1996) and using equations (2) and (3) to constrain and , we derive
| (6) | |||||
The scarcity of multiwavelength coverage simultaneous with the TeV flare, specially of the synchrotron component, leaves numerical modeling of the SED underconstrained. However, even if modeling solutions are not unique, they can be used to understand the level of kinetic and magnetic jet power required under different scenarios. We test the feasibility of a SSC scenario by using the stationary leptonic model of Böttcher et al. (2013), fixing the jet viewing angle to for simplicity. Models666E.g., , , , , , , , see Böttcher et al. (2013) for parameter definitions not included in the text. within the parameter constraints from equations (1–6) reproduce the measured gamma-ray luminosity without overproducing the optical flux measured by the Tuorla observatory, and keeping as constrained by the Swift-BAT non-detection (Figure 2). These solutions would indicate an emitting region where the kinetic power of relativistic electrons () exceeds the power carried by the magnetic field () by a factor of . This is typically the case in SSC modelling of TeV blazars (see, e.g., Aliu et al., 2013). Higher values of would imply even higher ratios. Given the observational uncertainty in the shape of the synchrotron emission, we also explore a wider range of electron spectral indices than indicated in equation (4), finding that is required to reproduce the hard GeV spectrum measured by Fermi-LAT.
The lack of observable thermal emission from the accretion disk and associated emission lines in B2 1215+30 supports an SSC emission scenario. However, the observed Compton dominance () typically points to external Compton models (EC; Dermer & Schlickeiser, 1993) to explain the high-energy emission. Assuming an EC scenario, constraints on and the distance of the energy dissipation region from the black hole () can be derived assuming reasonable limits on the jet collimation and luminosity of upscattered synchrotron photons. Following Nalewajko et al. (2014) results in:
| (7) | |||||
| (8) |
where the accretion disk luminosity () is assumed to be erg s-1 (Ghisellini et al., 2010) and describes the composition of the external radiation fields. Equations (7) and (8) constrain the parameter space with a marginal solution at and cm that would place the emitting blob beyond the broad-line region. A numerical EC model777, , , , , , , , , see Böttcher et al. (2013) for parameter definitions not included in the text. (Böttcher et al., 2013) with an external photon field described as blackbody emission with K typical of hot dust can reproduce the SED with (Figure 2).
Particle acceleration in relativistic shocks or through magnetic reconnection can explain the short flux-variability timescale observed in B2 1215+30 (Sironi & Spitkovsky, 2009; Giannios, 2013). The hard electron spectrum () derived from the multiwavelength SED is usually obtained in semi-analytical calculations of relativistic shock acceleration (Achterberg et al., 2001), but more recent fully kinetic particle-in-cell simulations derive significantly softer spectra (Sironi & Spitkovsky, 2009). Magnetic reconnection events can produce harder electron spectra than those originating from shock acceleration (Sironi & Spitkovsky, 2014), easily reproducing derived from the synchrotron spectrum of B2 1215+30. Recently, Sironi et al. (2015) have suggested that magnetic reconnection is a more viable scenario for particle acceleration in relativistic jets, disfavoring shock models for their inability to simultaneously dissipate energy and accelerate particles beyond thermal energies. Efficient magnetic reconnection requires an emitting region in rough equipartition between particles and magnetic field . The EC scenario presented above does fulfill this condition, while our attempts to describe the observed SED with SSC models persistently resulted in particle-dominated emitting regions where the magnetization of the plasma would be too low for efficient magnetic reconnection to take place.
VERITAS will continue to monitor B2 1215+30. Events like the extreme flare of 2014 Feb 08 should be within the sensitivity reach of HAWC (Lauer et al., 2015). Future observations will show how frequent these extreme gamma-ray flares are and whether or not they are present in the majority of TeV blazars.
References
- Acciari et al. (2009) Acciari, V. A., Aliu, E., Aune, T., et al. 2009, ApJ, 707, 612
- Acero et al. (2015) Acero, F., Ackermann, M., Ajello, M., et al. 2015, ApJS, 218, 23
- Achterberg et al. (2001) Achterberg, A., Gallant, Y. A., Kirk, J. G., & Guthmann, A. W. 2001, MNRAS, 328, 393
- Ackermann et al. (2015) Ackermann, M., Ajello, M., Atwood, W. B., et al. 2015, ApJ, 810, 14
- Aharonian et al. (2007) Aharonian, F. A., et al. 2007, ApJL, 664, 71
- Akiyama et al. (2003) Akiyama, M., Ueda, Y., Ohta, K., Takahashi, T., & Yamada, T., 2003, ApJS, 148, 275
- Albert et al. (2007) Albert, J., Aliu, E., Anderhub, H., et al. 2007, ApJ, 669, 862
- Aleksić et al. (2011) Aleksić, J., Antonelli, L. A., Antoranz, P., et al. 2011, ApJ, 730, L8
- Aleksić et al. (2012) Aleksić, J., Alvarez, E. A., Antonelli, L. A., et al. 2012, A&A, 544, A142
- Aliu et al. (2013) Aliu, E., Archambault, S., Arlen, T., et al. 2013, ApJ, 779, 92
- Antón et al. (2004) Antón, S., Browne, I. W. A., Marchã, M. J. M., Bondi, M., & Polatidis, A. 2004, MNRAS, 352, 673
- Archambault et al. (2013) Archambault, S., Arlen, T., Aune, T., et al. 2013, ApJ, 776, 69
- Arlen et al. (2013) Arlen, T., Aune, T., Beilicke, M., et al. 2013, ApJ, 762, 92
- Arnaud (1996) Arnaud, K. A. 1996, Astronomical Data Analysis Software and Systems V, 101, 17
- Atwood et al. (2009) Atwood, W. B., Abdo, A. A., Ackermann, M., et al. 2009, ApJ, 697, 1071
- Begelman et al. (2008) Begelman, M. C., Fabian, A. C., & Rees, M. J. 2008, MNRAS, 384, L19
- Böttcher et al. (2013) Böttcher, M., Reimer, A., Sweeney, K., & Prakash, A. 2013, ApJ, 768, 54
- Burrows et al. (2005) Burrows, D. N., Hill, J. E., Nousek, J. A., et al. 2005, Space Sci. Rev., 120, 165
- Bykov et al. (2012) Bykov, A., Gehrels, N., Krawczynski, H., et al. 2012, Space Sci. Rev., 173, 309
- Dermer & Schlickeiser (1993) Dermer, C. D., & Schlickeiser, R. 1993, ApJ, 416, 458
- Dondi & Ghisellini (1995) Dondi, L., & Ghisellini, G., 1995, MNRAS 273, 583
- Finke et al. (2010) Finke, J. D., Razzaque, S., & Dermer, C. D. 2010, ApJ, 712, 238
- Fomin, et al. (1994) Fomin, V. P., Stepanian, A. A., Lamb, R. C., et al. 1994, Astroparticle Physics, 2, 137
- Ghisellini et al. (1996) Ghisellini, G., Maraschi, L., & Dondi, L. 1996, A&AS, 120, 503
- Ghisellini et al. (2010) Ghisellini, G., Tavecchio, F., Foschini, L., et al. 2010, MNRAS, 402, 497
- Giannios (2013) Giannios, D. 2013, MNRAS, 431, 355
- Giebels et al. (2007) Giebels, B., Dubus, G., & Khélifi, B. 2007, A&A, 462, 29
- Hillas et al. (1998) Hillas, A. M., Akerlof, C. W., Biller, S. D., et al. 1998, ApJ, 503, 744
- Hiroi et al. (2013) Hiroi, K., Ueda, Y., Hayashida, M., et al. 2013, ApJS, 207, 36
- Kalberla et al. (2005) Kalberla, P. M. W., Burton, W. B., Hartmann, D., et al. 2005, A&A, 440, 775
- Krawczynski et al. (2004) Krawczynski, H., Hughes, S. B., Horan, D., et al. 2004, ApJ, 601, 151
- Krimm et al. (2013) Krimm, H. A., Holland, S. T., Corbet, R. H. D., et al. 2013, ApJS, 209, 14
- Lanzetta et al. (1993) Lanzetta, K. M., Turnshek, D. A. & Sandoval, J., 1993, ApJS, 84, 109
- Lauer et al. (2015) Lauer, R. J., Younk, P. W., & for the HAWC collaboration 2015, arXiv:1508.04479
- Maraschi et al. (1992) Maraschi, L., Ghisellini, G., & Celotti, A. 1992, ApJ, 397, L5
- Nalewajko et al. (2014) Nalewajko, K., Begelman, M. C., & Sikora, M. 2014, ApJ, 789, 161
- Nilsson et al. (2007) Nilsson, K., Pasanen, M., Takalo, L. O., et al. 2007, A&A, 475, 199
- Nieppola et al. (2006) Nieppola, E., Tornikoski, M. & Valtaoja, E., 2006, A&A, 445, 441
- Park (2015) Park, N., 2015, International Cosmic Ray Conference, PoS (ICRC 2015) 771, arXiv:1508.07070
- Poole et al. (2008) Poole, T. S., Breeveld, A. A., Page, M. J., et al. 2008, MNRAS, 383, 627
- Richards et al. (2014) Richards, J. L., Hovatta, T., Max-Moerbeck, W., et al. 2014, MNRAS, 438, 3058
- Roming et al. (2009) Roming, P. W. A., Koch, T. S., Oates, S. R., et al. 2009, ApJ, 690, 163
- Rossi & Greisen (1941) Rossi, B., & Greisen, K. 1941, Reviews of Modern Physics, 13, 240
- Rybicki & Lightman (1979) Rybicki, G. B., & Lightman, A. P. 1979, New York, Wiley-Interscience, 1979. 393 p.,
- Schlafly & Finkbeiner (2011) Schlafly, E. F., & Finkbeiner, D. P. 2011, ApJ, 737, 103
- Sironi et al. (2015) Sironi, L., Petropoulou, M., & Giannios, D. 2015, MNRAS, 450, 183
- Sironi & Spitkovsky (2009) Sironi, L., & Spitkovsky, A. 2009, ApJ, 698, 1523
- Sironi & Spitkovsky (2014) Sironi, L., & Spitkovsky, A. 2014, ApJ, 783, L21
- Takalo et al. (2008) Takalo, L. O., Nilsson, K., Lindfors, E., et al. 2008, American Institute of Physics Conference Series, 1085, 705
- Tavecchio et al. (2010) Tavecchio, F., Ghisellini, G., Ghirlanda, G., Foschini, L., & Maraschi, L. 2010, MNRAS, 401, 1570
- Weekes (2003) Weekes, T. 2003, Wiley Praxis Series in Astronomy and Astrophysics, 11,