EBL Inhomogeneity and Hard-Spectrum Gamma-Ray Sources
Abstract
The unexpectedly hard very-high-energy (VHE; GeV) -ray spectra of a few distant blazars have been interpreted as evidence for a reduction of the opacity of the Universe due to the interaction of VHE -rays with the extragalactic background light (EBL) compared to the expectation from our current knowledge of the density and cosmological evolution of the EBL. One of the suggested solutions to this problem consisted of the inhomogeneity of the EBL. In this paper, we study the effects of such inhomogeneities on the energy density of the EBL (which then also becomes anisotropic) and the resulting opacity. Specifically, we investigate the effects of cosmic voids along the line of sight to a distant blazar. We find that the effect of such voids on the opacity, for any realistic void size, is only of the order of % and much smaller than expected from a simple linear scaling of the opacity with the line-of-sight galaxy under-density due to a cosmic void.
1 Introduction
Gamma rays from astronomical objects at cosmological distances with energies greater than the threshold energy for electron-positron pair production can be annihilated due to absorption by low-energy extragalactic photons. The importance of this process for high-energy astrophysics was first pointed out by Nikishov (1962). In particular, very-high-energy (VHE; GeV) -ray emission from blazars is subject to absorption by the extragalactic background light (EBL), resulting in a high-energy cut-off in the -ray spectra of blazars (e.g., Stecker et al., 1992). The probability of absorption depends on the photon energy and the distance (redshift) of the source. Studies of intergalactic absorption signatures have attracted further interest in astrophysics and cosmology due to their potential use to probe the cluster environments of blazars (Sushch & Böttcher, 2015) and to estimate cosmological parameters (Biteau & Williams, 2015). However, bright foreground emissions prevent an accurate direct measurement of the EBL (Hauser & Dwek, 2001). Studies of the EBL therefore focus on the predicted absorption imprints and employ a variety of theoretical and empirical methods (e.g., Stecker, 1969; Stecker et al., 1992; Aharonian et al., 2006; Franceschini et al., 2008; Razzaque et al., 2009; Finke et al., 2010; Dominguez et al., 2011a; Gilmore et al., 2012). All the cited works agree that the universe should be opaque (i.e., ) to VHE -rays from extragalactic sources at high redshift ().
Observations of distant () -ray blazars have been interpreted by some authors
(e.g., MAGIC Collaboration, 2008; Archambault et al., 2014) as evidence that the universe may be more transparent to very high
energy -rays than expected based on all existing EBL models. Furthermore, several studies have
found that, after correction for EBL absorption, the VHE -ray spectra of several blazars appear
to be unexpectedly hard (photon indices ) and/or exhibit marginal hints of
spectral upturns towards the highest energies (e.g., Finke et al., 2010; Furniss et al., 2013). These unexpected VHE
signatures in the spectra of distant blazars — although present only at marginal significance — are
currently the subject of intensive research.
Possible solutions include the
hypothesis that the EBL density is generally lower than expected from current models (Furniss et al., 2013);
the existence of exotic axion like particles (ALPs) into which VHE -rays can oscillate in the
presence of a magnetic field, thus enabling VHE-photons to avoid absorption (Dominguez et al., 2011b);
an additional VHE -ray emission component due to interactions along the line of sight of
extragalactic ultra-high-energy cosmic rays (UHECRs) originating from the blazar (e.g., Essey & Kusenko, 2010);
and EBL inhomogeneities. The idea of EBL inhomogeneities was considered by Furniss et al. (2015), who
found tentative hints for correlations between hard VHE -ray sources and under-dense regions
along the line of sight. They suggested a direct, linear scaling of the EBL opacity with
the line-of-sight galaxy number density. The effect of EBL inhomogeneities
on the opacity was also investigated by Kudoda & Faltenbacher (2016). However, in that work, EBL inhomogeneities
were considered only as a modulation of the redshift dependence of the cosmic star formation rate,
without a detailed consideration of the geometrical effects of large-scale structure of the Universe.
Both Furniss et al. (2015) and Kudoda & Faltenbacher (2016) concluded that the possible reduction of the EBL
opacity due to inhomogeneities is likely negligible.
In this paper, we investigate the effect of cosmological inhomogeneities on the energy density of the EBL and the resulting opacity with a detailed calculation of the inhomogeneous and anisotropic EBL in a realistic geometrical model setup. Specifically, we will consider the effect of cosmic voids along the line of sight to a distant blazar and investigate the resulting inhomogeneous and anisotropic EBL radiation field. In Section 2, we describe the model setup and the method used to evaluate the EBL characteristics and the resulting opacity. The results are presented in Section 3, where we also compare our results to a simple linear scaling of the EBL opacity with the line-of-sight galaxy count density for the specific example of PKS 1424+240. We summarize and discuss our results in Section 4.
2 EBL in the Presence of a Cosmic Void
Our calculations of the inhomogeneous EBL are based on a modified version of the formalism presented in Razzaque et al. (2009), considering only the direct starlight. The effect of re-processing of starlight by dust has been included in Finke et al. (2010) and leads to an additional EBL component in the mid- to far infrared, which is neglected here. Since dust re-processing is a local effect, it will be affected by cosmic inhomogeneities in the same way as the direct starlight contribution considered here.
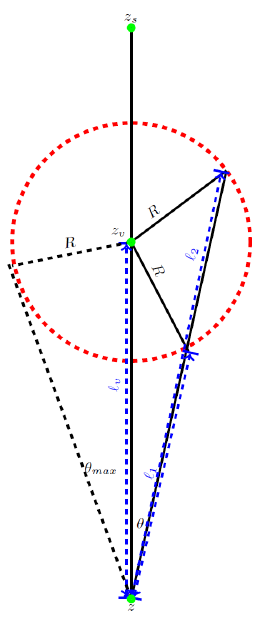
For the purpose of a generic study of the effects of cosmic voids along the line of sight to a blazar, we start out by considering a single spherical cosmic void located with its center at redshift and radius between the observer and a -ray source at redshift . The geometry is illustrated in Figure 1. We calculate the angle- and photon-energy-dependent EBL energy density at each point between the observer and the source by using co-moving cordinates, converting redshifts to distances . The cosmic void is represented by setting the star formation rate to 0 within the volume of the void.
For the evaluation of the differential EBL photon number density spectrum at a given redshift , we modify the expression from Razzaque et al. (2009), based on the direct contribution from stars throughout cosmic history:
| (1) |
where represents the solid angle with respect to the photon propagation direction, and is the step function set to zero within the void, as specified below. is the cosmic star formation rate, is the stellar mass function, is the stellar emissivity function, and is the photon escape probability, for which we use the parameterizations of Razzaque et al. (2009). is evaluated using a concordance cosmology with , and , and we define as the co-ordinate distance between and .
From Figure 1 we can find the distances and where the gamma-ray propagation direction crosses the boundaries of the void, as
| (2) |
where is the cosine of the angle betwen the line of sight and the gamma-ray propagation direction, . The maximum angle at which the gamma-ray travel direction still crosses the boundary at one point, is given by:
| (3) |
and the corresponding distance to the tangential point, , is given by
| (4) |
The void condition can now be written as
for points along the line of sight that are located outside the void, and
for points along the line of sight located inside the void. Note that, although the star formation rate has been set to zero inside the void, the EBL is not zero there because of the contribution from the rest of the Universe outside the void.
To calculate the EBL density in comoving cordinates, the photon energy and volume can be transformed as and respectively. Using equation (1), the EBL energy density can then be written as (Razzaque et al., 2009):
| (5) |
With this expression for the EBL energy density, we can calculate the optical depth due to absorption for a -ray photon from a source at redshift with observed energy as (Gould & Schréder, 1967):
| (6) |
The pair-production cross section can be written as:
| (7) |
where is the classical electron radius and is the electron-positron velocity in the center-of-momentum (c.m.) frame of the interaction, is the c.m. frame electron/positron energy squared, and H is the Heaviside function, if and otherwise, representing the threshold condition that pair production can only occur if .
In the case of a homogeneous and isotropic EBL (with which we will compare our results for the inhomogeneous EBL case), equation (6) can be simplified using the dimensionless function defined by Gould & Schréder (1967):
where and , so that equation (6) reduces to equation (17) in Razzaque et al. (2009):
| (8) |
Knowing the optical depth , we can calculate the attenuation of the intrinsic photon flux as:
| (9) |
where is the observed spectrum.
3 Results
3.1 General Parameter Study: Single Void
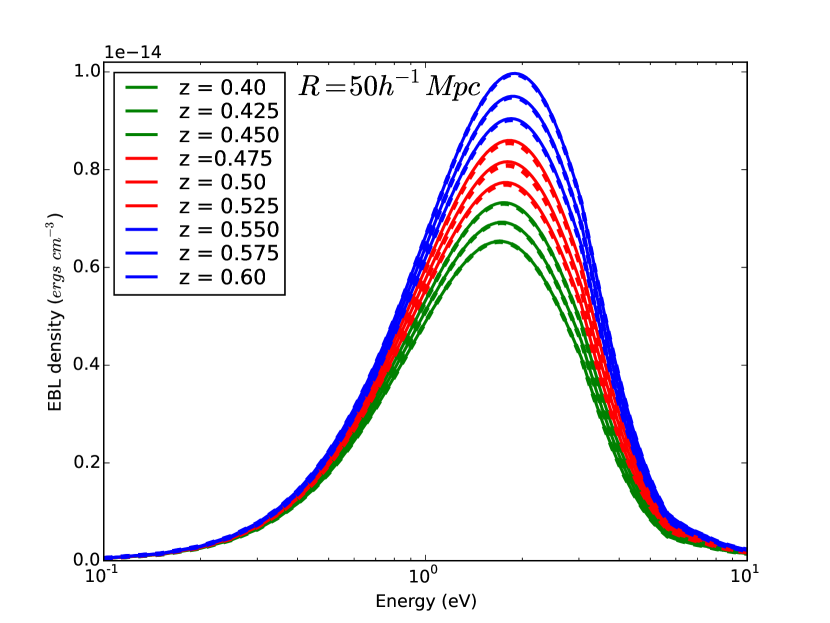
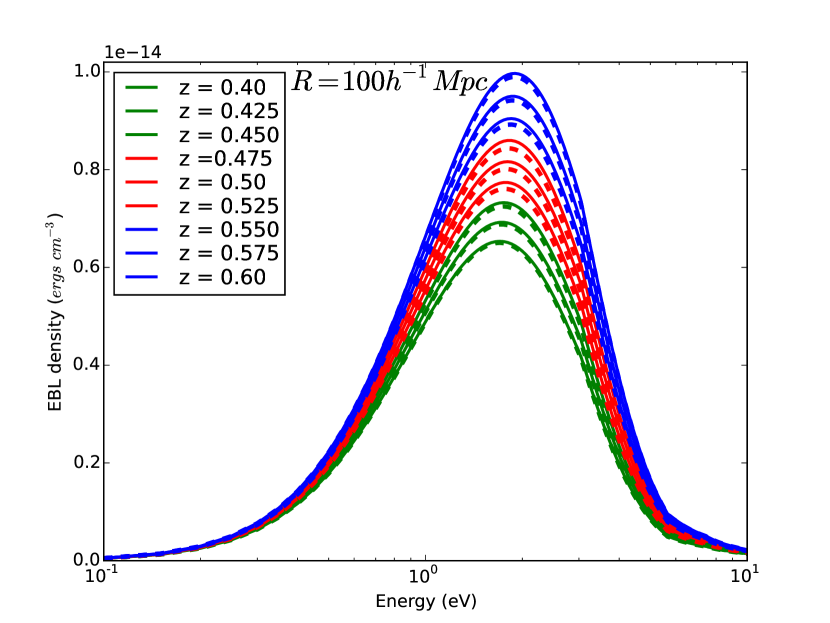
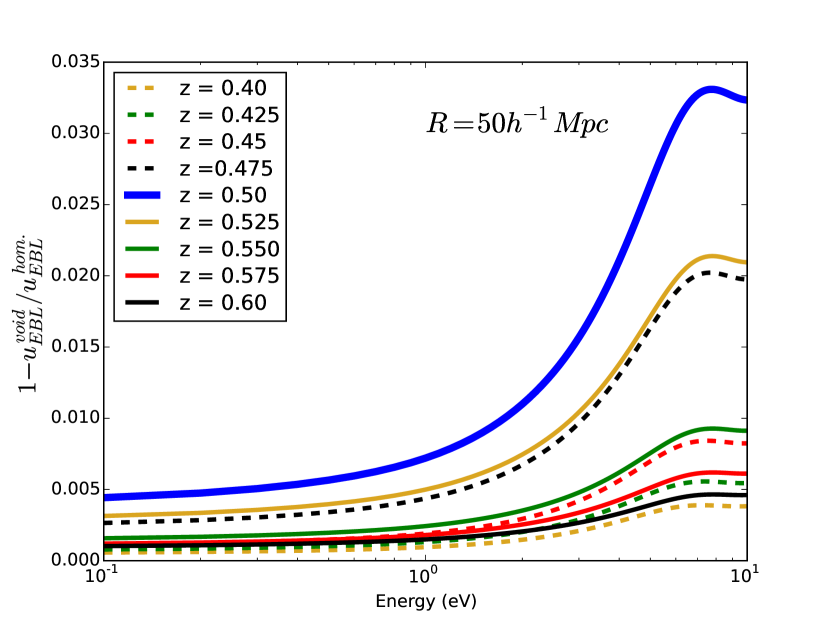
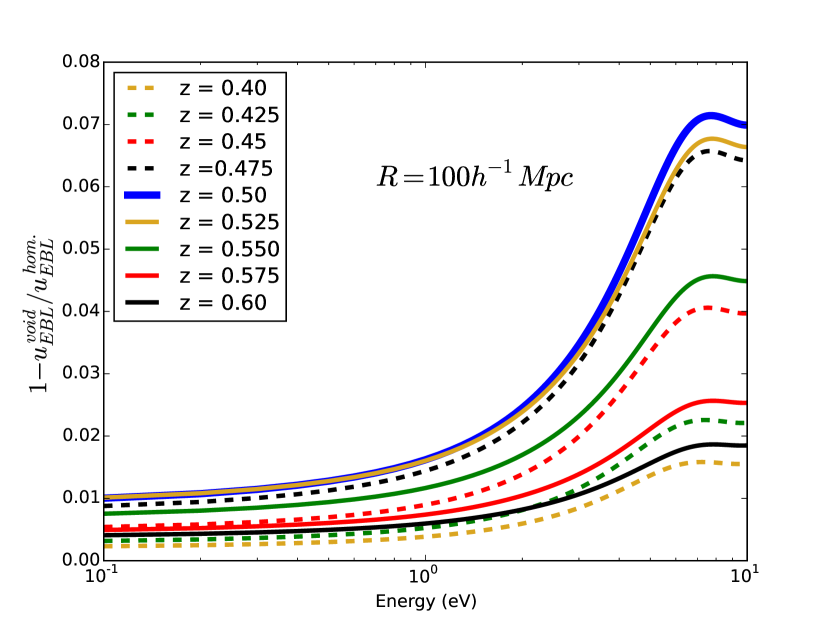
We first investigate the effect of a single cosmic void along the line of sight to a distant -ray source on the resulting angle-averaged EBL energy density. Figure 2 (top panels) compares the EBL energy density spectrum (keeping in mind that only the direct starlight contribution is accounted for) in the case of a void (dashed lines), compared to the homogeneous case (solid lines) for a spherical void of radius Mpc (left panels) and Mpc (right panels), at different points (redshifts, as indicated by the labels) along the line of sight. The center of the void is assumed to be located at a redshift of , considering a source located at redshift . The bottom panels of Figure 2 show the fractional difference between the homogeneous and the inhomogeneous case as a function photon energy for various redshifts along the line of sight, for the same two cases. As expected, the effect of the void is largest right in the center of the void, but even there, it does not exceed a few % (maximum fractional deficit % in the Mpc case). The effect generally increases with photon energy. This is because high-energy photons are produced primarily by high-mass stars and, thus, trace the most recent star-formation history, which, for points within the void, is zero up to the time corresponding to the light travel time to the boundary of the void. As a function of position along the line of sight, the void-induced EBL deficit decreases approximately symmetrically for points in front of and behind the center of the void, with the slight asymmetry being due to the factor in Equation 5.
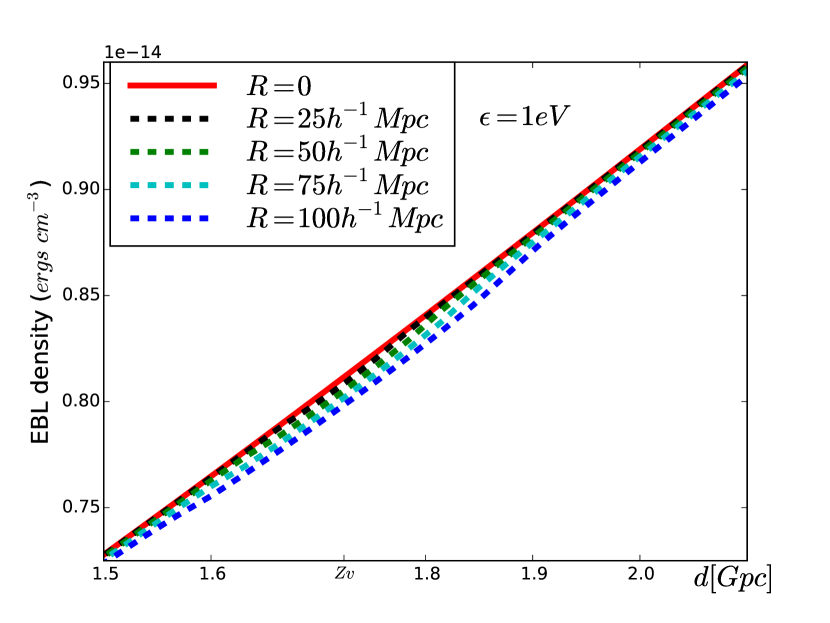
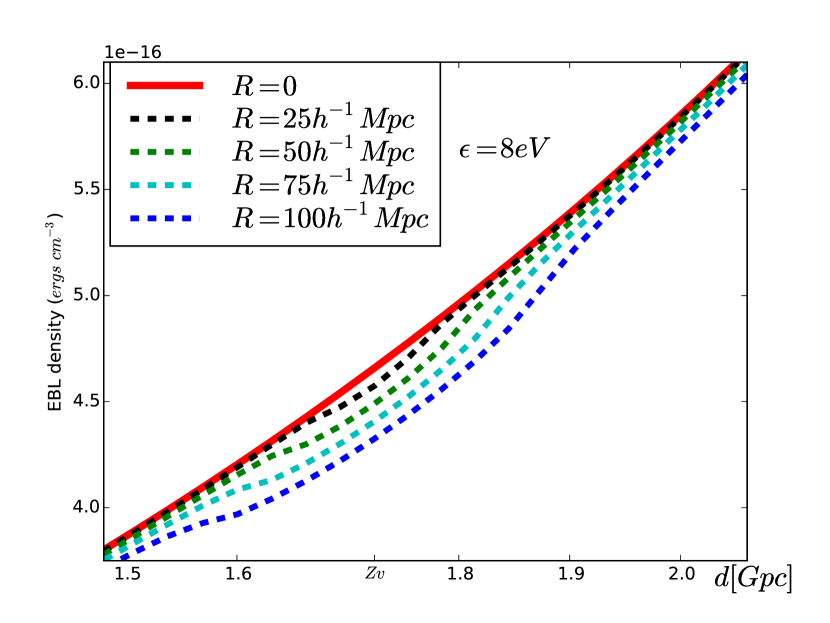
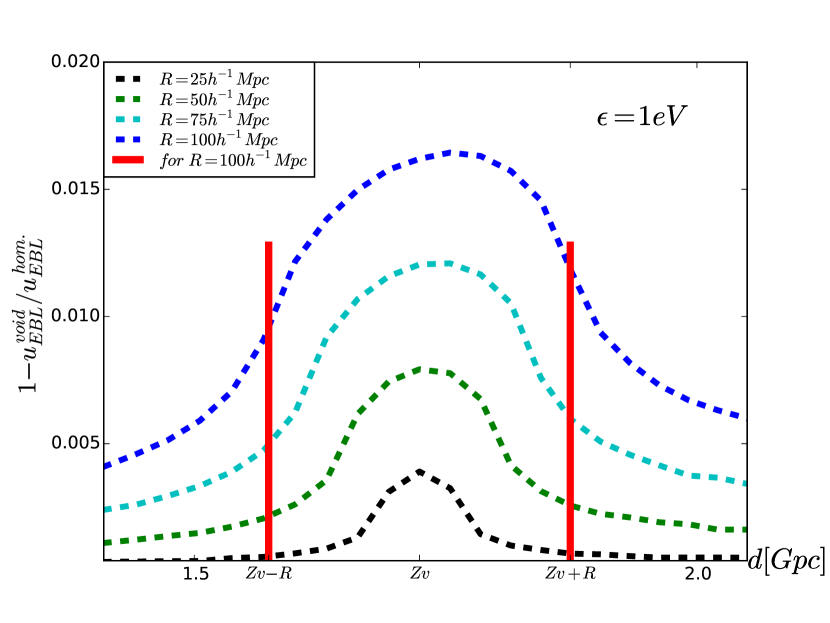
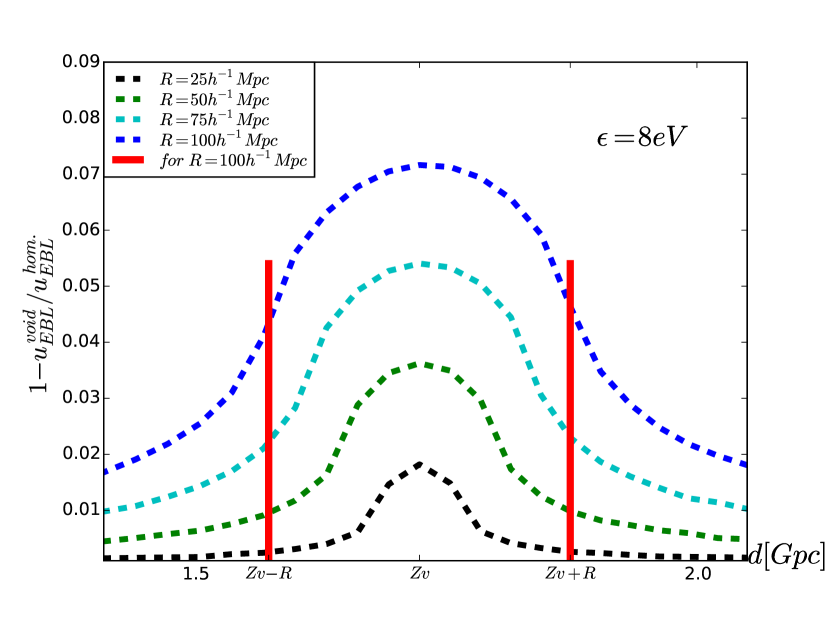
Figure 3 illustrates the effect of the void on the differential EBL energy density as a function of distance along the line of sight to the -ray source, for two representative EBL photon energies, in the near-IR ( eV) and near-UV ( eV). The top panels show the absolute values of the energy densities, while the bottom panels show the fractional difference between the homogeneous and the inhomogeneous cases. The figure illustrates that the maximum effect (at the center of the void) is approximately proportional to the size of the void, but does not exceed % in the case of the Mpc void.
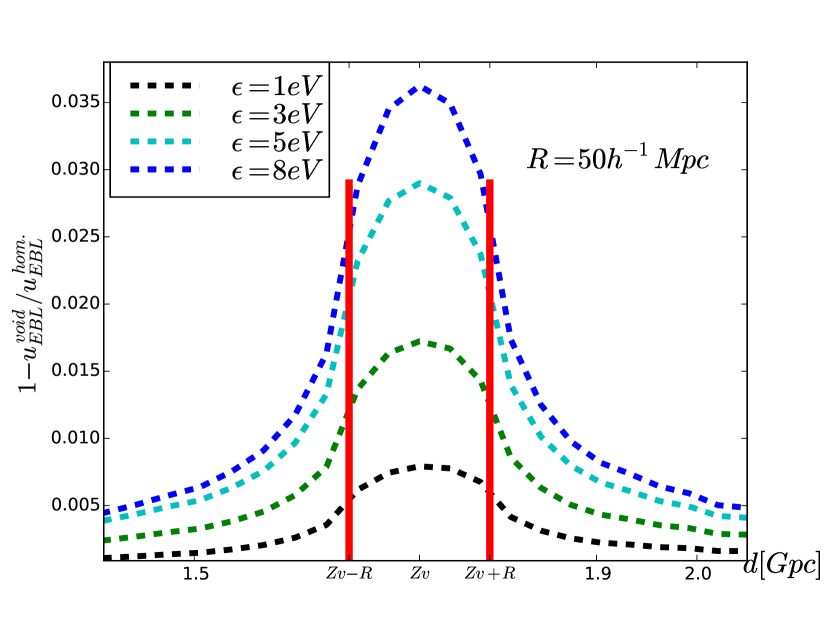
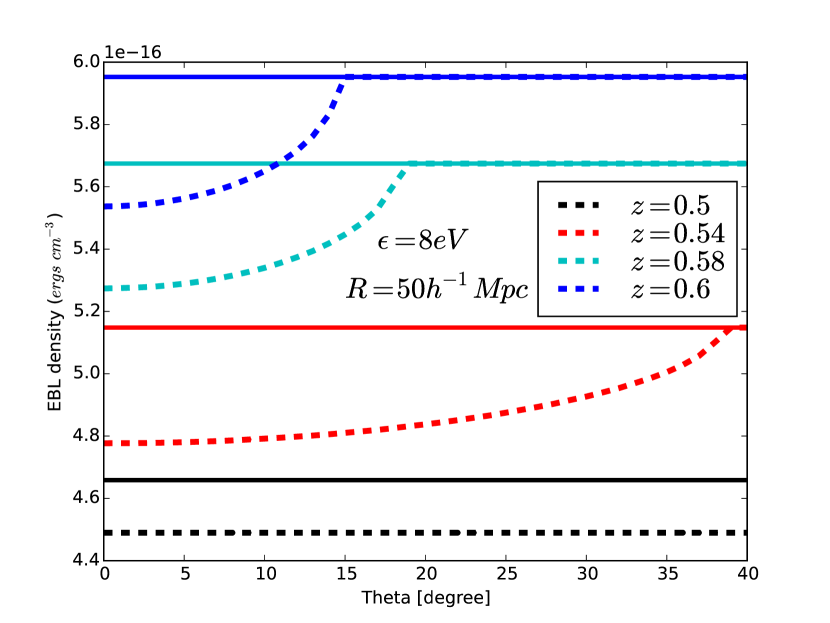
The relative EBL deficit as a function of distance is plotted for various different photon energies in the case of the Mpc void in the left panel of Figure 4. The right panel of Figure 4 illustrates the angle dependence of the EBL in the presence of a void, compared to the homogeneous case. Right in the center of the void ( in the example studied here), the EBL is isotropic, due to the assumption of a spherical void, but reduced compared to the homogeneous EBL case. For positions located outside the void, the reduction is present only for EBL photon arrival directions intersecting the void, as expected.

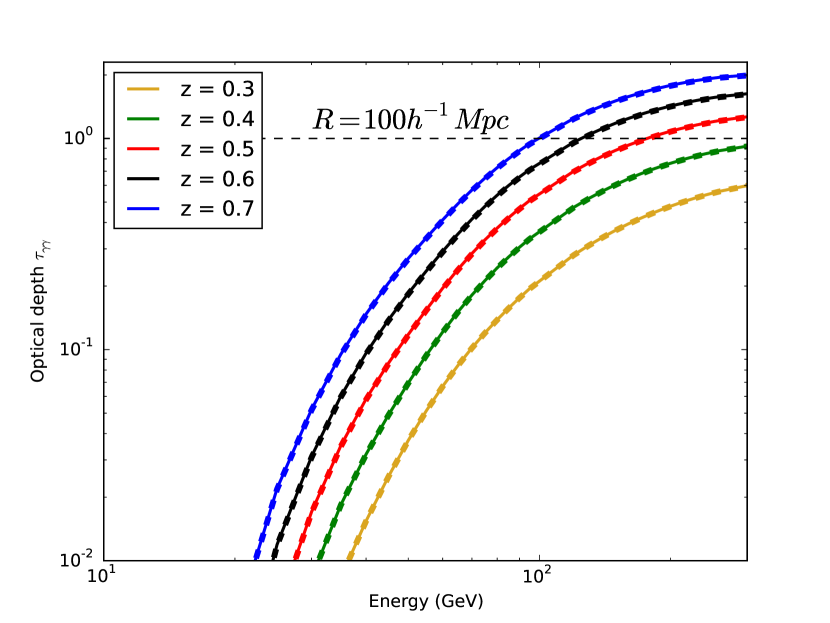
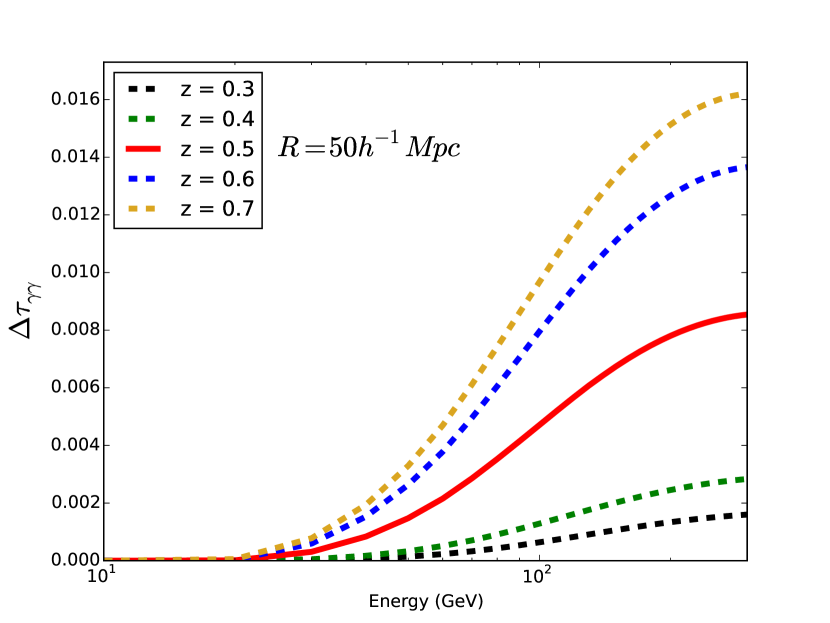
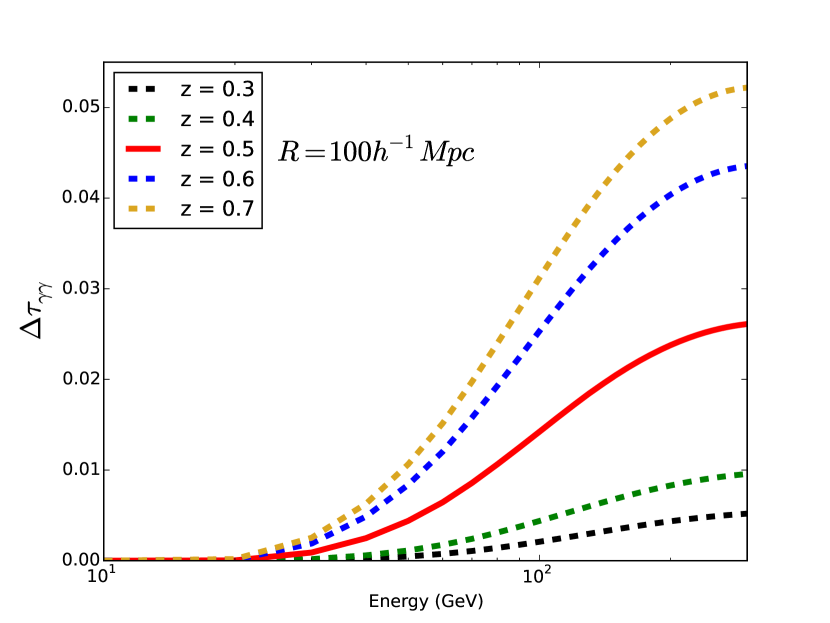
Figure 5 illustrates the effect of a void on the opacity for the same two example cases as illustrated in Figure 2, for sources located at various redshifts in front of, within, and behind the void. As expected, the effect is negligible if the source is located in front of the void (as seen by an observer on Earth), and is maximum for source locations right behind the void. However, even in the case of the Mpc void, the maximum effect on the opacity is less than 1 %. Note that the effect on the opacity is much smaller than the maximum EBL energy density deficit in the center of the void due to the integration over the entire line of sight.
3.2 Multiple voids along the line of sight
After investigating the effect of one single cosmic void along the line of sight we now investigate the
more realistic case of several voids along (or near) the line of sight. From Figure 3,
we notice that the relativie EBL-energy-density-deficit scales approximately proportional to the size of
the void. We therefore conclude that the effect of a number of voids of radius is aproximately
the same as the effect of a large void with radius . As a test case, we therefore consider
void sizes up to Gpc which approximates the effect of voids with realistic
void sizes Mpc distributed along or very close to the line of sight. The center of
the cumulative void is assumed to be located at a redshift of , considering a source located at
redshift .
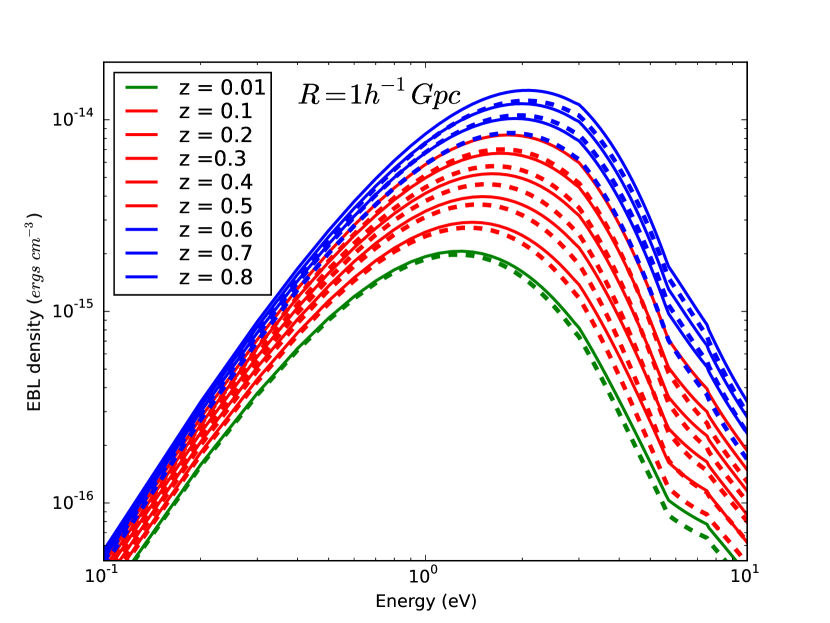
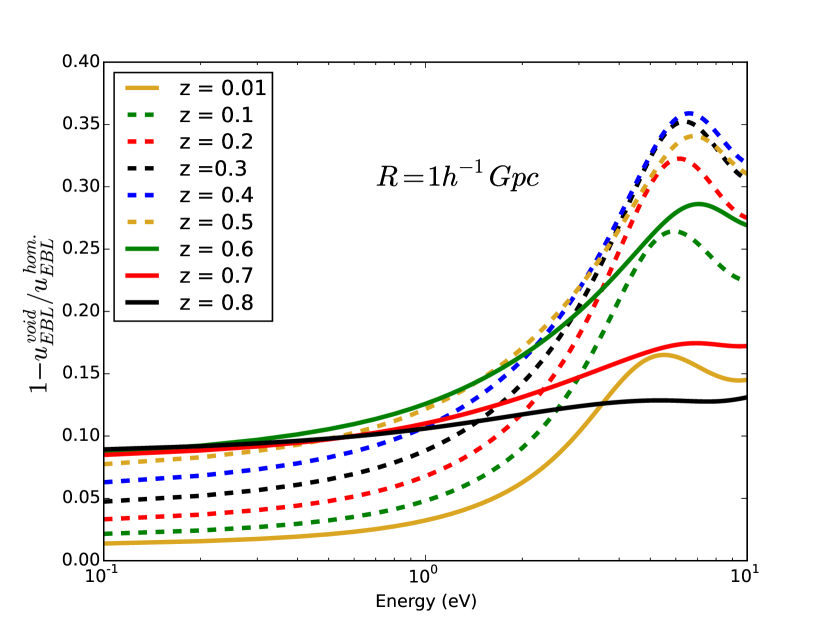
Figure 6 (top left panel) compares the EBL energy density spectrum for the case of such
an accumulation of voids (dashed lines) to the homogeneous EBL case (solid lines). The top right panel of
Figure 6 shows the fractional difference between the homogeneous and the inhomogeneous
case as a function of photon energy for various redshifts along the line of sight. In the bottom left panel
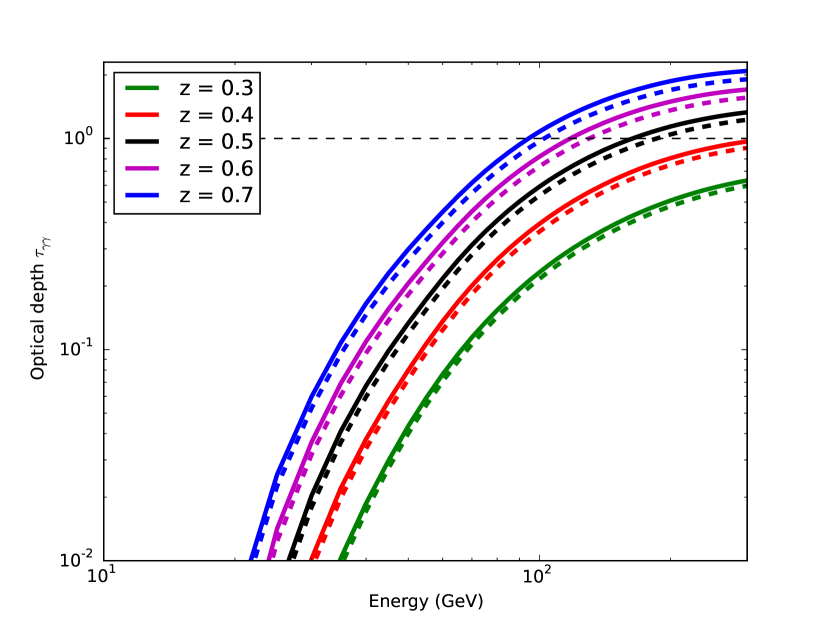
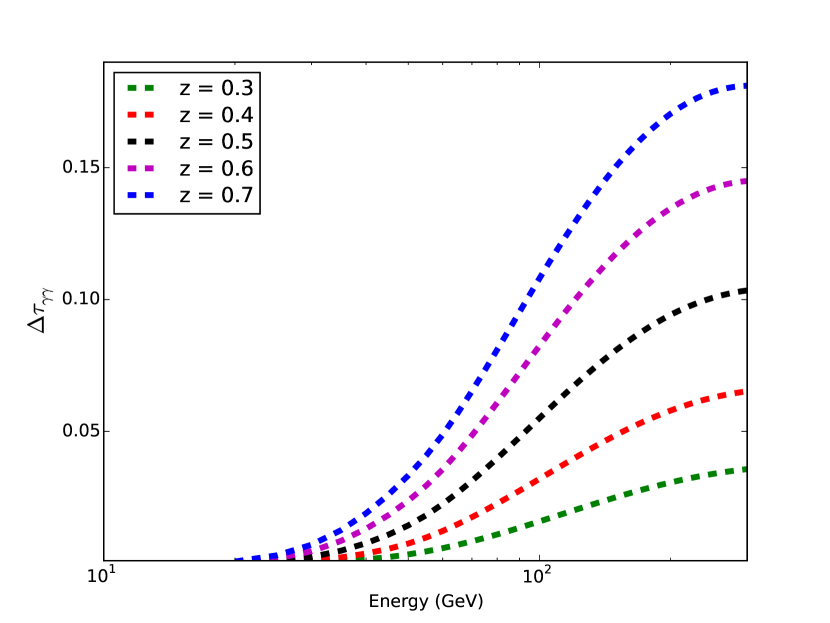
of Figure 6, we compare the resulting opacities for the case of an ensemble
of voids (dashed lines) and the homogeneous EBL case (solid lines), and the bottom right panel shows the
optical depth deficit due to the presence of the voids for the same two cases as in the
left panel.
We can notice that for the extreme case of an accumulation of about 10 voids of typical sizes along the line
of sight to a blazar, the EBL energy density even at the center of the cumulative void is reduced by around 35 %,
and the resulting maximum opacity reduced by around 15 %. This is because even if the star-formation
rate is set to zero within the void, the EBL density within the void is still substantial due to the contributions
from the rest of the Universe outside the void.
3.3 Application to PKS 1424+240
Furniss et al. (2015) had investigated the possibility that the unusually hard VHE -ray spectra observed in some distant () -ray blazars might be due to a reduced EBL density caused by galaxy underdensities along the line of sight. Specifically, they investigated a possible correlation between galaxy-count underdensities based on the Sloan Digital Sky Survey (SDSS) and the positions of hard-spectrum VHE blazars, and found a tentative hint for such a correlation (although the small sample size prevented the authors from drawing firm conclusions). Based on this result, as a first estimate of the effect of such underdensities on the EBL, they suggested a linear scaling of the line-of-sight galaxy density with the EBL opacity. For the specific case of the distant (, Furniss et al., 2013) VHE blazar PKS 1424+240, they found that the reduction of the EBL resulting from such a direct linear scaling is not sufficient to remove the apparent spectral hardening of the VHE -ray spectrum observed by VERITAS, when correcting for EBL absorption based on state-of-the-art (homogeneous) EBL models (Archambault et al., 2014).
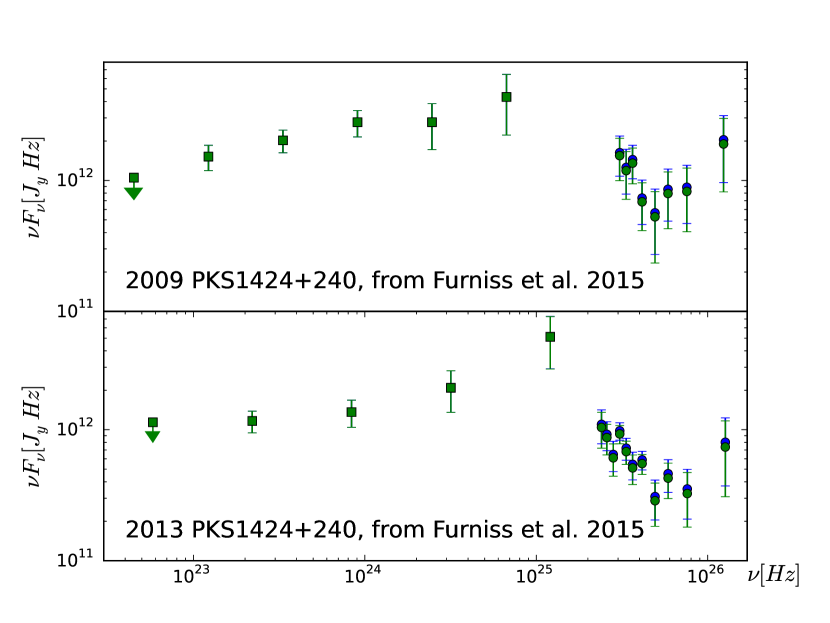
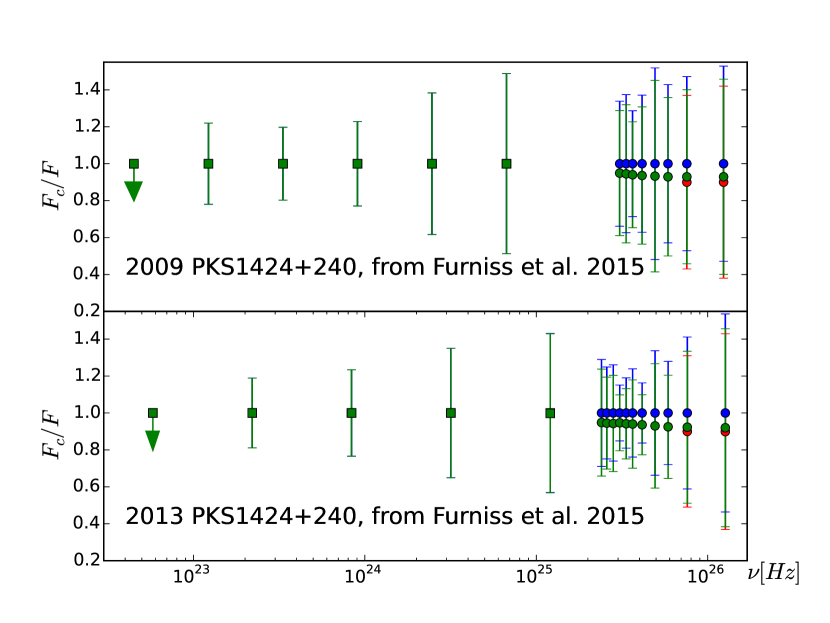
For an assumed redshift of for PKS 1424+240, our example case of Mpc and results in approximately the same galaxy-count underdensity factor as found by Furniss et al. (2015) along the line of sight to this source. In Figure 7, we therefore compare the EBL reduction effect based on the direct linear scaling with galaxy underdensity, with our detailed EBL calculation assuming a void along the line of sight, for the two observing periods presented in Archambault et al. (2014). The left panel illustrates the effect on the actual spectra, while the right panel shows the -ray spectra normalized to the flux points corrected by the homogeneous Gilmore et al. (2012) EBL-absorption model. The figure illustrates that the EBL-opacity reduction effect due to the void, found in our detailed calculations, is slightly smaller than the effect resulting from a direct linear scaling with galaxy underdensity. Thus, we conclude that the tentative spectral hardening of the VHE spectrum of PKS 1424+240 is likely not an artifact of an under-estimate of the EBL opacity due to possible EBL inhomogeneities.
4 Summary and Conclusions
We have presented detailed calculations of the effect of cosmic inhomogeneities on the EBL and the resulting opacity for VHE -ray photons from sources at cosmological distances. Specifically, we have considered the presence of a cosmic void, which, for simplicity, we have represented as a spherical region in which the local star formation rate is zero. We have shown that for realistic void sizes of Mpc, the EBL energy density even at the center of the void is reduced by less than 10 %. Even if the void is located right in front of the background -ray source, the opacity is reduced by typically less than 1 %. We found an approximately linear scaling of the EBL deficit effect with the size of the void. Even in the presence of a large number of voids adding up to a total line of sight distance through voids of Gpc (), the EBL opacity is only reduced by %.
This reduction is smaller than obtained from a direct linear scaling of the opacity with galaxy-count underdensities along the line of sight to -ray sources. For the specific case of PKS 1424+240, we have illustrated that the inferred (marginal) spectral hardening of the VHE -ray spectrum, after correction for EBL absorption, if confirmed by future, more sensitive VHE -ray observations, is most likely not an artifact of an over-estimation of the EBL opacity due to cosmic inhomogeneities.
Since we have shown that realistic EBL inhomogeneities do not lead to a significant reduction of the EBL opacity, hints for unexpected spectral hardening of the VHE spectra of several blazars remain, for which other explanations would have to be invoked, if they can be confirmed by future observations (e.g., by the Cherenkov Telescope Array, CTA). One possibility is that this hardening is, in fact, a real, intrinsic feature of the -ray spectra of these blazars, possibly due to a pion-production induced cascade component in a hadronic blazar model scenario (e.g., Böttcher et al., 2013; Cerruti et al., 2015). If such a spectral hardening is not intrinsic to the source, more exotic explanations, such as ALPs or a cosmic-ray induced secondary radiation component, would need to be invoked.
5 Acknowledgments
We thank Amy Furniss for stimulating discussions and for sharing the PKS 1424+240 data with us. We also thank the anonymous referee for a careful reeding of the manuscript and helpful suggestions which have led to significant improvements of the manuscript. The work of M.B. is supported through the South African Research Chair Initiative of the National Research Foundation111Any opinion, finding and conclusion or recommendation expressed in this material is that of the authors and the NRF does not accept any liability in this regard. and the Department of Science and Technology of South Africa, under SARChI Chair grant No. 64789.
References
- Aharonian et al. (2006) Aharonian F. et al. 2006, Nature, 440, 1018
- MAGIC Collaboration (2008) MAGIC Collaboration: Albert, J., et al., 2008, Science, 320, 1752
- Archambault et al. (2014) Archambault S. et al. 2014, ApJ, 785, L16
- Biteau & Williams (2015) Biteau A. & Williams D. A. 2015, ApJ, 812, 1
- Böttcher et al. (2013) Böttcher, M., Reimer, A., Sweeney, K., & Prakash, A., 2013, ApJ, 768, 54
- Cerruti et al. (2015) Cerruti, M., Zech, A., Boisson, C., & Inoue, S., 2015, MNRAS, 448, 910
- Dominguez et al. (2011a) Dominguez, A., et al., 2011a, MNRAS, 410, 2556
- Dominguez et al. (2011b) Dominguez, A., Sánchez-Conde, M. A., & Prada, F., 2011b, J. Cosmol. Astropart. Phys., 11, 020
- Essey & Kusenko (2010) Essey W. & Kusenko A. 2010, ApJ, 33, 81
- Finke et al. (2010) Finke, J. D., Razzaque, S., & Dermer, C. D., 2010, ApJ, 712, 238
- Franceschini et al. (2008) Franceschini, A., Rodigheiro, G., & Vaccari, M., 2008, A&A, 487, 837
- Furniss et al. (2013) Furniss A., et al., 2013, ApJ, 768, L31
- Furniss et al. (2015) Furniss A., Stutter, P. M., Primack, J. R., & Dominguez, A., 2015, MNRAS, 446, 2267
- Gilmore et al. (2012) Gilmore, R. C., Sommerville, R. S., Primack, J. R., & Dominguez, A., 2012, MNRAS, 422, 3189
- Gould & Schréder (1967) Gould, R. J. & Schréder, G. P. 1967, Phys. Rev., 155, 1408
- Hauser & Dwek (2001) Hauser, M. G. & Dwek, E. 2001, ARA&A, 39, 249
- Kudoda & Faltenbacher (2016) Kudoda, A. M. & Faltenbacher, A., 2016, PoS, HEASA2015, 20
- Nikishov (1962) Nikishov, A. I. 1962, Sov. Phys. JETP, 14, 393
- Razzaque et al. (2009) Razzaque S., Demer, C. D., & Finke, J. D., 2009, ApJ, 697, 483
- Stecker (1969) Stecker, F. W. 1969, ApJ, 157, 507
- Stecker et al. (1992) Stecker, F. W., de Jager, O. C., & Salamon, M. H., 1992, ApJ, 390, L49
- Sushch & Böttcher (2015) Sushch, I. & Böttcher, M. 2015, A & A, 573, A47