Polarons Explain Luminescence Behavior of Colloidal Quantum Dots at Low Temperature
Abstract
Luminescence properties of colloidal quantum dots have found applications in imaging, displays, light-emitting diodes and lasers, and single photon sources. Despite wide interest, several experimental observations in low-temperature photoluminescence of these quantum dots, such as the short lifetime on the scale of microseconds and a zero-longitudinal optical phonon line in spectrum, both attributed to a dark exciton in literature, remain unexplained by existing models. Here we propose a theoretical model including the effect of solid-state environment on luminescence. The model captures both coherent and incoherent interactions of band-edge exciton with phonon modes. Our model predicts formation of dressed states by coupling of the exciton with a confined acoustic phonon mode, and explains the short lifetime and the presence of the zero-longitudinal optical phonon line in the spectrum. Accounting for the interaction of the exciton with bulk phonon modes, the model also explains the experimentally observed temperature-dependence of the photoluminescence decay dynamics and temperature-dependence of the photoluminescence spectrum.
Introduction
Colloidal quantum dots show size-tunable luminescence spectrum Alivisatos (1996); Klimov (2003), have high luminescence efficiency at room temperature Lee et al. (2000); Qu and Peng (2002), and can be easily functionalized for incorporation into a variety of systems de Mello Donegá (2011). These properties make them useful as biomarkers Bruchez Jr. et al. (1998), gain materials for light emitting diodes Mashford et al. (2013); Qian et al. (2011) and lasers Min et al. (2006); Eisler et al. (2002), and electroluminescent materials for displays Coe et al. (2002). They are also potential candidates for single photon sources Brokmann et al. (2004a). It is crucial to understand the fundamental mechanism for luminescence in these quantum dots to tailor their properties for different applications and to overcome issues like blinking M. Nirmal, B. O. Dabbousi, M. G. Bawendi, J. J. Macklin, J. K. Trautman (1996), trapping of carriers Jones et al. (2003), and non-radiative recombination processes Klimov et al. (2000) that hinder many potential applications. For these reasons, colloidal quantum dots have been the subject of many experimental Klimov (2007); Califano et al. (2005); Crooker et al. (2003); Biadala et al. (2009); Brokmann et al. (2004b); Fushman et al. (2005); Rakher et al. (2010, 2011); Di et al. (2012); Gesuele et al. (2012); Gupta and Waks (2013); Oron et al. (2009); Eilers et al. (2014); Biadala et al. (2016); Robel et al. (2015); Talapin et al. (2003, 2004); Makarov et al. (2014); Choi et al. (2012); Kagan et al. (1996) and theoretical Efros et al. (1996); Leung et al. (1998); Franceschetti et al. (1999); Gupta and Waks (2014); Rodina and Efros (2015, 2016); Manjavacas et al. (2011) studies.
Luminescence spectrum and decay dynamics of a quantum dot are governed by the band-edge exciton and its interaction with the solid-state environment. Numerous experiments and theoretical calculations have established that the fine structure of the band-edge exciton in a variety of colloidal quantum dots — CdSe, InAs, CdTe, PbSe, ZnSe, InP/ZnS, and Ge — includes the lowest-lying ”dark” exciton state from which optical transition to ground state is forbidden, followed by a higher-energy ”bright” exciton state from which optical transition to ground state is allowed M. Nirmal, B. O. Dabbousi, M. G. Bawendi, J. J. Macklin, J. K. Trautman (1996); Efros et al. (1996); Klimov (2007); Oron et al. (2009); Eilers et al. (2014); Biadala et al. (2016); Robel et al. (2015). Because optical transitions are forbidden, a dark state should have an infinitely large radiative lifetime; in reality, interaction with solid-state environment reduces the lifetime. Even after taking such interactions into account, theoretical calculations predict dark exciton lifetimes on the order of milliseconds Califano et al. (2005, 2007). However, experimentally observed lifetimes at 2 K, when most of the excited-state population is expected to reside in the lowest-lying dark exciton state, are found to be surprisingly lower, in the range of 0.35 s - 81 s Crooker et al. (2003); Oron et al. (2009); Eilers et al. (2014); Biadala et al. (2016); Robel et al. (2015).
For temperatures less than 20 K, photoluminescence decay of colloidal quantum dots exhibits two distinct lifetimes Crooker et al. (2003); Labeau et al. (2003). At 2 K, the longer of these approaches the above mentioned microsecond-scale lifetime (the other being much smaller), and has been found to vary with temperature in a variety of colloidal quantum dots Crooker et al. (2003); Biadala et al. (2009); Brovelli et al. (2011); Rainò et al. (2011); Labeau et al. (2003); De Mello Donegá et al. (2006); Oron et al. (2009); Werschler et al. (2016). To explain the temperature dependencene, a three-level model with ground, dark, and bright states, and with thermal distribution of population between the dark and the bright states, has been widely used Labeau et al. (2003); Crooker et al. (2003); De Mello Donegá et al. (2006); Oron et al. (2009); Biadala et al. (2009); Brovelli et al. (2011); Eilers et al. (2014); Biadala et al. (2016); Werschler et al. (2016). Although the model predicts the temperature-dependence of the lifetime, it does not explain the shortening of the lifetime of the dark exciton from theoretically predicted milliseconds to experimentally observed microseconds Califano et al. (2005); Biadala et al. (2009). The model also does not explain other experimental observations. In the photoluminescence spectrum at 2 K, three closely and almost equally spaced peaks have been observed Biadala et al. (2009). The lowest energy peak has been attributed to confined acoustic phonon sideband of the dark exciton, and the two higher energy peaks are attributed to zero-longitudinal phonon (LO) lines of the dark and the bright exciton. The existing theoretical model does not explain the existence of the lowest energy peak, and though the model assigns one of the peaks in photoluminecsence spectrum to zero-LO phonon line of the dark exciton, the origin of radiaitve decay of dark exciton is not understood Biadala et al. (2009). In experiments, the relative strengths of the three peaks change and their linewidths increase with increase in temperature Biadala et al. (2009).
To explain the short lifetime of the dark exciton at low temperatures, three hypotheses have been proposed. The first hypothesis attributed the shortening of lifetime to surface states which could result in mixing of the dark and the bright exciton states Califano et al. (2005). However, this hypothesis is disproved by the experiments in which changes in surface passivation coating did not affect the lifetime Crooker et al. (2003); De Mello Donegá et al. (2006). The second hypothesis attributes the shortening of lifetime to LO phonon-assisted recombination of the dark exciton Crooker et al. (2003). Indeed, LO phonon sideband of the dark exciton has been observed in photoluminescence measurements Biadala et al. (2009). However, experimental observation of a zero-LO-phonon line for the dark exciton in photlouminescence spectrum Biadala et al. (2009) shows that the dark exciton must also have a direct radiative decay channel, unaccounted in the hypothesis. The third hypothesis states that the shortening of lifetime is caused by the exciton coupling to confined acoustic phonon modes Oron et al. (2009); Huxter and Scholes (2010); Eilers et al. (2014); Rodina and Efros (2015, 2016); however no specific coupling mechanism has been proposed or demonstrated.
Here we propose a model to explain the unexpectedly short exciton lifetime in colloidal quantum dots at low temperatures, building upon a set of recent observations. Confined acoustic phonon modes have been observed in colloidal quantum dots in a variety of experiments Saviot et al. (1996); Woggon et al. (1996); Sagar et al. (2008); Oron et al. (2009); Chilla et al. (2008); Granados Del Águila et al. (2014); Werschler et al. (2016). Because the observed confined acoustic phonons have energy in the range of 1-10 meV, which matches with the observed energy gap between the bright and the dark excitons Efros et al. (1996); Crooker et al. (2003), and because the phonon modes exhibit a characteristic discrete spectrum (long coherence) Chilla et al. (2008); Werschler et al. (2016), strong exciton-acoustic phonon coupling in colloidal quantum dots is expected. This behavior is analogous to that seen in self-assembled indium arsenide quantum dots in which both experiments and theoretical calculations have shown formation of polarons by strong coupling of exciton and LO phonons; this coupling occurs because LO phonon energy often matches the energy gap between exciton states and because LO phonons have weak dispersion Preisler et al. (2006); Hameau et al. (2002, 1999); Sarkar et al. (2005); Knipp et al. (1997); Verzelen et al. (2002). Based on these observations, we propose that the photoluminescence spectrum and photoluminescence decay dynamics of colloidal quantum dots at low temperatures can be explained by strong coupling between exciton and a confined acoustic phonon mode, resulting in dressed exciton-phonon (polaron) states.
Our model for the colloidal quantum dot at low temperature consists of a ground state, a dark exciton state, and a bright exciton state (as predicted from fine structure of band-edge exciton), where the excitonic states are coupled via a confined (coherent) acoustic phonon mode and also interact with a bath of bulk (incoherent and dispersive) phonons. The model predicts that the strongly-coupled exciton-confined acoustic phonon system has three excited energy eigenstates: dressed bright, dressed dark, and bare dark exciton states. Our calculations reveal that (a) the microsecond-scale excitonic lifetime observed at low temperatures is the radiative lifetime of the dressed dark state. The model also explains (b) the temperature-dependence of photoluminescence decay Crooker et al. (2003); Biadala et al. (2009); Brovelli et al. (2011); Rainò et al. (2011); Labeau et al. (2003); De Mello Donegá et al. (2006); Oron et al. (2009); Werschler et al. (2016), (c) the existence of the lowest energy peak in the three-peak spectrum and the radiative decay channel of the zero-LO phonon line of the dark exciton Biadala et al. (2009), and (d) the temperature-dependence of the photoluminescence spectrum Biadala et al. (2009).
Quantum Dot Model
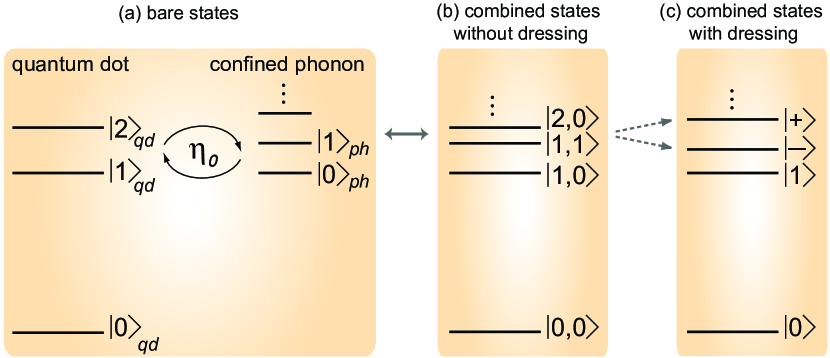
We model a colloidal quantum dot as a three level system consisting of a ground , a dark exciton and a bright exciton state (Fig. 1a), which is sufficient for modeling the photoluminescence behavior Klimov (2007). The Hamiltonian accounting for the interaction of the quantum dot with a confined acoustic phonon mode, under rotating wave approximation, is
| (1) |
Here, we set the energy of the ground state of the quantum dot to zero. We define and as the resonant frequencies of the bare dark and the bare bright exciton states, and as the frequency of the confined acoustic phonon mode (Fig. 1a). The operator represents atomic dipole operator when and atomic population operator when . Boson annihilation (creation) operator for confined acoustic phonon mode is (). The excitons interact with the confined acoustic phonon mode via deformation potential coupling Takagahara (1996), which is governed by (Fig. 1a). Many experimental findings in colloidal quantum dots at low temperatures suggest that is greater than the decay rates of excitons and the confined acoustic phonon mode Krauss and Wise (1997); Oron et al. (2009); Sagar et al. (2008); Califano et al. (2005); Labeau et al. (2003); Spann et al. (2013). Therefore, we consider the excitonic states and the confined acoustic phonon mode to be strongly coupled. Diagonalization of system Hamiltonian, (Eq. 1), gives three excited eigenstates (dressed or polaron states) for the first ladder of the manifold Blais et al. (2004): ; ; and .
The corresponding eigen-frequencies are , , and , where
| (2) |
Here , is the detuning between the dark-bright splitting and the confined acoustic phonon mode energy, and represents combined state of exciton-phonon system without dressing (factorized state) with index for the quantum dot states and index for confined acoustic phonon states (Fig. 1b). Since we are interested in understanding luminescence behavior of the quantum dots at low temperature (upto 20 K), regime in which average phonon number is less than 1, we restrict our analysis to the first ladder of the manifold.
The radiative decay rates for the dressed states (Fig. 1c) are
| (3) |
where is the radiative decay rate of bare bright exciton state ; see Methods Eq. 9 for derivation.
To analyze the dynamics of the dressed system by including incoherent processes resulting from interaction with phonon bath and photon bath, we use master equation: , where is the combined density matrix of the quantum dot-phonon system, is the system Hamiltonian in the dressed state basis (Methods Eq. 11), , , and represent Lindblad superoperators accounting for spontaneous emission, phonon scattering and pure dephasing, and incoherent pumping, respectively (Methods Eq. 12). We neglect terms containing bilinear functions of phonon operators in our analysis. Since and are dependent on material and size of the quantum dot Takagahara (1996); Sagar et al. (2008); Krauss and Wise (1997), a range of values are possible for both the parameters. Putting a conservative bound on the possible detuning in the system, we assume . Under this condition, the dressed dark state (lower polaron, ) is predominantly a phononic state and the dressed bright state (upper polaron, ) is predominantly an excitonic state. Hence, we neglect interactions of with excitonic states, and , via a phonon.
We derive the equations of motion for the state-populations from the master equation as
| (4) |
and relevant dipole transition dynamics as
| (5) | ||||
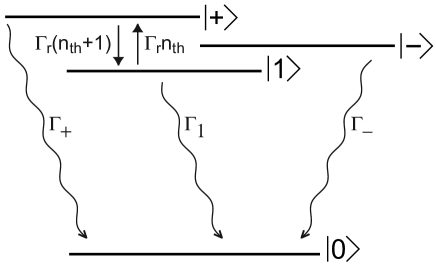
where is bulk phonon-assisted spin-flip rate between the dressed bright and the bare dark exciton states, where , is incoherent pumping rate for different energy eigenstates, is the radiative decay rate of bare dark exciton state , and is bulk phonon number under thermal equilibrium at temperature and energy . Figure 2 shows the various energy levels and the population decay rates in the dressed state basis. The decay rates of the dipole moments (Eq. 5) in the dressed state basis are , , and , where and is pure dephasing rate. Using Eqs. 4-5 we next calculate expressions for steady-state luminescence spectrum and luminescence decay.
Steady-state Luminescence Spectrum
To calculate expression for steady-state luminescence spectrum of this quantum dot-phonon system, we express the electric field operator at the detector Madsen and Lodahl (2013) as ; because the separation between transition frequencies is small (1-10 meV), we assume the collection efficiency of the detector is the same for various transition frequencies. Using equations of motion of transition dipoles (Eq. 5) and Quantum Regression Theorem Scully and Zubairy (1997), we calculate two-time correlation function of the electric field at the detector, and calculate steady-state luminescence spectrum, , using Wiener-Khinchin theorem Scully and Zubairy (1997) (Methods Eq. 13).
| (6) |
The relative contributions of various transitions to the steady-state luminescence spectrum in Eq. 6 depend on respective steady-state populations of each excited state, , where . We evaluate by solving Eq. 4 in steady state. Eq. 6 immediately provides an explanation for the observation Biadala et al. (2009) that the steady state spectrum consists of three peaks at eigenenergies (Eq. 2) of the quantum dot-phonon system. All three peaks correspond to zero-LO phonon states. However, the middle peak — assigned in literature to the zero-LO phonon line of the dark exciton (’F’) Biadala et al. (2009) — has been been a puzzling observation, as described above. Our model clears the confusion by qualifying the nature of the state further — the middle peak corresponds to the zero-LO phonon line of the dressed dark state of the exciton-confined acoustic phonon system. The dressing imparts a partial bright character to the dark-exciton-one-phonon factorized state (Eq. 3) due to which it appears in the emission spectrum. Similarly, our model shows that the highest energy peak that has been assigned in literature to the zero-LO phonon line of the bright exciton (’A’) Biadala et al. (2009) is actually zero-LO phonon line of the dressed bright state of the exciton-confined acoustic phonon system. Further, the lowest energy peak has also been observed in experiments, and was assigned to the confined acoustic phonon sideband of the dark exciton (’Ac’) Biadala et al. (2009). However, this assignment has been problematic, as it also predicts a confined acoustic phonon sideband of the bright exciton, which has not been observed in experiments. Our model shows that the lowest energy peak actually corresponds to the zero-confined acoustic phonon line of the bare dark exciton state.
Luminescence Decay Dynamics
Next, we investigate the dynamics of luminescence decay of the quantum dot. Upon pulsed excitation at time 0, the luminescence signal received by the detector Labeau et al. (2003); Biadala et al. (2016) is , again assuming the collection efficiency of the detector is the same for all three transition frequencies. To calculate time-dependent expressions for populations, we solve coupled equations of motion, Eq. 4, with pumping rates 0, in terms of initial conditions where . The eigenvalues of the matrix in Eq. 4 represent eigen decay rates of the system, and are given by Eq. 14 in Methods section. In colloidal quantum dots, typical values for phonon assisted spin-flip times are 100 ps, bright exciton decay lifetime 10 ns, and expected dark exciton lifetime 1 ms Labeau et al. (2003); Biadala et al. (2009); Califano et al. (2005); Masia et al. (2012). Therefore, ; and ; these conditions simplify Eq. 14 to
| (7) |
Here, eigen decay rate represents decay rate of the dressed dark state that is predominantly a phononic state. The population of the dressed dark state decays only due to spontaneous emission of photons, resulting in temperature-independent decay of its population. The other two states, the dressed bright and the bare dark exciton, exchange population via bulk phonons; their decay is characterized by a fast rate that represents the non-radiative decay of population due to a bulk phonon-assisted spin-flip process and a slow rate that represents the radiative decay of populations due to spontaneous emission of photons. The signal received by the detector takes the form
| (8) |
where , , and represent contribution of respective eigen decay rates to the detected signal . These contributions depend on various decay rates of the system and initial conditions for (Methods Eqs. 15-16). Eqs. 7-8 immediately provide an explanation for the temperature-dependent decay curves observed experimentally Crooker et al. (2003); Biadala et al. (2009); Brovelli et al. (2011); Rainò et al. (2011); Labeau et al. (2003); De Mello Donegá et al. (2006); Oron et al. (2009); Werschler et al. (2016). In the next section, we calculate and analyze photoluminescence spectrum and decay curves for a specific case of quantum dots.
Calculations for CdSe Quantum Dots
To perform calculations, we consider the specific case of CdSe colloidal quantum dotsCrooker et al. (2003); De Mello Donegá et al. (2006); Biadala et al. (2009). In time-resolved photoluminescence experiments on these quantum dots at 2 K, two distinct decays have been observed: an extremely fast decay and a slow decay with lifetime of 1 s that is temperature independent below 2 K Crooker et al. (2003); De Mello Donegá et al. (2006); Biadala et al. (2009). From Eq. 7, at 2 K when , we associate the fast decay to , and the slow and temperature-independent decay to . Therefore, we assign the observed 1 s lifetime to the dressed dark state of our model and set ns-1. The bright exciton is expected to have an intrinsic radiative lifetime of about 10 ns Califano et al. (2005); Labeau et al. (2003), and therefore we set decay rate of bare bright exciton 0.1 ns-1. Using Eq. 3, and the values of and , we estimate 0.1; this low value is not surprising when the system has not been engineered for maximising the coupling or minimizing the detuning . The above analysis also gives 0.1 ns-1 (Eq. 3). Since the bare dark exciton is expected to have lifetime in milliseconds Califano et al. (2007), we set the decay rate of the bare dark exciton to 10-6 ns-1. We set 0.08 meV (see Supporting Information Fig. S1 for results with other values of ), in agreement with experimentally estimated values of less than meV Sagar et al. (2008); Krauss and Wise (1997). We set 2000 meV. Further, we set bulk phonon-assisted spin-flip rate 10 ns-1 and pure dephasing rate as a linear function of temperature , where 0.6 ns-1Biadala et al. (2009); Takagahara (1996); Masia et al. (2012). With these parameters, strong coupling condition — greater than the quantum dot decay rates and the decay rate of the confined acoustic phonon mode which has been shown to be 10-3 ns-1 Bron (2013); Spann et al. (2013) — is also satisfied for .
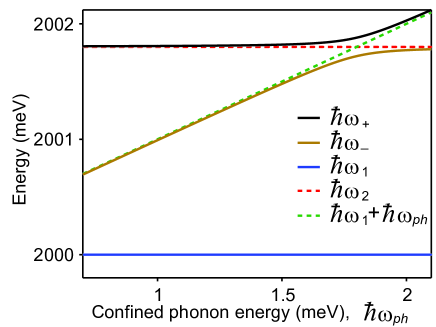
Figure 3 shows variation of eigenenergies of the dressed exciton-phonon system (shown by solid lines) and of the factorized exciton-phonon system (shown by dashed lines) with the energy of the confined acoustic phonon mode, in the absence of any incoherent and decay processes. The state with energy is common to both the dressed and the factorized exciton-phonon systems. The other two eigenenergies of the dressed system are and , and they exhibit the signature anti-crossing behavior. The remaining exciton-phonon factorized states have energies and . This figure shows that the dressed exciton-phonon system has three resonances in the emission spectrum. For further calculations, we set the confined phonon mode energy, 1 meV (see Supporting Information Fig. S1 for results with other values of ).
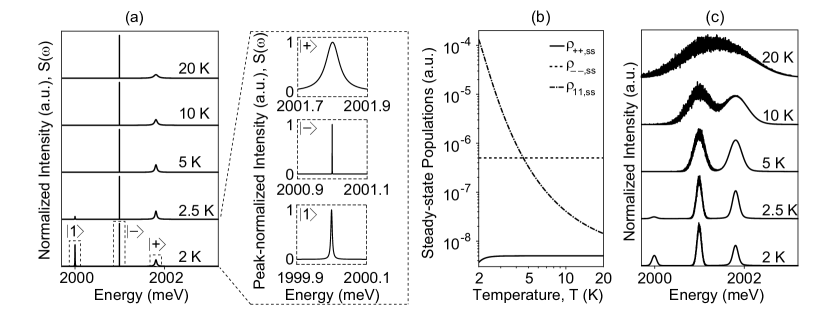
To estimate relative strength of the three peaks in the luminescence spectrum of the quantum dot and analyze how the spectrum changes with temperature, we calculate the steady state spectrum using Eq. 6. We set equal pumping rate for the phononic state () and the excitonic states combined (split equally in and ); 10-9 ns-1 so that it is much smaller than all other decay rates of the system. Figure 4a shows that at T = 2 K, three peaks, as seen in experiments Biadala et al. (2009), are present.
The inset shows a closer view of the individual peaks at 2 K on a normalized intensity scale and the same energy scale. At 2 K, when , the linewidth of the dressed bright state , the linewidth of the dressed dark state and the linewidth of the bare dark exciton state (Eq. 6). Since is an order of magnitude larger than and four orders of magnitude larger than , the linewidth of the dressed bright peak is much broader than the other two peaks. At low temperatures, the bulk phonon density, which is responsible for transfer of population between the bare dark exciton and dressed bright states, grows as with temperature; therefore, as the temperature is increased, the population of bare dark exciton state rapidly decreases and of the dressed bright increases (Fig. 4b). This results in rapid decrease in intensity of the bare dark exciton peak in the spectrum (Fig.4a). We calculate spectrum for a range of values of and and observe similar behavior as in Fig. 4a (Supporting Information Fig. S1).
With increase in temperature, pure dephasing rate increases, which in turn increases the linewidth of the bare dark and the dressed bright exciton peaks (Fig. 4a). However, pure dephasing is not the dominant mechanism for observed linewidth broadening in colloidal quantum dots Empedocles and Bawendi (1999); in agreement with this, our calculations do not predict the broad linewidths (Fig.4a) seen in experiments Biadala et al. (2009). Rather, broadening of linewidths is primarily caused by spectral diffusion attributed to random fluctuation in the local environment of colloidal quantum dots Blanton et al. (1996); Empedocles and Bawendi (1999); Neuhauser et al. (2000); Palinginis et al. (2003); Biadala et al. (2009); Sallen et al. (2010). To incorporate the effect of spectral diffusion, we sample the transition frequencies from Gaussian distributions with means and , as in Fig.4a. Each step of spectrum computation, corresponding to one pair of frequencies sampled from the Gaussian distribution, is treated as 10-s observation. The spectra are then integrated for a minute (i.e. 6 million steps). The standard deviations of the Gaussian distributions, reflecting the fluctuations in the local environment, are expected to depend on the temperature, although the precise relationship between spectral diffusion linewidth and temperature is unknown. We assume a simple, linear dependence on temperature: standard deviations is modeled as 6 ns-1, where the coefficient is arbitrarily chosen to resemble peak-width seen in experiments; we found that the observed behavior remains qualitatively unchanged if the coefficient (Supporting Information Fig. S2) or the nature of the temperature dependence is changed (Supporting Information Fig. S3).
Figure 4c plots steady state spectrum after 1-minute integration. As the temperature is increased, the linewidth of all the peaks increases and the peaks start to merge, a behavior that was also seen in experiments but was attributed to thermal mixing between the two higher energy states (dressed dark and dressed bright of our system) via acoustic phonons Biadala et al. (2009). Our model rigorously accounts for temperature-dependence of quantum dot spectrum and provides an explanation for experimentally observed behavior. Note that, in the absence of spectral diffusion at 2 K, the dressed bright peak has a wider linewidth but lower intensity than the bare dark peak (inset of Fig. 4a). When spectra are integrated, summation of the tall-and-narrow bare dark peaks centered at slightly different frequencies results mostly in widening of the observed peak, while summation of short-and-wide dressed bright peaks results more in increasing the height of the observed peak. As a result, at 2 K, the intensity of the dressed bright peak is higher than that of the bare dark peak in the presence of spectral diffusion (Fig. 4c), although it was relatively lower in the absence of spectral diffusion (Fig. 4a).
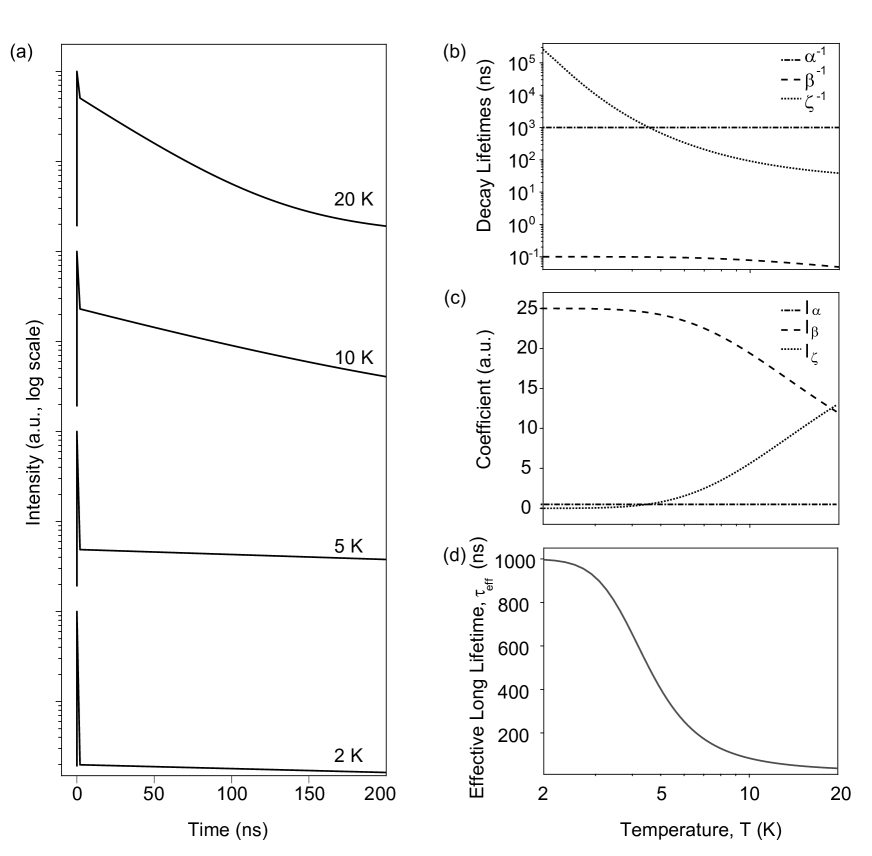
Next, we calculate the luminescence decay dynamics for specific case of CdSe quantum dots. To calculate time-dependence of luminescence intensity detected by the detector (Eq. 8), initial populations where are in the same proportion as pumping rates used while calculating spectrum, and coefficients , and in Eq. 8 are evaluated using Eqs. 15-16 from Methods section. Figure 5a plots quantum dot luminescence signal, (Eq. 8), as a function of time after pulsed excitation at time 0, for different temperatures. At 2 K, when 1, most of the population decays non-radiatively because of the fast phonon relaxation due to (Eq. 7), and therefore, the intensity drops quickly initially and then it decays radiatively at a slow rate (at 2 K, , Fig. 5b). As temperature increases, radiative decay from the dressed bright state starts to compete against the phonon relaxation, which appears as a reduction in the initial drop and early onset of the slower decay of the photoluminescence intensity. This behavior is also seen in Fig. 5c that plots variation of coefficients , and of Eq. 8 with temperature. At 20 K, three decay rates are distinctly visible: the fastest decay is due to phonon-assisted non-radiative relaxation ; the next is which has dominant contribution from radiative relaxation of dressed bright state (); the slowest one is which is radiative relaxation of dressed dark state and is temperature-independent. The predictions of our model match well with the experiments De Mello Donegá et al. (2006), and provide an explanation for the long standing question about the existence of microsecond-scale component of decay. Our calculations also explain (Fig. 5b) experimental observation of temperature-independent radiative lifetime below 2 K Crooker et al. (2003). We calculate decay curves for another set of initial conditions, in which the bare dark exciton is not pumped and observe similar behavior as in Fig. 5a (Supporting Information Fig. S4), showing that the behavior of the model is not too sensitive to the initial conditions.
Many experimental investigations of decay dynamics of colloidal quantum dots have reported an S-shaped temperature dependence for the long-time component of decay De Mello Donegá et al. (2006); Biadala et al. (2009); Oron et al. (2009). To further validate the findings of our model, we plot effective long lifetime, defined as as a function of temperature in Fig. 5d, and observe an S-shaped dependence that matches well with the experimental data.
Conclusions
Multiple features observed in photoluminescence spectrum and photoluminescence decay of colloidal quantum dots at low temperatures ( 20 K) have not been explained by a single model. These include: first, microsecond-scale lifetime attributed to the dark exciton; second, temperature-dependence of the photoluminescence decay; third, existence of the lowest energy peak in the three-peak spectrum and the radiative decay channel for the dark exciton that gives rise to the zero-LO phonon line in the spectrum; fourth, the temperature-dependence of the photoluminescence spectrum.
Our theoretical model provides a physical explanation for all four intriguing features observed in photoluminescence spectrum and photoluminescence decay. Based on experimental evidences from many works Saviot et al. (1996); Woggon et al. (1996); Sagar et al. (2008); Oron et al. (2009); Chilla et al. (2008); Granados Del Águila et al. (2014); Werschler et al. (2016), we propose that the excitonic states and a confined acoustic phonon mode are in strong coupling leading to formation of dressed dark and dressed bright states. Our calculations show that the microsecond-scale excitonic lifetime observed at low temperatures in experiments is the radiative lifetime of the dressed dark state. Our model also accounts for interaction of quantum dot with bulk phonon modes that impart temperature-dependent behavior. Our model provides a physical explanation for the S-shaped temperature dependence for the long-time component of decay. Further, the two dressed states along with the bare dark exciton state are the eigenenergy states of the coupled system, which appear in the photoluminescence spectrum at 2-3 K Biadala et al. (2009). This explains the experimentally observed three-peaked photoluminescence spectrum Biadala et al. (2009). Our model clarifies that the middle peak is the zero-LO phonon line of the dressed dark state of the strongly coupled exciton-phonon system, and therefore has a partial bright character that provides it a radiative decay channel. Finally, our model, with inclusion of spectral diffusion, closely predicts the temperature-dependence of the spectrum, including the observation that the peaks merge with each other around 20 K Biadala et al. (2009).
Our model presents a significant advance over the existing and widely used theoretical model, which is based on thermal distribution of population via acoustic phonons between the dark and the bright exciton states Labeau et al. (2003); Crooker et al. (2003); De Mello Donegá et al. (2006); Oron et al. (2009); Biadala et al. (2009); Brovelli et al. (2011); Eilers et al. (2014); Biadala et al. (2016); Werschler et al. (2016). This existing model does not explain the microsecond lifetime of the dark exciton, and the presence of the lowest energy peak in the three-peak spectrum and the origin of radiative decay channel for the dark exciton. The results from our model also indicate that the existing model does not characterize the middle peak sufficiently. While the middle peak is the zero-LO phonon line of the dark exciton, as characterized by the existing model, it is dressed dark state due to coupling between exciton and confined acoustic phonon mode, which our model predicts.
In our model, we assumed initial conditions that the phononic state and the excitonic states combined are equally pumped to closely match the experimental results. However, changing the initials conditions will not affect the overall conclusions of our model. We assumed that spectral diffusion was linearly dependent on temperature; we also found that changing the relationship to Boltzmann distribution did not affect the conclusions. The precise relation is not known; however it is likely that diffusion will increase monotonically with temperature, and any such dependence is likely to give qualitatively similar results (for example, the merging of the dressed peaks at higher temperatures). The numbers used in our calculations were taken from CdSe quantum dots as these are the most studied; however, short exciton lifetime at low temperatures has been observed in a variety of colloidal quantum dots Crooker et al. (2003); Oron et al. (2009); Eilers et al. (2014); Biadala et al. (2016); Robel et al. (2015).
In our model, we have not accounted for LO-phonon; it can easily be incorporated into this model as an additional, independent decay channel for the dark exciton (this should not affect other conclusions). The observed exciton lifetime at low temperatures has also been found to depend on size of the quantum dot; it can be incorporated in our model by including size-dependence of parameters like exciton-phonon coupling, exciton-phonon detuning, and intrinsic exciton decay rates. The model can be extended to higher temperatures by including the higher manifolds of the dressed states ladder. Our model provides a general framework on which these additional mechanisms can be easily added to provide a detailed description of the behaviors of colloidal quantum dots.
Methods
.1 Decay rate calculation in dressed-state basis
The transition dipole moment between the dressed states and the ground state in the factorized exciton-phonon basis can be expressed as and , where is the projection of dipole moment operator and and .
.2 Hamiltonian in dressed-state basis
The Hamiltonian representing bath and its interaction with quantum dot states
| (10) |
Here, represents energy of the bulk phonon modes; and represents interaction of the quantum dot with bulk phonon modes. is frequency of the bulk phonon modes. Boson annihilation (creation) operator for bulk phonon modes is (). The bright and the dark exciton states of the quantum dot are coupled via bulk acoustic phonon modes with strength that represents bulk phonon-assisted spin-flip process. The dark and the bright state also interact with the bath phonons with strengths and , respectively, which account for pure dephasing mechanisms. To account for dephasing in a strongly coupled system, we need to consider the full Hamiltonian, including dephasing and scattering mechanisms, while deriving the master equation Carmichael and Walls (1973); del Pino et al. (2015).
The total Hamiltonian taking into account the interaction of quantum dot with both confined and bulk phonons, under rotating wave approximation, is . Neglecting terms with bilinear functions of phonon operators, and assuming , i.e., dark and bright exciton states couple to the phonon modes with approximately the same coupling strength, the total Hamiltonian transforms to dressed-state basis as
| (11) | ||||
.3 Linblad superoperators
| (12) |
where Linblad superoperator is defines as for collapse operator . Bulk phonon scattering rate is and pure dephasing rate is . Pumping rates for the dressed bright, dressed dark, and the bare dark exciton states are , , and . The system-bath Hamiltonian in Eq. 11 has a standard form of damped simple harmonic oscillator bath interaction that transforms to Linblad superoperator form of in Eq. 12 Walls and Milburn (2007); Majumdar et al. (2011).
.4 Spectrum
Steady state spectrum expression from Wiener Khinchin theorem Scully and Zubairy (1997)
| (13) |
.5 Decay dynamics
The eigenvalues of the matrix in Eq. 4 represent eigen decay rates, and are given by
| (14) |
The time-dependent populations are
| (15) |
where , and are determined from the initial conditions where . The contributions of the three eigen decay rates to the signal received by the detector in Eq. 8 are
| (16) |
Acknowledgement
We thank Harshawardhan Wanare and Saikat Ghosh for discussions and careful reading of the manuscript. SG acknowledges funding support from IITK (initiation grant) and SERB-Ramanujan fellowship (SB/S2/RJN-134/2014).
References
- Alivisatos (1996) A. P. Alivisatos, Science 271, 933 (1996).
- Klimov (2003) V. I. Klimov, Los Alamos Science 28, 214 (2003).
- Lee et al. (2000) J. Lee, V. C. Sundar, J. R. Heine, M. G. Bawendi, and K. F. Jensen, Advanced Materials 12, 1102 (2000).
- Qu and Peng (2002) L. Qu and X. Peng, Journal of the American Chemical Society 124, 2049 (2002).
- de Mello Donegá (2011) C. de Mello Donegá, Chemical Society reviews 40, 1512 (2011).
- Bruchez Jr. et al. (1998) M. Bruchez Jr., M. Moronne, P. Gin, S. Weiss, and A. P. Alivisatos, Science 281, 2013 (1998).
- Mashford et al. (2013) B. Mashford, M. Stevenson, and Z. Popovic, Nature , 2 (2013).
- Qian et al. (2011) L. Qian, Y. Zheng, J. Xue, and P. Holloway, Nature photonics 5 (2011).
- Min et al. (2006) B. Min, S. Kim, K. Okamoto, L. Yang, A. Scherer, H. Atwater, and K. Vahala, Applied Physics Letters 89, 191124 (2006).
- Eisler et al. (2002) H.-J. Eisler, V. C. Sundar, M. G. Bawendi, M. Walsh, H. I. Smith, and V. Klimov, Applied Physics Letters 80, 4614 (2002).
- Coe et al. (2002) S. Coe, W. Woo, and V. M. Bawendi, Nature 420, 3 (2002).
- Brokmann et al. (2004a) X. Brokmann, E. Giacobino, M. Dahan, and J. P. Hermier, Applied Physics Letters 85, 712 (2004a).
- M. Nirmal, B. O. Dabbousi, M. G. Bawendi, J. J. Macklin, J. K. Trautman (1996) T. D. H. . L. E. B. M. Nirmal, B. O. Dabbousi, M. G. Bawendi, J. J. Macklin, J. K. Trautman, Nature 383, 802 (1996).
- Jones et al. (2003) M. Jones, J. Nedeljkovic, R. J. Ellingson, A. J. Nozik, and G. Rumbles, The Journal of Physical Chemistry B 107, 11346 (2003).
- Klimov et al. (2000) V. I. Klimov, A. A. Mikhailovsky, S. Xu, A. Malko, J. A. Hollingsworth, C. A. Leatherdale, H.-J. Eisler, and M. G. Bawendi, Science 290, 314 (2000).
- Klimov (2007) V. I. Klimov, Annual review of physical chemistry 58, 635 (2007).
- Califano et al. (2005) M. Califano, A. Zunger, and A. Franceschetti, Nano Letters 5, 2360 (2005).
- Crooker et al. (2003) S. A. Crooker, T. Barrick, J. A. Hollingsworth, and V. I. Klimov, Applied Physics Letters 82, 2793 (2003).
- Biadala et al. (2009) L. Biadala, Y. Louyer, P. Tamarat, and B. Lounis, Physical Review Letters 103, 037404 (2009).
- Brokmann et al. (2004b) X. Brokmann, G. Messin, P. Desbiolles, E. Giacobino, M. Dahan, and J. P. Hermier, New Journal of Physics 6, 1 (2004b).
- Fushman et al. (2005) I. Fushman, D. Englund, and J. Vučković, Applied Physics Letters 87, 241102 (2005).
- Rakher et al. (2010) M. T. Rakher, R. Bose, C. W. Wong, and K. Srinivasan, Applied Physics Letters 96, 161108 (2010).
- Rakher et al. (2011) M. Rakher, R. Bose, C. Wong, and K. Srinivasan, Optics Express 19, 1786 (2011).
- Di et al. (2012) Z. Di, H. V. Jones, P. R. Dolan, S. M. Fairclough, M. B. Wincott, J. Fill, G. M. Hughes, and J. M. Smith, New Journal of Physics 14 (2012), 1206.6046 .
- Gesuele et al. (2012) F. Gesuele, M. Y. Sfeir, W. K. Koh, C. B. Murray, T. F. Heinz, and C. W. Wong, Nano Letters 12, 2658 (2012).
- Gupta and Waks (2013) S. Gupta and E. Waks, Optics Express 21, 29612 (2013).
- Oron et al. (2009) D. Oron, A. Aharoni, C. De Mello Donega, J. Van Rijssel, A. Meijerink, and U. Banin, Physical Review Letters 102, 1 (2009).
- Eilers et al. (2014) J. Eilers, J. van Hest, A. Meijerink, and C. D. M. Donega, The Journal of Physical Chemistry C 118, 23313 (2014).
- Biadala et al. (2016) L. Biadala, B. Siebers, Y. Beyazit, M. D. Tessier, D. Dupont, Z. Hens, D. R. Yakovlev, and M. Bayer, ACS Nano 10, 3356 (2016).
- Robel et al. (2015) I. Robel, A. Shabaev, D. C. Lee, R. D. Schaller, J. M. Pietryga, S. A. Crooker, A. L. Efros, and V. I. Klimov, Nano Letters 15, 2685 (2015).
- Talapin et al. (2003) D. V. Talapin, R. Koeppe, S. Götzinger, A. Kornowski, J. M. Lupton, A. L. Rogach, O. Benson, J. Feldmann, and H. Weller, Nano Letters 3, 1677 (2003).
- Talapin et al. (2004) D. V. Talapin, I. Mekis, S. Götzinger, A. Kornowski, O. Benson, and H. Weller, Journal of Physical Chemistry B 108, 18826 (2004).
- Makarov et al. (2014) N. S. Makarov, P. C. Lau, C. Olson, K. A. Velizhanin, K. M. Solntsev, K. Kieu, S. Kilina, S. Tretiak, R. A. Norwood, N. Peyghambarian, and J. W. Perry, ACS Nano 8, 12572 (2014).
- Choi et al. (2012) J. H. Choi, A. T. Fafarman, S. J. Oh, D. K. Ko, D. K. Kim, B. T. Diroll, S. Muramoto, J. G. Gillen, C. B. Murray, and C. R. Kagan, Nano Letters 12, 2631 (2012).
- Kagan et al. (1996) C. Kagan, C. Murray, M. Nirmal, and M. Bawendi, Physical Review Letters 76, 1517 (1996).
- Efros et al. (1996) A. Efros, M. Rosen, M. Kuno, M. Nirmal, D. Norris, and M. Bawendi, Physical Review B 54, 4843 (1996).
- Leung et al. (1998) K. Leung, S. Pokrant, and K. Whaley, Physical Review B 57, 12291 (1998).
- Franceschetti et al. (1999) A. Franceschetti, H. Fu, L. Wang, and A. Zunger, Physical Review B 60, 1819 (1999), 0201087 [cond-mat] .
- Gupta and Waks (2014) S. Gupta and E. Waks, Optics Express 22, 3013 (2014).
- Rodina and Efros (2015) A. Rodina and A. L. Efros, Nano Letters 15, 4214 (2015).
- Rodina and Efros (2016) A. V. Rodina and A. L. Efros, Physical Review B - Condensed Matter and Materials Physics 93, 1 (2016).
- Manjavacas et al. (2011) A. Manjavacas, F. J. D. Abajo, and P. Nordlander, Nano Letters 11, 2318 (2011).
- Califano et al. (2007) M. Califano, A. Franceschetti, and A. Zunger, Physical Review B - Condensed Matter and Materials Physics 75, 1 (2007).
- Labeau et al. (2003) O. Labeau, P. Tamarat, and B. Lounis, Physical Review Letters 90, 25 (2003).
- Brovelli et al. (2011) S. Brovelli, R. D. Schaller, S. a. Crooker, F. García-Santamaría, Y. Chen, R. Viswanatha, J. a. Hollingsworth, H. Htoon, and V. I. Klimov, Nature communications 2, 280 (2011).
- Rainò et al. (2011) G. Rainò, T. Stöferle, I. Moreels, R. Gomes, J. S. Kamal, Z. Hens, and R. F. Mahrt, ACS Nano 5, 4031 (2011).
- De Mello Donegá et al. (2006) C. De Mello Donegá, M. Bode, and A. Meijerink, Physical Review B - Condensed Matter and Materials Physics 74, 1 (2006).
- Werschler et al. (2016) F. Werschler, C. Hinz, F. Froning, P. Gumbsheimer, J. Haase, C. Negele, T. de Roo, S. Mecking, A. Leitenstorfer, and D. V. Seletskiy, Nano Letters 16, 5861 (2016).
- Huxter and Scholes (2010) V. M. Huxter and G. D. Scholes, Journal of Chemical Physics 132 (2010), 10.1063/1.3350871.
- Saviot et al. (1996) L. Saviot, B. Champagnon, E. Duval, I. Kudriavtsev, and a.I. Ekimov, Journal of Non-Crystalline Solids 197, 238 (1996).
- Woggon et al. (1996) U. Woggon, F. Gindele, O. Wind, and C. Klingshirn, Physical Review B 54, 1506 (1996).
- Sagar et al. (2008) D. M. Sagar, R. R. Cooney, S. L. Sewall, E. A. Dias, M. M. Barsan, I. S. Butler, and P. Kambhampati, Physical Review B - Condensed Matter and Materials Physics 77, 1 (2008).
- Chilla et al. (2008) G. Chilla, T. Kipp, T. Menke, D. Heitmann, M. Nikolic, A. Frömsdorf, A. Kornowski, S. Förster, and H. Weller, Physical Review Letters 100, 1 (2008).
- Granados Del Águila et al. (2014) A. Granados Del Águila, B. Jha, F. Pietra, E. Groeneveld, C. De Mello Donegá, J. C. Maan, D. Vanmaekelbergh, and P. C. M. Christianen, ACS Nano 8, 5921 (2014).
- Preisler et al. (2006) V. Preisler, T. Grange, R. Ferreira, L. A. De Vaulchier, Y. Guldner, F. J. Teran, M. Potemski, and A. Lemaître, Physica Status Solidi (C) Current Topics in Solid State Physics 3, 3881 (2006).
- Hameau et al. (2002) S. Hameau, J. Isaia, Y. Guldner, E. Deleporte, O. Verzelen, R. Ferreira, G. Bastard, J. Zeman, and J. Gérard, Physical Review B 65, 1 (2002).
- Hameau et al. (1999) S. Hameau, Y. Guldner, O. Verzelen, R. Ferreira, G. Bastard, J. Zeman, a. Lemaître, and J. Gérard, Physical Review Letters 83, 4152 (1999).
- Sarkar et al. (2005) D. Sarkar, H. P. Van Der Meulen, J. M. Calleja, J. M. Becker, R. J. Haug, and K. Pierz, Physical Review B - Condensed Matter and Materials Physics 71, 71 (2005).
- Knipp et al. (1997) P. Knipp, T. Reinecke, A. Lorke, M. Fricke, and P. Petroff, Physical Review B 56, 1516 (1997).
- Verzelen et al. (2002) O. Verzelen, R. Ferreira, and G. Bastard, Phys. Rev. Lett. 88, 146803 (2002).
- Takagahara (1996) T. Takagahara, Journal of Luminescence 70, 129 (1996).
- Krauss and Wise (1997) T. D. Krauss and F. W. Wise, Physical Review Letters 79, 5102 (1997).
- Spann et al. (2013) B. T. Spann, L. Chen, X. Ruan, and X. Xu, Optics express 21 Suppl 1, A15 (2013).
- Blais et al. (2004) A. Blais, R. S. Huang, A. Wallraff, S. M. Girvin, and R. J. Schoelkopf, Physical Review A - Atomic, Molecular, and Optical Physics 69, 062320 (2004).
- Madsen and Lodahl (2013) K. H. Madsen and P. Lodahl, New Journal of Physics 15 (2013).
- Scully and Zubairy (1997) M. O. Scully and M. S. Zubairy, Quantum Optics (Cambridge University Press, Cambridge, England, 1997).
- Masia et al. (2012) F. Masia, N. Accanto, W. Langbein, and P. Borri, Physical Review Letters 108, 087401 (2012).
- Bron (2013) W. E. Bron, Nonequilibrium phonon dynamics, Vol. 124 (Springer Science & Business Media, 2013).
- Empedocles and Bawendi (1999) S. A. Empedocles and M. G. Bawendi, The Journal of Physical Chemistry B 103, 1826 (1999).
- Blanton et al. (1996) S. A. Blanton, M. A. Hines, P. Guyotsionnest, S. A. Blanton, M. A. Hines, and P. Guyot-sionnest, Applied Physics Letters 69, 3905 (1996).
- Neuhauser et al. (2000) R. G. Neuhauser, K. T. Shimizu, W. K. Woo, S. A. Empedocles, and M. G. Bawendi, Physical Review Letters 85, 3301 (2000).
- Palinginis et al. (2003) P. Palinginis, S. Tavenner, M. Lonergan, and H. Wang, Physical Review B 67, 201307 (2003).
- Sallen et al. (2010) G. Sallen, A. Tribu, T. Aichele, R. Andre, L. Besombes, C. Bougerol, M. Richard, S. Tatarenko, K. Kheng, J.-P. P. Poizat, R. André, L. Besombes, C. Bougerol, M. Richard, S. Tatarenko, K. Kheng, and J.-P. P. Poizat, Nature Photon. 4, 696 (2010), 1207.0676 [physics.optics] .
- Cohen-Tannoudji and Reynaud (1977) C. Cohen-Tannoudji and S. Reynaud, Journal of Physics B: Atomic and Molecular Physics 10, 2311 (1977).
- Carmichael and Walls (1973) H. J. Carmichael and D. F. Walls, Journal of Physics A: Mathematical, Nuclear and General 6, 1552 (1973).
- del Pino et al. (2015) J. del Pino, J. Feist, and F. J. Garcia-Vidal, New Journal of Physics 17, 053040 (2015).
- Walls and Milburn (2007) D. F. Walls and G. J. Milburn, Quantum Optics (Springer, 2007).
- Majumdar et al. (2011) A. Majumdar, E. D. Kim, Y. Gong, M. Bajcsy, and J. Vuˇ, Phys. Rev. B 84, 1 (2011).