Superconductivity of monolayer Mo2C: the key role of functional groups
Abstract
Monolayer Mo2C is a new member of two-dimensional materials. Here the electronic structure and lattice dynamics of monolayer Mo2C are calculated. According to the electron-phonon interaction, it is predicted that monolayer Mo2C could be a quasi-two-dimensional superconductor and the effects of functional-groups are crucially important considering its unsaturated surface. Despite the suppressed superconductivity by chalcogen adsorption, our most interesting prediction is that the electron-phonon interaction of monolayer Mo2C can be greatly enhanced by bromine absorbtion, suggesting that Mo2CBr2 as a good candidate for nanoscale superconductor.
I Introduction
Two-dimensional (2D) graphene-like carbides and carbonitrides (MXenes, e.g. Ti2C and Nb2C) have attracted enormous interest for their novel chemical and physical properties, since they were successfully produced by etching the A layers of MAX phase (M is an early transition metal, A is an element from group IIIA or IVA, and X is carbon or nitrogen) Naguib et al. (2011, 2012, 2013). Due to the unsaturated surface with unpaired electrons, the surfaces of MXenes always easily adsorb various functional groups (e.g. F, O, or/and OH group) during etching, thus the chemical and physical properties are varying with various adsorptions. For this reason, MXenes and their functionalized ones have been widely investigated regarding the magnetism, electronic structures, as well as catalytic properties and energy storage Lukatskaya et al. (2013); Zhao et al. (2014); Khazaei et al. (2013); Ghidiu et al. (2014); Sun et al. (2016).
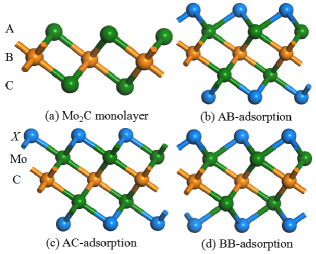
Recently, 2D layered Mo2C as a new member of MXenes was formed from Mo2Ga2C thin films. The metallic nature of Mo-Ga bond is weaker than Mo-C bond which has a mixed covalent/metallic/ionic character, thus monolayer Mo2C can be produced by selectively etching Ga layer Meshkian et al. (2015). Structurally, monolayer Mo2C is constructed by the Mo-C-Mo sandwich, as shown in Fig. 1(a), which looks similar to 1T-MoS2. Khazaei et. al. studied the thermoelectrics properties of monolayer Mo2C, which was found to be a promising candidate as a high-performance thermoelectric material Khazaei et al. (2014). In addition, the structural, electrical, thermal and mechanical properties of monolayer Mo2C were also studied Zha et al. (2016).
Superconductivity in ultrathin films owns promising future for applications, e.g. superconducting computational devices, thus great efforts have been made to discover 2D superconductors Ge et al. (2015); Zhang et al. (2016); Zhang and Dong (2016). Considering that monolayer Mo2C is non-magnetic and appears strong metallicity (according to first-principles study) Khazaei et al. (2014), it brings the opportunity to be an ultrathin superconductor. However, although the superconductivity was discovered in bulk -Mo2C (an allotrope of 2D layered Mo2C), its superconducting transition temperature () was depressed from K (thick film) to near K when its thickness is less than nm Xu et al. (2015); Kolel-Veetil et al. (2007). Moreover, analogous to other members of MXenes, the surfaces of monolayer Mo2C are easily covered by functional groups, and Khazaei et. al. indicates the full adsorption of functional groups is more stable than the cases of partial adsorption Xie and Kent (2013). For multilayer Mo2C MXenes, they (stacking like MoS2) seem to be impossible due to its unsaturated surfaces. In experiments, the possible stackings are -Mo2C-Mo2C- and Mo-C-Mo-C-Mo. For the former, the effects of functional groups are unavoidable. For the latter, the stoichiometry has changed. These facts motive us to investigate the superconductivity of pure Mo2C monolayer and those with various functional groups.
In this work, the lattice dynamics and electron-phonon coupling (EPC) of monolayer Mo2C and functionalized ones have been studied via first-principles density functional theory (DFT) and density function perturbation theory (DFPT). Our calculations find that the strong EPC in monolayer Mo2C may lead to superconductivity, while the oxidation would make its superconductivity disappear. Besides, the superconducting is also obviously suppressed by absorbtion of sulfur or selenium. In contrast, the EPC of monolayer Mo2C can be greatly enhanced by bromine absorbtion, leading to a predicted up to K.
II Model & methods
The electronic structure calculations have been performed using the Vienna ab initio simulation package (VASP) with projector augmented wave method Kresse and Furthmüller (1996); Kresse and Joubert (1999). Generalized gradient approximation of Perdew-Burke-Ernzerhof (GGA-PBE) are used with a cutoff energy eV. The spin-orbit coupling (SOC) is also included in electronic structure calculations. The phonon dispersion calculations are carried out using ultrasoft pseudo-potential (including the semicore electrons as valence electrons in case of Mo) as implemented in PWSCF program of the Quantum-ESPRESSO distribution, which are calculated within the framework of DFPT Giannozzi et al. (2009). In the DFPT calculation, GGA-PBE formulation is also used with a cutoff energy Ry for the expansion of the electronic wave function in the plane waves, whereas cutoff energy for charge density and potential is set to be Ry. Structure optimization and electronic structure are repeated by using PWSCF and the results are consistent with those obtained using VASP.
The vacuum space of Å is intercalated into interlamination to eliminate the interaction between layers. A 2D grid uniform is applied for both the -points of the self-consistent and -points of dynamical matrices calculations.
The EPC calculation is estimated according to the Migdal-Eliashberg theory [], which is given by Grimvall (1981):
| (1) |
where is the electronic DOS at Fermi level, denotes phonon frequency of the th phonon mode with wave vector , and the phonon linewidth is defined by Allen and Dynes (1975); Allen (1972):
| (2) | |||||
where denote indices of energy bands, is volume of Brillouin zone, and are eigenvalues of Kohn-Sham orbitals at given bands and wave vectors. The is the EPC matrix element which can be determined self-consistently by the linear response theory, which describes the probability amplitude for scattering of an electron with a transfer of crystal momentum , is determined by Allen and Dynes (1975); Allen (1972):
| (3) |
where is the atomic mass, measures the change of self-consistent potential induced by atomic displacement, and are Kohn-Sham orbitals.
The EPC constant is obtained by summation over the first Brillouin zone or integration of the in the space Allen and Dynes (1975); Allen (1972):
| (4) |
where EPC constant for mode at wave vector is defined by the integration Allen and Dynes (1975); Allen (1972):
| (5) |
To obtain accurate electron-phonon interaction matrices, a dense grid is adopted for the EPC calculation.
III Results & discussion
III.1 Unfunctionalized monolayer Mo2C
The structure of unfunctionalized monolayer Mo2C is layered hexagonal with a space group of , and the stacking of the Mo-C-Mo is in the -type along the hexagonal axis (see Fig. 1(a)), which is similar to 1T-MoS2. Our optimized lattice constant ( Å) is consistent with the value reported by Khazaei et. al. Khazaei et al. (2014).
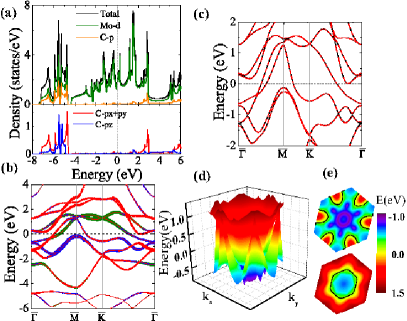
The calculated band structures and density of states (DOS) are shown in Fig. 2. As previously reported Khazaei et al. (2014), monolayer Mo2C indicates strong metallic behavior, and the Fermi surfaces are mainly contributed by Mo’s -orbits according to the projected DOS (Fig. 2(a)). The maximally localized Wannier functions (MLWFs) can partion Mo’s orbital and C’s orbital, as shown in Fig. 2(b). C’s orbital is mainly occupied on energy range from eV to eV and highly hybridize with Mo’s orbitals. The and orbitals are degenerate, which are higher in energy than the orbital, as shown in Fig. 2(a). The Mo’s -orbital are split due to crystalline field. Thus the has the lowest on-site energy, the rests are pairwise degenerate: ( and ) and ( and ), the later of which is sightly higher. The SOC can open the degeneracy at point (see Fig. 2(c)), while it has little effect on the Fermi surface. The crossing-Fermi-level bands and corresponding Fermi surfaces are shown in Fig. 2(d) and (e). The antibonding band (the upper one in Fig. 2(e)) forms the hole pocket Fermi surfaces around points, while the electron Fermi surface (the lower one in Fig. 2(e)) is the circular-shape around the point which is mainly contributed by and . Such double Fermi surfaces correspond to carriers with multiple effective masses, charges, and mobilities.
Then the phonon properties and electron-phonon coupling are calculated. The SOC is not included in these calculations, considering its negligible effects on the Fermi surfaces. For monolayer Mo2C, the Raman modes can be decomposed as at the zone center (see Fig. 3(a)), and the calculated Raman frequencies are cm-1 and cm-1 for the and modes respectively. Moreover, both Raman modes have strong coupling to electrons ( is for and for ) according to Eq. 5.
The calculated phonon dispersions along major high symmetry lines and phonon densities of states (PDOS, ()) for monolayer Mo2C are shown in Fig. 3(a). More dense -meshes ( and ) in self-consistent calculations are also tested. The maximum error of obtained phonon frequencies are less than 1%, implying the convergence of phonon calculation. In addition, the different methodology and pseudo-potential would lead to a few differences regarding the phonon band structures Zha et al. (2016); Sun et al. (2016). In fact, our phonon structure is very close to that in previous report Zha et al. (2016), although tiny differences remain unavoidable.
No imaginary frequency exists in the full phonon spectra, indicating the dynamical stability of monolayer Mo2C. Meanwhile, the phonon behavior exhibits several remarkable characteristics. First, near the zone center, both the LA and TA branches are near linear while the ZA branch (out-of-plane acoustical mode) is quadratic. These characters reflect the nature of 2D sheet. In detail, the ZA phonon in 2D materials like graphene has a quadratic dispersion over a wide range of the 2D Brillouin zone , where is a positive constant and is the 2D phonon wave vector. The similar conclusions are also found in monolayer black phosphorene Qin et al. (2015). Second, according to the partial PDOS (Fig. 3(b)), the vibrational modes of Mo dominate the low-frequency regime while those of C dominate the high-frequency regime, due to their large difference in mass. There is a large gap around cm-1, which partions the optical modes of Mo and C.
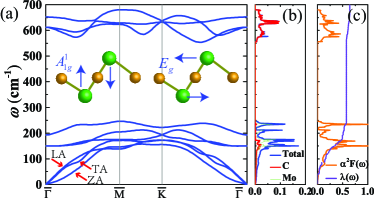
To discuss the superconductivity, the obtained and are also plotted in Fig. 3(c). Their similar shapes indicate that all make contributions to EPC. Due to the factor in the definition of (see Eq. 4), the contributions from low region is more prominent. Exactly, the calculated cm is which is beyond of the total EPC (), indicating that the phonon modes in the frequency region below cm-1 have the dominant contribution. In particular, three low-lying optical branches have strong coupling to electrons, which make contribution to EPC. Therefore, it is natural to expect the strong EPC in monolayer Mo2C to induce superconducting state. The can be estimated using the Allen-Dynes modified McMillan equation Allen and Dynes (1975):
| (6) |
where is the Coulomb repulsion parameter and is the logarithmically averaged frequency. When taking a typical value , the estimated is about K.
III.2 Functionalized monolayer Mo2C
In above study, it has been predict that pure monolayer Mo2C maybe a quasi-2D superconductor. However, in real situations, the functional group at surfaces of monolayer Mo2C are unavoidable considering its highly unsaturated surfaces. In fact, previous studies reported that monolayer Mo2C transforms from metal to semiconductor with F- and Cl-adsorption Khazaei et al. (2014), namely the F- and Cl-functionalized monolayer Mo2C could not be a superconductor. In the following, the changes of superconductivity by adsorbing various functional group will be studied, which may shed light to tuning the superconductivity of monolayer Mo2C in real experiments.
Due to the full adsorption is more stable than the partial case Khazaei et al. (2014), the Mo2C unit cell (u.c.) with two functional groups (one on each surface), i.e. Mo2C, is adopted in our calculation. Four functional atoms (=O, S, Se, and Br) are considered. Considering the symmetry, there are three mostly possible site-configuration for adsorption: AB-adsorption (Fig. 1(b)), AC-adsorption (Fig. 1(c)), BB-adsorption (Fig. 1(d)). For the AB-adsorption, one atom is right above C layer, while another is right below other side Mo. For the AC-adsorption, each atom is right above/below other side Mo layer. For the BB-configuration, both two atoms stand above/below the C site.
| AB | AC | BB | (Ref. Khazaei et al., 2014) | |||
|---|---|---|---|---|---|---|
| O | ||||||
| S | ||||||
| Se | ||||||
| Br |
The crystal structures are fully relaxed upon the absorptions, and the calculated lattice constant as well as total energy are listed in Table 1. Our calculations are in good agreement with previous reports Khazaei et al. (2014); Weng et al. (2015), and the BB-adsorption is the most favorable case for chalcogen, while Mo2CBr2 favors the AC-adsorption. The corresponding binding energy () is also calculated and also listed in Table 1. All binding energies are negative which indicate thermodynamic stability for all structures. And the value of binding energy decreases from Mo2CO2 to Mo2CBr2, implying the adsorption of oxygen should be quite possible, as observed in real experiment Meshkian et al. (2015). According to the Löowdin population analysis, the charge transfer from Mo to is about , , , and electron for O-, S-, Se-, and Br-adsorption, respectively. Stronger Coulomb attraction between and Mo ions can lead to larger binding energy.
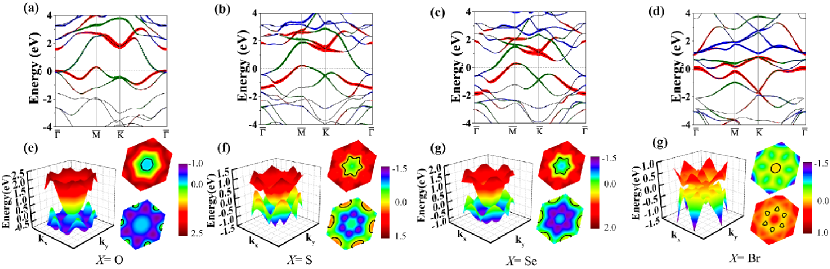
The electronic structures for Mo2C are calculated. Due to the unchanged symmetry of crystalline field, the splitting of Mo’s orbitals is similar to pristine monolayer Mo2C. Quantitatively, the absorption of further raises the energy of doubly-degenerate and due to the strong hybridization with the orbitals of . In details, the on-site energy difference between / and / is about , , , eV for the O-, S-, Se- and Br-adsorption respectively, according to the MLWFs calculation. The lower of / orbitals can be also evidenced in the band structures of Mo2C, as shown in Fig. 4(a-d). All band structures show metallic character after -absorption, different to previously studied F-/Cl-absorption. Similar to pristine monolayer Mo2C, / and of Mo still make dominant contributions around the Fermi level, although the contributions from / are reduced more or less, as shown in Fig. 4(a-d). The three-dimensional view of three bands as well as the Fermi surface of / and are shown in Fig. 4(e-h). For chalcogen, its band structure looks like that of pristine monolayer Mo2C, namely the upper cone-shape band is surrounded by lower flower-shape band, although the degree of surrounding is suppressed. Due to the different adsorption site and valence state of Br, the shapes of Fermi surfaces are significantly changed to sun-like patterns for Mo2CBr2.
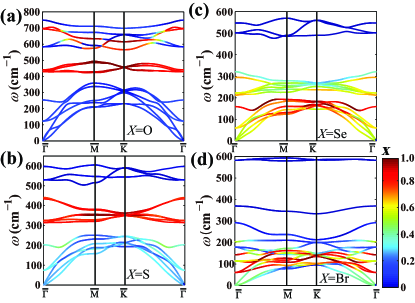
The calculated phonon dispersion along major high symmetry lines are shown in Fig. 5. No imaginary frequency exists in the full phonon spectra, indicating the dynamical stability of the Mo2C. Therefore, it is more likely that Mo2C is able to be obtained in real experiment considering its stability in thermodynamics and lattice dynamical. Obviously, the vibration modes of Mo2C are strongly coupled with the surface , as revealed by the phonon dispersion (Fig. 5). Different atom contribute to the phonon spectrum in different frequency range due to the inequivalent mass and bond strength. In particular, for Mo2CO2, the contributions from O mainly locate at the intermediate- and high-frequency regimes, indicating the fact of strong bond of Mo-O. In the case of Mo2CS2, the frequencies contributed by S mainly locate in the intermediate regime, while for Se and Br cases the contributions from is in the low frequency side.
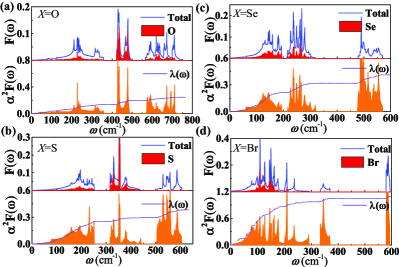
Our results for , () and PDOS of Mo2C are shown in Fig. 6. As in the monolayer Mo2C case, and () of Mo2C have similar peaks, indicating all vibration modes contribute to EPC. Comparing to pristine Mo2C, the strength of have been suppressed by O-, S- and Se-adsorption. And such suppression obviously exists in low frequency regime which have large contributions to EPC (because of the part in Eq. 4). The average EPC is also calculated using Eq. 4, as listed in Table 2. Corresponding is estimated from modified McMillan equation (Eq. 6) with (listed in Table 2). The results indicate that the superconductivity is greatly suppressed in Mo2CS2 and Mo2CSe2 and almost disappears in Mo2CO2, as a result of reduced electronic DOS’s at Fermi level and suppressed EPC’s.
| Mo2CO2 | Mo2CS2 | Mo2CSe2 | Mo2CBr2 | |
|---|---|---|---|---|
As shown in Fig. 6(d), strength of has been improved in Mo2CBr2, and the corresponding average EPC is about . The obtained cm is approximately beyond of the total EPC (), and estimated is up to K. To be exact, EPC of vibration modes ( and ) at point which have Raman activity have been improved for comparing to those of pristine monolayer Mo2C. In addition, the large values of EPC for acoustic modes at contribute substantially to the average EPC. Thus, the superconductive is pushed up in Mo2CBr2.
In addition, we had tried the full -OH cover up Mo2C surfaces. However, even after the atomic relaxation, an imaginary frequency of phonon appears at the point, implying unstable structure. Therefore, structural phase transition would appear which makes the problem more complicated. Thus, the decoration of OH group is beyond the current work and deserves individual studies in future.
IV Conclusion
We have analyzed the electronic properties, the lattice dynamical properties, and superconductivity of monolayer Mo2C and its functionalized ones. Our calculations have confirmed the strong EPC in monolayer Mo2C, which may lead to superconductivity below K. Even though, since the absorption of functional groups is unavoidable in real experiment, its superconductivity can be modified. Our calculation have found that for chalcogen functionalized monolayer Mo2C the superconductivity would be seriously suppressed (or even totally disappear). The most interesting prediction is that electron-phonon coupling can be greatly enhanced in monolayer Mo2C by bromine absorbtion, and thus its corresponding superconductive may be pushed up to K, suggesting that Mo2CBr2 may be a good candidate as nanoscale superconductor.
Acknowledgements.
Work was supported by the National Natural Science Foundation of China (Grant No. 11674055), the Fundamental Research Funds for the Central Universities, Jiangsu Innovation Projects for Graduate Student (Grant No. KYLX16 0116).References
- Naguib et al. (2011) M. Naguib, M. Kurtoglu, V. Presser, J. Lu, J. Niu, M. Heon, L. Hultman, Y. Gogotsi, and M. W. Barsoum, Adv. Mater. 23, 4248 (2011).
- Naguib et al. (2012) M. Naguib, O. Mashtalir, J. Carle, V. Presser, J. Lu, L. Hultman, Y. Gogotsi, and M. W. Barsoum, ACS nano 6, 1322 (2012).
- Naguib et al. (2013) M. Naguib, J. Halim, J. Lu, K. M. Cook, L. Hultman, Y. Gogotsi, and M. W. Barsoum, J. Am. Chem. Soc. 135, 15966 (2013).
- Lukatskaya et al. (2013) M. R. Lukatskaya, O. Mashtalir, C. E. Ren, Y. Dall’Agnese, P. Rozier, P. L. Taberna, M. Naguib, P. Simon, M. W. Barsoum, and Y. Gogotsi, Science 341, 1502 (2013).
- Zhao et al. (2014) S. Zhao, W. Kang, and J. Xue, Appl. Phys. Lett. 104, 133106 (2014).
- Khazaei et al. (2013) M. Khazaei, M. Arai, T. Sasaki, C.-Y. Chung, N. S. Venkataramanan, M. Estili, Y. Sakka, and Y. Kawazoe, Adv. Funct. Mater. 23, 2185 (2013).
- Ghidiu et al. (2014) M. Ghidiu, M. R. Lukatskaya, M.-Q. Zhao, Y. Gogotsi, and M. W. Barsoum, Nature 516, 78 (2014).
- Sun et al. (2016) W. Sun, Y. Li, B. Wang, X. Jiang, M. I. Katsnelson, P. Korzhavyi, O. Eriksson, and I. Di Marco, Nanoscale 8, 15753 (2016).
- Meshkian et al. (2015) R. Meshkian, L.-Å. Näslund, J. Halim, J. Lu, M. W. Barsoum, and J. Rosen, Scripta Mater. 108, 147 (2015).
- Khazaei et al. (2014) M. Khazaei, M. Arai, T. Sasaki, M. Estili, and Y. Sakka, Phys. Chem. Chem. Phys. 16, 7841 (2014).
- Zha et al. (2016) X.-H. Zha, J. Yin, Y. Zhou, Q. Huang, K. Luo, J. Lang, J. S. Francisco, J. He, and S. Du, J. Phys. Chem. C 120, 15082 (2016).
- Ge et al. (2015) J.-F. Ge, Z.-L. Liu, C. Liu, C.-L. Gao, D. Qian, Q.-K. Xue, Y. Liu, and J.-F. Jia, Nature Mater. 14, 285 (2015).
- Zhang et al. (2016) J.-J. Zhang, B. Gao, and S. Dong, Phys. Rev. B 93, 155430 (2016).
- Zhang and Dong (2016) J.-J. Zhang and S. Dong, 2D Mater. 3, 035006 (2016).
- Xu et al. (2015) C. Xu, L. Wang, Z. Liu, L. Chen, J. Guo, N. Kang, X.-L. Ma, H.-M. Cheng, and W. Ren, Nature Mater. 14, 1135 (2015).
- Kolel-Veetil et al. (2007) M. K. Kolel-Veetil, S. B. Qadri, M. Osofsky, T. M. Keller, R. Goswami, and S. A. Wolf, J. Phys. Chem. C 111, 16878 (2007).
- Xie and Kent (2013) Y. Xie and P. R. C. Kent, Phys. Rev. B 87, 235441 (2013).
- Kresse and Furthmüller (1996) G. Kresse and J. Furthmüller, Phys. Rev. B 54, 11169 (1996).
- Kresse and Joubert (1999) G. Kresse and D. Joubert, Phys. Rev. B 59, 1758 (1999).
- Giannozzi et al. (2009) P. Giannozzi, S. Baroni, N. Bonini, M. Calandra, R. Car, C. Cavazzoni, D. Ceresoli, G. L. Chiarotti, M. Cococcioni, and I. D. et al., J. Phys.: Condens. Matter 21, 395502 (2009).
- Grimvall (1981) G. Grimvall, The electron-phonon interaction in metals, Vol. 8 (North-Holland Amsterdam, 1981).
- Allen and Dynes (1975) P. B. Allen and R. C. Dynes, Phys. Rev. B 12, 905 (1975).
- Allen (1972) P. Allen, Phys. Rev. B 6, 2577 (1972).
- Qin et al. (2015) G. Qin, Q.-B. Yan, Z. Qin, S.-Y. Yue, M. Hu, and G. Su, Phys. Chem. Chem. Phys. 17, 4854 (2015).
- Weng et al. (2015) H. Weng, A. Ranjbar, Y. Liang, Z. Song, M. Khazaei, S. Yunoki, M. Arai, Y. Kawazoe, Z. Fang, and X. Dai, Phys. Rev. B 92, 075436 (2015).