Possible Quasi-Periodic modulation in the z = 1.1 -ray blazar PKS 0426-380
Abstract
We search for -ray and optical periodic modulations in a distant flat spectrum radio quasar (FSRQ) PKS 0426-380 (the redshift ). Using two techniques (i.e., the maximum likelihood optimization and the exposure-weighted aperture photometry), we obtain -ray light curves from Fermi-LAT Pass 8 data covering from 2008 August to 2016 December. We then analyze the light curves with the Lomb-Scargle Periodogram (LSP) and the Weighted Wavelet Z-transform (WWZ). A -ray quasi-periodicity with a period of 3.35 0.68 years is found at the significance-level of . The optical-UV flux covering from 2005 August to 2013 April provided by ASI SCIENCE DATA CENTER is also analyzed, but no significant quasi-periodicity is found. It should be pointed out that the result of the optical-UV data could be tentative because of the incomplete of the data. Further long-term multiwavelength monitoring of this FSRQ is needed to confirm its quasi-periodicity.
Subject headings:
Galaxies: jets - gamma rays: galaxies - radiation mechanisms: non-thermal1. INTRODUCTION
Blazar is one type of active galactic nucleus (AGNs) who aim their jets almost directly at Earth. Blazar emission is generally dominated by non-thermal radiation over all frequencies ranging from radio to TeV rays. The typical multi-wavelength spectral energy distribution (SED) of a blazar is characterized by two distinct bumps. It is generally accepted that the first bump peaking in infrared to X-ray frequencies is synchrotron emission from relativistic electrons in the jet. The second bump peaking in MeV to GeV band could be produced via inverse Compton (IC) scattering of synchrotron photons (i.e., synchrotron-self Compton: SSC; e.g., Maraschi et al., 1992; Tavecchio et al., 1998; Finke et al., 2008; Yan et al., 2014) and external photons (i.e., external Compton: EC; e.g., Dermer & Schlickeiser, 1993; Sikora et al., 1994; Kang et al., 2014) by the same population of relativistic electrons that produce the synchrotron emission.
According to the emission lines’ features, blazars are classified as BL Lacertae objects (BL Lacs; having weak or no emission lines) and flat spectrum radio quasars (FSRQs; having strong emission lines). FSRQs are usually the low synchrotron-peaked blazars (i.e., the synchrotron peak frequency Hz). There exist low, intermediate, and high synchrotron-peaked BL Lacs (LBLs, IBLs, and HBLs, respectively, defined by whether Hz, , or Hz) (Abdo et al., 2010). rays from HBLs can be produced by SSC, while rays from FSRQs are usually attributed to EC. It is very likely that the jet properties of LBLs are similar to that of FSRQs.
By modeling blazar spectra, emission mechanisms and physical properties of the relativistic jets can be determined (e.g., Ghisellini et al., 2014; Zhang et al., 2012). Besides, the information of violent variation including variability timescale and profile of light curve also put constraints on the jet properties of blazars. Although it seems that blazar variability is usually aperiodic, many efforts have been still made to search for the periodic variabilities in blazars (e.g., Kidger et al., 1992; Bai et al., 1998, 1999; Fan & Lin, 2000; Xie et al., 2008; Li et al., 2009; King et al., 2013; Urry, 2011; Gupta, 2014). Naturally, these studies mainly focus on radio and optical-UV band because of the abundant data.
Quasi-periodic oscillations (QPO) have been detected in the X-ray radiation of black hole X-ray binaries (BHXBs) (Remillard et al., 2002). The X-ray QPOs were found to have two types, low-frequency QPOs and high-frequency QPOs (Remillard & McClintock, 2006), which are thought to originate in the inner accretion disk of a black hole. Remillard & McClintock (2006) suggested an inverse linear relation between QPO frequency and black hole mass. Recently Pan et al. (2016) and Zhang, Zhang & Liao et al. (2017) analyzed the X-ray data of a narrow-line Seyfert 1 galaxy 1H 0707-495, and found a possible QPO. The QPO in 1H 0707-495 follows the QPO frequency BH mass relation suggested by Remillard & McClintock (2006). It is interesting that this relation spans from stellar-mass to supermassive BHs. It may indicate that accretion onto a stellar-mass black hole is comparable to accretion onto a supermassive black hole.
In this work we focus on QPOs in blazars. It should be pointed out that blazar emission is dominated by non-thermal radiation from jet, and the X-ray QPOs mentioned above were found in thermal radiation from accretion disk. Some possible QPO signals were found in radio, optical and X-ray bands. The period has two types, the short term of several tens days and the long term of several years (e.g., Rieger, 2007). QPOs in blazars may give us more insights into the physics of blazars.
Thanks to the Large Area Telescope (LAT) onboard the Fermi Gamma-ray Space Telescope (Abdo et al., 2009), running in an all-sky coverage monitoring every 3 hours (Atwood et al., 2009; Abdo et al., 2009), we have a long-term view of the variability of a large sample of -ray blazars. Fermi-LAT has been collecting data for over eight years, allowing us to search for quasi-periodic variability with a timescale of a few years in gamma-ray flux (e.g., Ackermann et al., 2015; Sandrinelli et al., 2014; Sandrinelli, Covino, & Treves, 2016; Zhang, Yan & Liao et al., 2017).
So far, three blazars (PG 1553+113, PKS 2155-304 and PKS 0537-441) have been reported having quasi-periodic variability in gamma-ray fluxes with the significance of (Ackermann et al., 2015; Sandrinelli et al., 2014; Sandrinelli, Covino, & Treves, 2016; Zhang, Yan & Liao et al., 2017). In particular, Zhang, Yan & Liao et al. (2017) reported a -ray quasi-periodic variability in PKS 2155-304 with a significance of 4.9 . The three blazars are HBLs. HBL usually has ”clean” environment around the jet, and the rays are produced by SSC. It is interesting to search for quasi-periodic variabilities in other subclasses of blazars, e.g., FSRQs.
In this work we analyze the gamma-ray data from the distant FSRQ PKS 0426-380 in the interval between 2008 August and 2016 December. We find a significant quasi-periodicity in the -ray flux. The significance of the 3.35 0.68 years period is . This paper is organized as follows: we describe Fermi-LAT data analysis procedures in Section 2; in Section 3 we show results; summaries and discussions are given in Section 4.
2. Observations and Data reduction
The blazar PKS 0426-380 is classified as a FSRQ (Healey et al., 2007; Ghisellini et al., 2011; Sbarrato et al., 2012). PKS 0426-380 has broad lines visible in the low emission state (Sbarufatti et al., 2005). PKS 0426-380 has a large -ray luminosity (i.e. ) and a large ratio between the broad-line region (BLR) luminosity and the Eddington luminosity (i.e. ) (Ghisellini et al., 2011). PKS 0426-380 is a distant blazar with the redshift (Heidt, 2004; Sbarufatti et al., 2005).
The public -ray data of PKS 0426-380 are obtained from the observations of the LAT. Fermi-LAT is an electron-positron pair production detection sensitive to photon energies from 20 MeV to 300 GeV111https://fermi.gsfc.nasa.gov/science/instruments/table1-1.html. The LAT has a largest effective area at 1 GeV, a field of view 2.4 sr, and a point spread function above 1 GeV.
The data are selected between 2008 August 4 and 2016 December 15 (MJD 54682.66-57737.66) with the energy range from 100 MeV to 500 GeV. The LAT data analysis employ the Fermi Science Tools version v10r0p5 package. We follow the standard procedure provided in Fermi Science Support Center (FSSC) 222http://fermi.gsfc.nasa.gov/ssc/data/analysis/scitools/, to reduce the data. We select the events in a circular region of interest (ROI) of 15∘ radius centered on the position of PKS 0426-380. To minimize the contamination of rays from the Earth limb, we exclude the events with zenith angle . The diffuse -ray emission of the Galactic and extra-galactic are modeled using the two files: gll_iem_v06.fit and iso_P8R2_SOURCE_V6_v06.txt. We run the Science Tools gtmktime to select the good time intervals. The SOURCE class of photon-like events of the new Pass 8 data (Atwood et al., 2013) is used with the instrument response functions (IRFs) P8R2_SOURCE_V6.
A binned maximum likelihood algorithm implemented in gtlike is applied between the model file and the events of observation. The data from a square ROI are divided into a spatial pixel size of . In energy dimensionality, they are binned into 30 logarithmically equal bins. We use the script make3FGLxml.py to generate the model file 333http://fermi.gsfc.nasa.gov/ssc/data/analysis/user/. The file is composed of the information (the parameters of spectrum and the spatial positions) of all known 3FGL sources (Acero et al., 2015). We employ gtlike to drive the best-fitting results including flux, photon index, and test statistic (TS) value. The TS is defined as , where and are respectively the maximum likelihood value of the model with and without the source, and it describes the significance of source. We save the best-fitting results into a new model file. The following analysis of light curves are base on this new model file. The results in this paper are only given with statistical errors.
3. Results
3.1. -ray light curves
Fermi-LAT collaboration provides two techniques to generate light curves, i.e. the maximum likelihood optimization and the exposure-weighted aperture photometry (Corbet et al., 2007; Kerr, 2011).
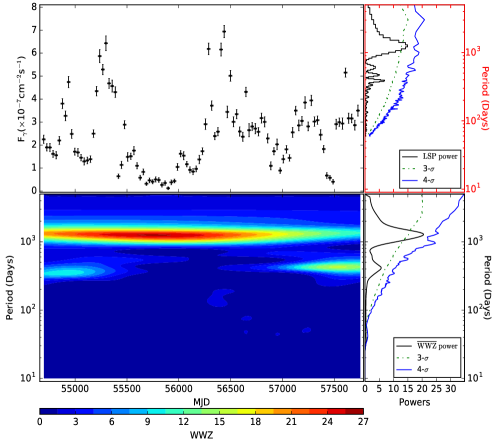
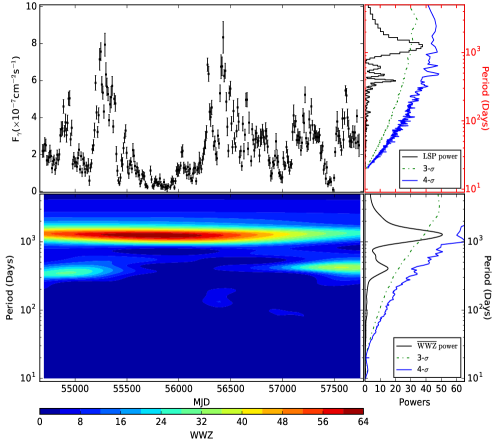
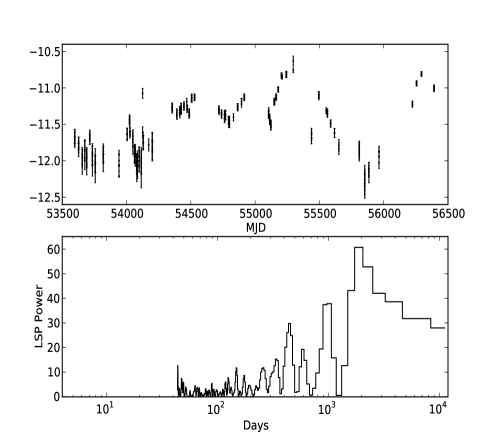
In the analysis with the maximum likelihood optimization, the light curves are first built by using a one-month bin. We employ a unbinned maximum likelihood fitting technique and run the ScienceTools gtlike to obtain the flux and TS value for each time bin. In this step, the events are selected in a circular ROI of 15∘ radius centered on the coordinate of the target. The model is the same as the new model file mentioned in Section 2, except the parameters of the spectrum shape are frozen. The light curve is shown in Fig. 1. To test the impacts of different time bins on the results, we also build the light curve with a 10-day bin over 0.1 GeV (Fig. 2).
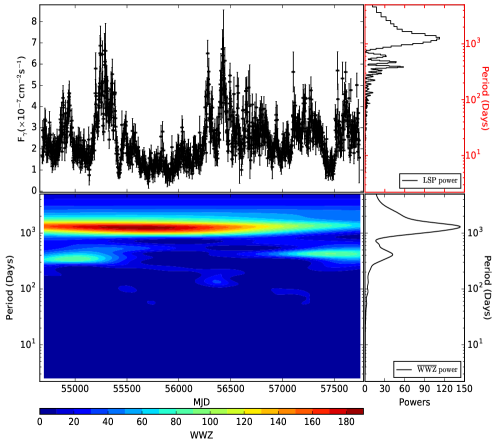
In the analysis with the exposure-weighted aperture photometry, we generate light curve with a modified version of aperture photometry. We exclude the events during the period when the target is within 5∘ of the Sun. The probability of each photon from a specific source is calculated by the ScienceTools gtpsrcrob with the best-fitting model and IRFs P8R2_SOURCE_V6. Then we sum the probability of the events within 3∘ radius circle region centered on the position of PKS 0426-380 over 100 MeV. The 2.5-day bin is used. Then the exposure of each time bin is determined with the ScienceTools gtexposure. The light curve weighted by the exposure of each time bin is shown in Fig. 3.
3.2. Searching for -ray quasi-periodic modulation
The Lomb-Scargle Periodogram (Lomb, 1976; Scarle, 1982) is a widely used tool for searching for period of variability. However, this method does not take into account the fluctuations of periodic signal with time. Therefore, we also use the WWZ technique with a Morlet mother function (Foster, 1996) for testing the result of LSP. In Figs. 1-3 we also show the corresponding LSP and WWZ powers. All the powers show a obvious peak at 1222 days (i.e., 3.35 0.68 years). The uncertainty of the signal is evaluated based on the half width at half maximum (HWHM) of the Gaussian fitting at the position of the power peak. We first apply a simple method for testing the significance of peaks in the periodogram of red noise data (Vaughan, 2005) to all the highest power-peaks in Figs. 1-3, and derive a similar significance of . For obtaining the precise significance of the signal, we should simulate light curves based on the obtained best-fitting result of power spectral density (PSD) and the probability density function (PDF) of observed variation (e.g., Zhang, Yan & Liao et al., 2017). The details of the simulation and significance estimation are provided by Emmanoulopoulos et al. (2013), Ackermann et al. (2015) and Bhatta et al. (2016). Following the procedure, we simulate light curves with the DELCgen program, and then we evaluate the significance of the signal. The significance of the signal is .
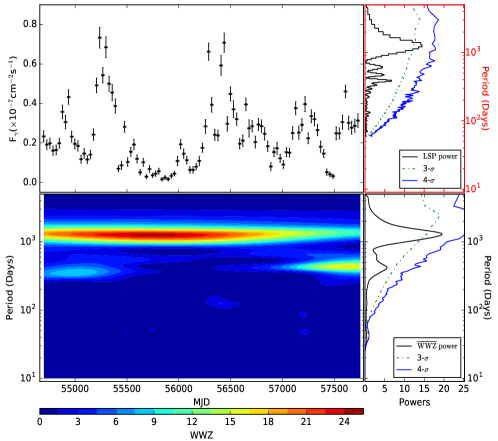
Photons above 100 GeV from PKS 0426-380 are found in our analysis (also see Tanaka et al., 2013). In order to avoid the effect of the absorption by extragalactic background light (EBL), We build the light curves in the energy range of 1-50 GeV (Fig. 4). Again we find a strong signal near the period of 1222 days in the corresponding LSP and WWZ powers.
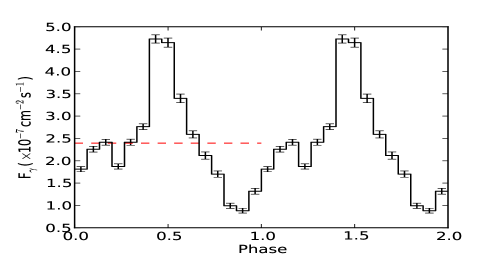
Using phase-resolved likelihood analysis method, we fold the gamma-ray photons from the 20 square region centered on the position of the target. We calculate a phase for every event in the region according to the period and the arrival time (with phase zero corresponding to MJD 54682.66). The pulse interval is divided into 15 segments. For each segment, we use a binned likelihood technique to obtain the flux with the same model file as generating light curve. The folded light curve is shown in Fig. 5. We fit the folded light curve with a constant flux, and derive the reduced . The null hypothesis that the phase-resolved light curve is steady can be rejected at a far exceeding 5- confidence-level. The folded light curve in Fig. 5 also confirms the signal mentioned above, and indicates that the gamma-ray flux varies with phase.
3.3. Searching for optical-UV quasi-periodic modulation
We have tried to collect long-term multiwavelength archive data of PKS 0426-380. We obtain the optical-UV data covering from 2005 August to 2013 April provided by ASI SCIENCE DATA CENTER (see Fig. 6). The optical-UV flux is analyzed using the same techniques as for the -ray flux but does not show any significant periodic signal.
4. SUMMARY AND DISCUSSION
We have produced the -ray light curves of a distant FSRQ PKS 0426-380 with the latest LAT data. We have found a significant quasi-periodic variability in the -ray flux with a period of 3.35 0.68 years and a significance of . More multiwavelength data are needed to confirm the periodicity in PKS 0426-380. If the -ray quasi-periodic variability is true, the next -ray flux peak will occur in 2019.
The archive optical-UV data covering from 2005 August to 2013 April have been also analyzed but no quasi-periodic signal is found. This may be due to the incomplete of the data. On the other band, optical-UV emission from FSRQs may be dominated by accretion disk photons. This complicates the confirmations of -ray quasi-periodic variability in FSRQs.
-ray quasi-periodic modulations with the significance of have been reported in HBLs (Ackermann et al., 2015; Sandrinelli et al., 2014; Sandrinelli, Covino, & Treves, 2016; Zhang, Yan & Liao et al., 2017). PKS 0426-380 is the first FSRQ having a significant -ray quasi-periodic variability. Although PKS 0426-380 has a longer observed period ( year) than the three HBLs ( year), the intrinsic periods () for PKS 0426-380 and the three HBLs are same because of . It is well known that FSRQs have larger black hole mass and higher accretion rate compared to HBLs (e.g., Ghisellini et al., 2011, 2014). It is interesting that FSRQs and HBLs have same period. It may indicate that the -ray quasi-periodic modulations in blazars are not solely linked to the central black hole and the accretion disk.
A possible interpretation for the -ray QPOs is a varying Doppler boosting for a periodically changing viewing angle, which is related to a helical jet (e.g, Rieger, 2004; Komossa & Zensus, 2016). The helical structure in radio jet of AGN has been detected (e.g, Rieger, 2007). One way to explain the helical jet is involving the presence of a binary supermassive black hole (SMBH) (e.g, Komossa & Zensus, 2016; Sobacchi et al., 2017). In the scenario of binary SMBH, one can estimate the parameters of the binary system, e.g., the separation between the two SMBHs (e.g., Sobacchi et al., 2017),
where is the mass ratio of the secondary SMBH to the primary SMBH. Assuming and using , we obtain pc. The two SMBHs will merge due to emission of gravitational waves. The time-scale for SMBHs merging is (e.g., Sobacchi et al., 2017),
Using and , we obtain yr.
It should be kept in mind that the binary SMBH scenario is not the unique explanation for the -ray QPOs. Alternative models, for instance disk oscillations or Kelvin-Helmholtz instabilities, have been proposed (see Komossa & Zensus, 2016, for a review). Nevertheless we suggest that a cumulative multifrequences blazar QPOs can be used to probe the underlying physical mechanism, and may also shed light on the questions of galaxies merger. Moreover, multifrequences QPOs may put new constraint on blazar emission models (Zhang, Yan & Liao et al., 2017).
ACKNOWLEDGEMENTS
We thank the referees for constructive suggestions that significantly improved the manuscript. Part of this work is based on archival data, software or online services provided by the ASI SCIENCE DATA CENTER (ASDC). We acknowledge the financial support from the 973 Program of China under grant 2013CB837000, the National Natural Science Foundation of China (NSFC-11573060 and NSFC-11573026), Key Laboratory of Astroparticle Physics of Yunnan Province (No. 2016DG006). The work of Dahai Yan is supported by CAS “Light of West China” Program.
Appendix A Autocorrelation analysis and -ray QPO in blazar
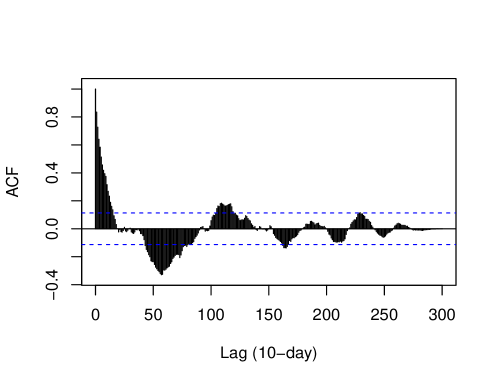
In addition to the methods based on Fourier analysis (e.g., LSP and WWZ), an autocorrelation analysis also has been used in light curve analysis to search for quasi-periodic behavior or variations with a characteristic timescale (e.g., Li et al., 2016). A regularly periodic light curve will have strong correlations at time lags that are multiples of the period. For an evenly spaced time series, the autocorrelation function (ACF) is the fraction of the total variance due to correlated values at time lags. We apply an autocorrelation analysis based on the algorithm of Box & Jenkins (1976) to the -ray data. We calculate the ACF with the parametric autoregressive integrated moving average (ARIMA) model (e.g., Hamilton, 1994; Chatfield, 2003). In Fig. 7, we show the ACF of the 10-day bin likelihood gamma-ray light curve. It can be seen that two positive correlation peaks appear respectively at the lag time of 1200 day and 2300 day. The result of autocorrelation analysis is consistent with the result of Fourier analysis.
References
- Abdo et al. (2009) Abdo, A. A. et al., 2009, Astropart. Phys., 32, 193
- Abdo et al. (2010) Abdo, A. A. et al., 2010, ApJ, 716, 30
- Acero et al. (2015) Acero, F., et al. 2015, ApJS, 218, 23
- Ackermann et al. (2015) Ackermann, M., Ajello, M., Albert, A., et al. 2015, ApJL, 813, L41
- Atwood et al. (2009) Atwood, W. B. et al., 2009, ApJ, 697, 1071
- Atwood et al. (2013) Atwood, W., Albert, A., Baldini, L., et al. 2013, in eConf C121028, p.8, (arXiv:1303.3514)
- Bai et al. (1998) Bai, J. M., Xie, G. Z., Li, K. H., Zhang, X., & Liu, W. W. 1998, A&AS, 132, 83
- Bai et al. (1999) Bai, J. M., Xie, G. Z., Li, K. H., Zhang, X., & Liu, W. W. 1999, A&AS, 136, 455
- Bhatta et al. (2016) Bhatta, G., Zola, S., Stawarz, Ł., et al. 2016, ApJ, 832, 47
- Box & Jenkins (1976) Box, G. E. P., & Jenkins, G. M. 1976, Holden-Day Series in Time Series Analysis (Revised ed.; San Francisco: Holden-Day), 21
- Chatfield (2003) Chatfield, C., The Analysis of Time Senes, 6th ed. Chapman & Hall, New York. 2003
- Conway & Murphy (1993) Conway, J. E., & Murphy, D. W. 1993, ApJ, 411, 89
- Corbet et al. (2007) Corbet, R. H. D., Markwardt, C. B., Tueller, J. 2007, ApJ, 655, 458
- Dermer & Schlickeiser (1993) Dermer, C. D., Schlickeiser, R., 1993, ApJ, 416, 458
- Emmanoulopoulos et al. (2013) Emmanoulopoulos D., McHardy I. M., Papadakis I. E., 2013, MNRAS, 433, 907
- Fan & Lin (2000) Fan, J. H., & Lin, R. G. 2000, A&A, 355, 880
- Finke et al. (2008) Finke, J. D., Dermer, C. D., Böttcher, M., 2008, ApJ, 686, 181
- Foster (1996) Foster, G., 1996, AJ, 112, 1709
- Ghisellini et al. (2011) Ghisellini, G., Tavecchio, F., Foschini, L., & Ghirlanda, G. 2011, MNRAS, 414, 2674
- Ghisellini et al. (2014) Ghisellini, G., Tavecchio, F., Maraschi, L., Celotti, A., Sbarrato, T., 2014, Nature, 515, 376
- Gupta (2014) Gupta A. C., 2014, Journal of Astrophysics and Astronomy, 35, 307
- Hamilton (1994) Hamilton, J. D., Time Series Analysis. Princeton University Press, Princeton, NJ. 1994
- Heidt (2004) Heidt, J., Tr¡§oller, M., Nilsson, K., et al. 2004, A&A, 418, 813
- Healey et al. (2007) Healey, S. E., Romani, R. W., Taylor, G. B., et al. 2007, ApJS, 171, 61
- Hyndman & Athanasopoulos (2014) Hyndman, J. & Athanasopoulos, G. Forecasting: Principles and Practice, 2014
- Kang et al. (2014) Kang, S. J., Chen, L., Wu, Q. W., 2014, ApJS, 215, 5
- Kerr (2011) Kerr, M. 2011, ApJ, 732, 38
- Kidger et al. (1992) Kidger, M., Takalo, L., & Sillanpaa, A. 1992, A&A, 264, 32
- King et al. (2013) King, O. G., Hovatta, T., Max-Moerbeck, W., et al. 2013, MNRAS, 436, L114
- Komossa & Zensus (2016) Komossa, S., & Zensus, J. A. 2016, Star Clusters and Black Holes in Galaxies across Cosmic Time, Proceedings IAU Symposium, 312, 13 (arXiv:1502.05720)
- Maraschi et al. (1992) Maraschi, L., Ghisellini, G., & Celotti, A. 1992, ApJ, 397, L5
- Li et al. (2009) Li, H. Z., Xie, G. Z., Chen, L. E., Dai, H., Lei, B. Y., Yi, T. F., Ren, J. Y., 2009, Publications of the Astronomical Society of Pacific, 121, 1172
- Li et al. (2016) Li, Y. R., Wang, J. M., Ho, L. C., et al., 2016, ApJ, 822, 4
- Lomb (1976) Lomb, N. R., 1976, Ap&SS 39, 447
- Pan et al. (2016) Pan, H. W., Yuan, W. M., Yao, S., et al., 2016, ApJL, 819, L19
- Remillard et al. (2002) Remillard, R. A., Muno, M. P., McClintock, J. E., & Orosz, J. A., 2002, ApJ, 580, 1030
- Remillard & McClintock (2006) Remillard, R. A., & McClintock, J. E. 2006, ARA&A, 44, 49
- Rieger (2007) Rieger, F. M., 2007, Ap&SS, 309, 271
- Rieger (2004) Rieger, F. M., 2004, ApJL, 615, L5
- Sandrinelli et al. (2014) Sandrinelli, A., Covino, S., & Treves, A., 2014, ApJL, 793, L1
- Sandrinelli, Covino, & Treves (2016) Sandrinelli A., Covino S., Treves A., 2016, ApJ, 820, 20S
- Sbarrato et al. (2012) Sbarrato, T., Ghisellini, G., Maraschi, L., & Colpi, M. 2012, MNRAS, 421, 1764
- Sbarufatti et al. (2005) Sbarufatti, B., Treves, A., Falomo, R., et al. 2005, AJ, 129, 55
- Scarle (1982) Scarle, J. D., 1982, ApJ, 263, 835
- Sikora et al. (1994) Sikora M., Begelman M. C., Rees M. J., 1994, ApJ, 421, 153
- Sobacchi et al. (2017) Sobacchi, E., Sormani, M., Stamerra, A., 2017, 2017, MNRAS, 465, 161S
- Tavecchio et al. (1998) Tavecchio F., Maraschi L., Ghisellini G., 1998, ApJ, 509, 608
- Tanaka et al. (2013) Tanaka, Y. T., Cheung, C. C., Inoue, Y. et al. 2013, ApJ, 777, 18
- Urry (2011) Urry M., 2011, Journal of Astrophysics and Astronomy, 32, 341
- Vaughan (2005) Vaughan, S., 2005, A&A, 431, 391
- Xie et al. (2008) Xie, G. Z., Yi, T. F., Li, H. Z., Zhou, S. B., & Chen, L. E. 2008, AJ, 135, 2212
- Yan et al. (2014) Yan, D. H., Zeng, H. D., Zhang, L., 2014, MNRAS, 439, 2933
- Zhang et al. (2012) Zhang, J., Liang, E. W., Zhang, S. N., Bai, J. M., 2012, ApJ, 752, 157
- Zhang, Zhang & Liao et al. (2017) Zhang, P. F., Zhang P., Liao, N. H., Yan, J. z., Fan, Y. Z., Liu, Q. Z., 2017, arXiv: 1703.17186
- Zhang, Yan & Liao et al. (2017) Zhang, P. F., Yan, D. H., Liao, N. H., Wang, J. C., 2017, ApJ, 835, 260