Adaptive optics in high-contrast imaging
Abstract
The development of adaptive optics (AO) played a major role in modern astronomy over the last three decades. By compensating for the atmospheric turbulence, these systems enable to reach the diffraction limit on large telescopes. In this review, we will focus on high contrast applications of adaptive optics, namely, imaging the close vicinity of bright stellar objects and revealing regions otherwise hidden within the turbulent halo of the atmosphere to look for objects with a contrast ratio lower than with respect to the central star. Such high-contrast AO-corrected observations have led to fundamental results in our current understanding of planetary formation and evolution as well as stellar evolution. AO systems equipped three generations of instruments, from the first pioneering experiments in the nineties, to the first wave of instruments on 8m-class telescopes in the years 2000, and finally to the extreme AO systems that have recently started operations. Along with high-contrast techniques, AO enables to reveal the circumstellar environment: massive protoplanetary disks featuring spiral arms, gaps or other asymetries hinting at on-going planet formation, young giant planets shining in thermal emission, or tenuous debris disks and micron-sized dust leftover from collisions in massive asteroid-belt analogs. After introducing the science case and technical requirements, we will review the architecture of standard and extreme AO systems, before presenting a few selected science highlights obtained with recent AO instruments.
1 Introduction
1.1 Science case
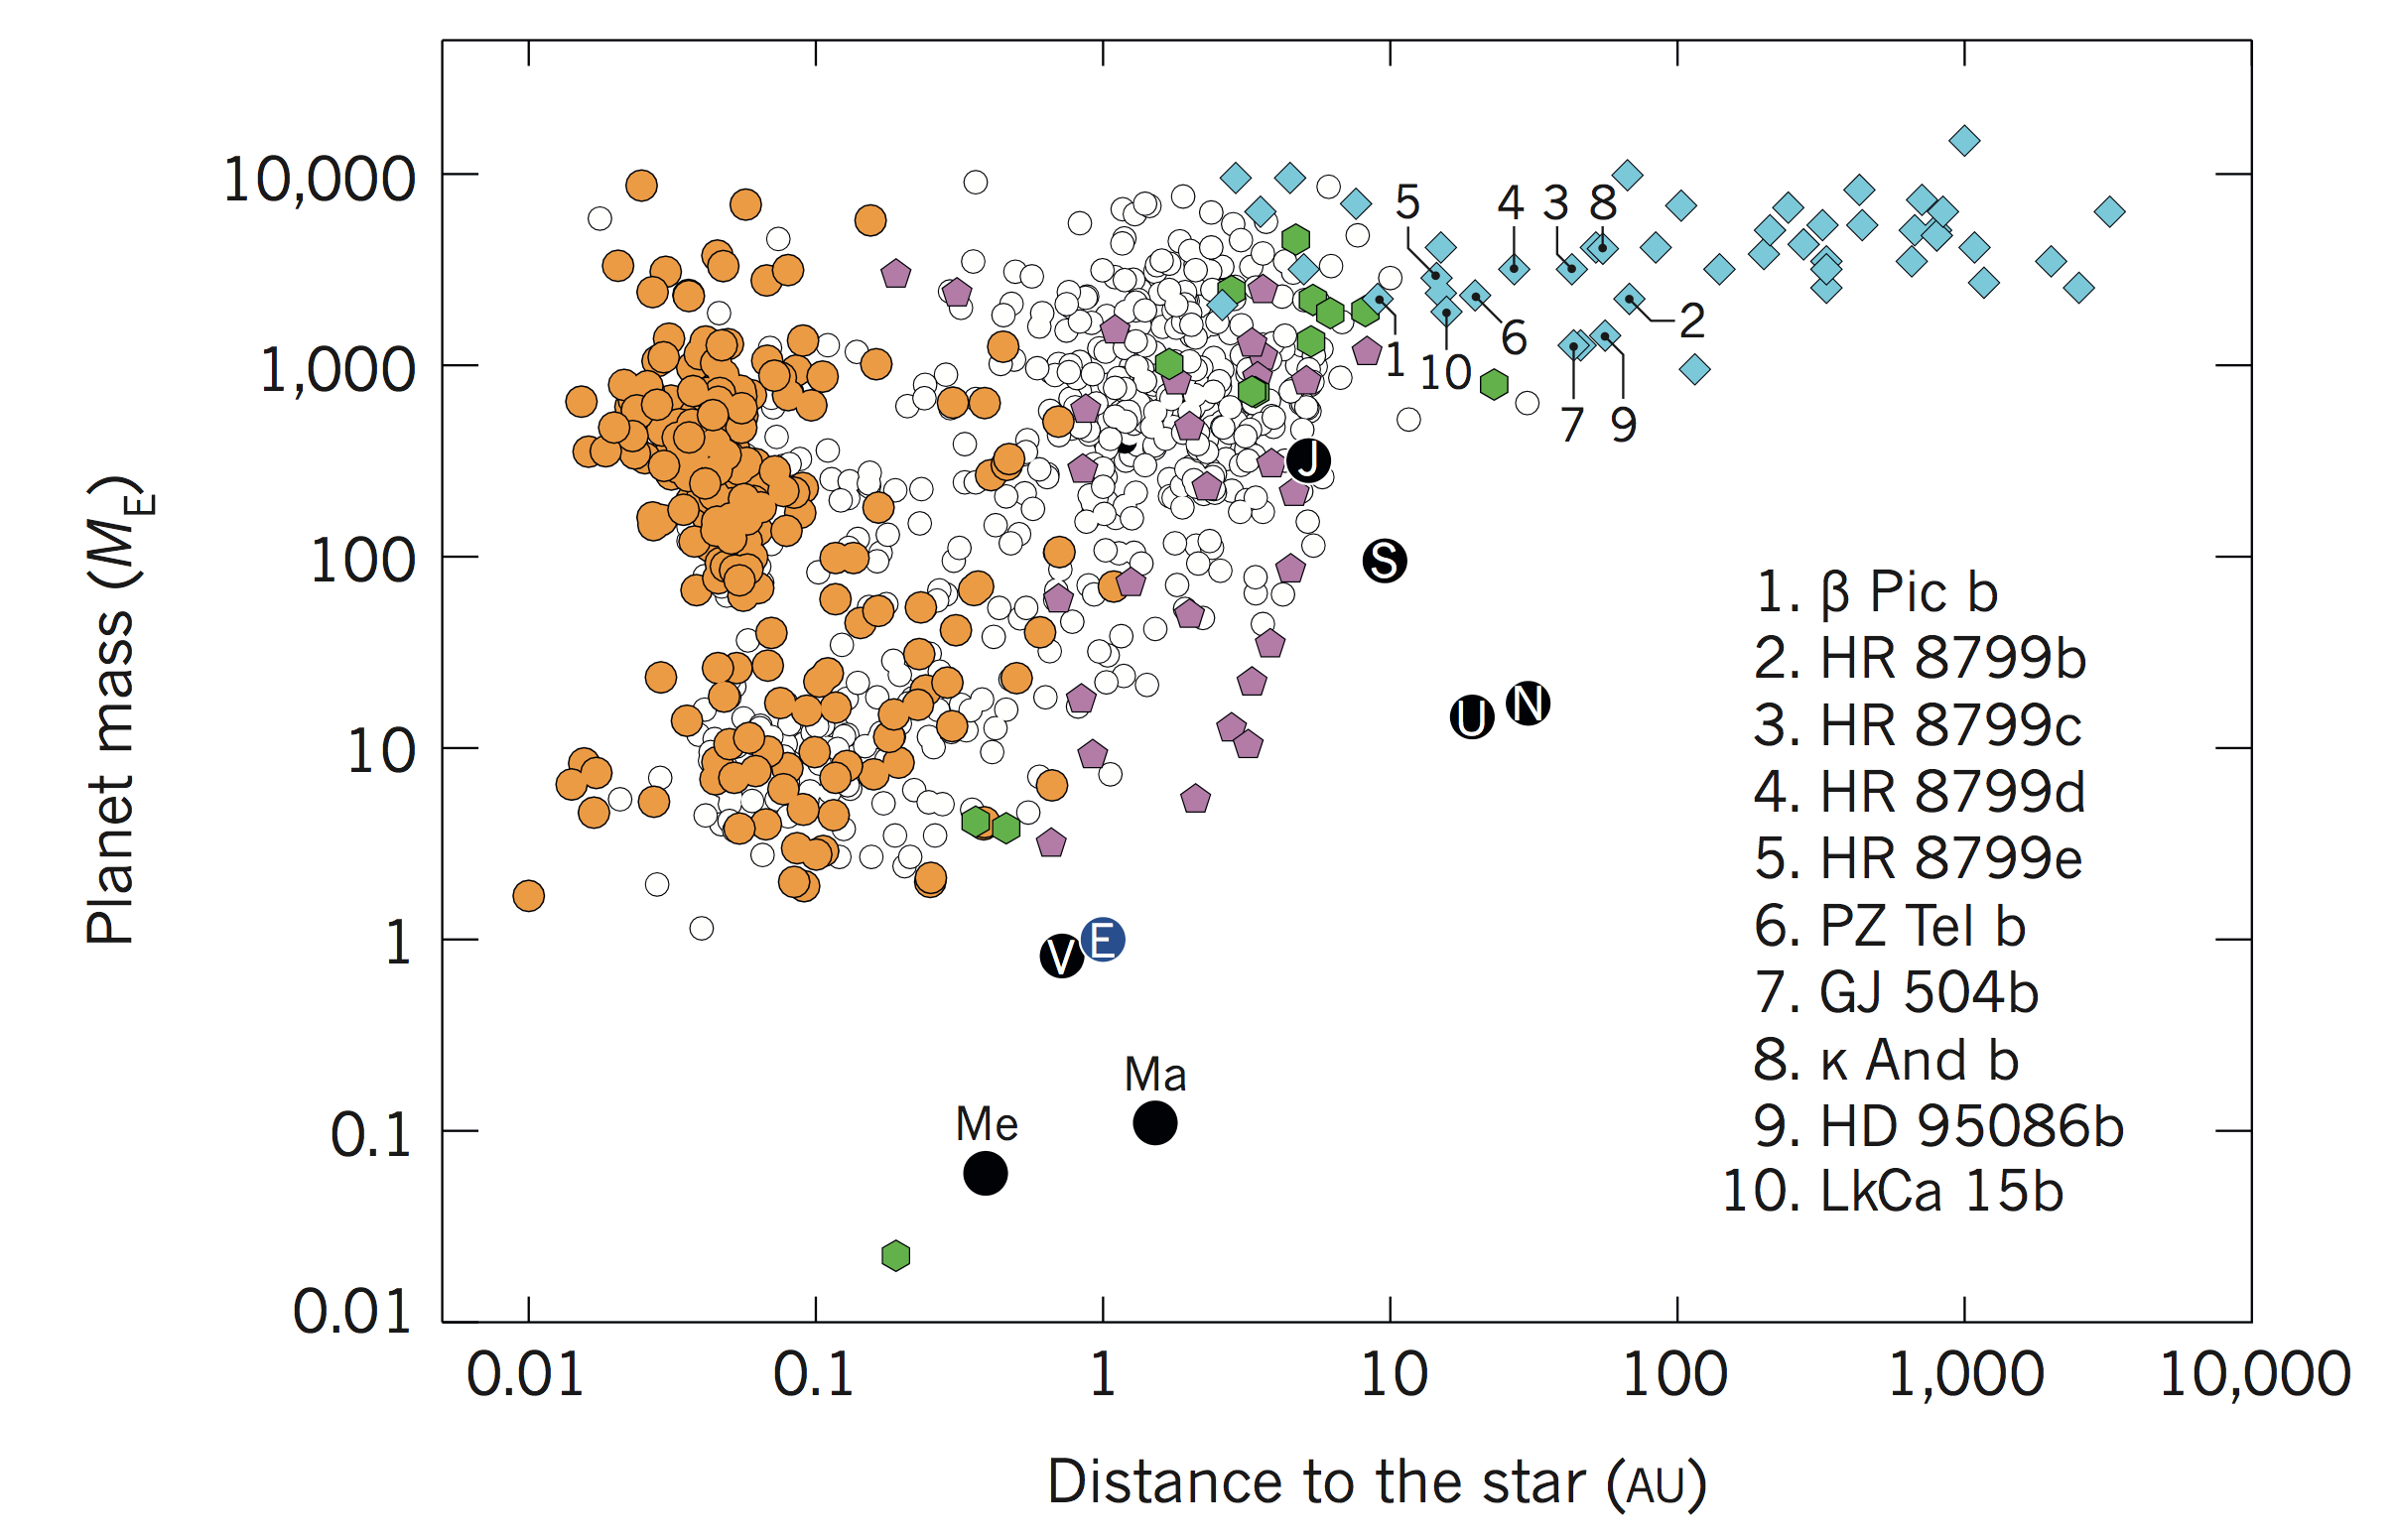
While most confirmed exoplanets were discovered by indirect techniques such as radial velocities or transits, AO-assisted direct imaging is a very rich and complementary method that can reveal the orbital motion of the planet, the spectro-photometry of its atmosphere but also the architecture and properties of its circumstellar environment. It can unveil possible interactions with a disc, whether a proto-planetary disc in case of on-going planetary accretion, or a debris disc for more evolved, gas-poor systems. From a statistical point of view, it probes a region, in the mass versus semi-major axis discovery space, different from other techniques, as illustrated in Fig. 1. Reaching a uniform sampling of such a parameter space is essential to derive the frequency of planets as a function of mass and semi-major axis, and therefore constrain the planet formation mechanisms. For instance, theories of planet formations predict a higher efficiency of giant planet formation close to the snow line, where radial velocity and transit techniques are poorly sensitive. They require additional ingredients such as migrations and orbital instabilities to explain the current view depicted in Fig. 1.
1.2 Requirements
Imaging extrasolar planets and discs requires dedicated instruments and strategies to overcome two main challenges:
-
1.
the tiny angular separation between the star and the planet or disc. The projected separation is below 0.1′′for a planet orbiting at 10 au from a star distant of 100pc.
-
2.
the contrast between a star and its planet ranges between for a young giant planet to for an Earth shining in reflected light. Discs are also very tenuous, with contrasts111For extended structures, the contrast is defined per resolution elements. ranging from for the brightest debris discs down to for a an analog of our zodiacal belt at 10pc Schneider2014_AFTA.
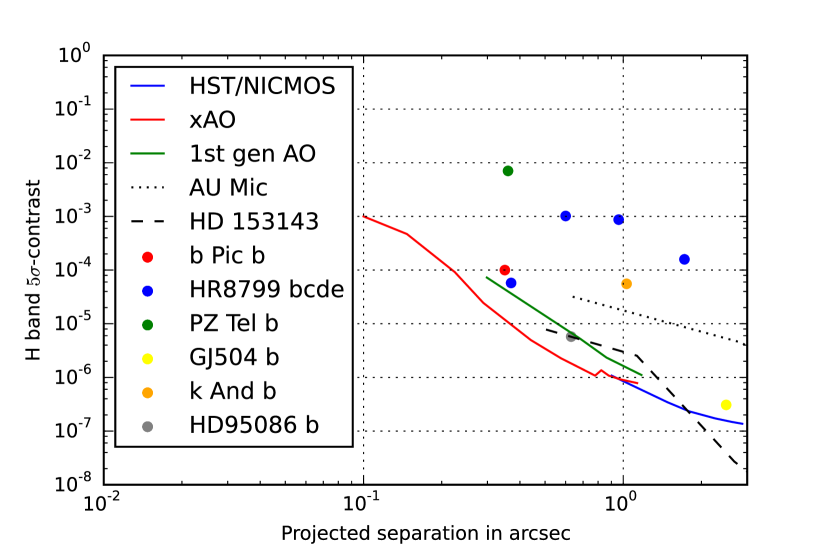
These two requirements are summarised in Fig. 2 that shows the separation and contrast of a few planets detected in direct imaging (dots), and two debris discs surface brightnesses (black lines). These two requirements are indissociable. From the ground, adaptive optics is one answer to the first requirement. Other techniques exist such as speckle imaging Labeyrie1970, lucky imaging Law2006, sparse aperture masking Baldwin1986, interferometry Lebouquin2012, but AO-assisted imaging is currently the only option to reach both the diffraction limit of the telescope and provide a contrast below at a few resolution elements. The size of a resolution element, e.g. the angular resolution, is given by the size of the telescope pupil. For of a circular aperture, the point-spread function (hereafter PSF) is an Airy function of full width at half maximum where D is the diameter of the telescope and the wavelength. The first three lines of Table 1.2 summarises the angular resolution of an 8m diffraction-limited telescope in the main optical and near-infrared filters. In the optical, this corresponds to the angular diameter of the more massive nearby stars.
| Band | V | R | I | J | H | Ks | Lp | |
|---|---|---|---|---|---|---|---|---|
| \svhline (m) | 0.55 | 0.65 | 0.82 | 1.22 | 1.63 | 2.2 | 3.8 | |
| Angular resolution (mas) | 14 | 17 | 21 | 31 | 42 | 57 | 98 | |
| First | Typical Strehla (%) | 5 | 19 | 40 | 73 | |||
| gen. | Typical contrastb at 0.5′′() | NA | NA | NA | 1.6 | 1.4 | 1.0 | 4.4 |
| AOa | Corresponding sensitivityc () | NA | NA | NA | 14/43 | 12/37 | 10/32 | 5/12 |
| xAOd | Typical Strehla (%) | 26 | 38 | 55 | 76 | 86 | 92 | 97 |
| Typical contraste at 0.5′′() | 5 | 4 | 3 | 1.7 | 1 | 0.5 | 0.2 | |
| Corresponding sensitivityc () | NA | NA | NA | 6/13 | 5/12 | 4/11 | 2/7 | |
a 40% Strehl was assumed at K band, and the Strehl scales as . b a contrast of was assumed at H band. The scaling in wavelength follows Eq. LABEL:eq_contrast_serabyn. c The two values refer respectively to a 10 and 100 Myr-old self-luminous planet, orbiting an A0V star. The luminosity to mass conversion used the AMES-COND evolutionary tracks Baraffe2003. d 92% Strehl was assumed at K band. e was assumed at H band.
To reach the contrast requirements, AO alone is however not sufficient because residual starlight still contaminates the region of interest within 1′′, as illustrated in Figure 3. These residuals come from both the diffracted light of the telescope entrance pupil, and the residual wavefront error due to uncorrected atmospheric perturbations and imperfect optics in with the telescope and instrument. At four resolution elements, the Airy pattern still reaches an intensity of the peak value. Therefore, detecting a signal at this level of contrast without any other high-contrast technique is highly ineffective because significant time must be spent to get enough signal. One must rely on additional diffraction light suppression technique, e.g. coronagraphy. The second source of residual starlight is more difficult to address. Wavefront errors create speckles in the image plane and mimic point-sources, degrading the contrast Racine1999. Unlike the diffraction pattern, speckles vary temporally on different timescales: from a fraction of milliseconds for non-corrected atmospheric speckles to hours or days for quasi-static speckles slowly variable with temperature, mechanical flexions or the rotation of optical parts. Moreover, they can interfere with the diffraction pattern of the pupil and be reinforced to create pinned speckles Aime2004. Adequate observing strategies and post-processing techniques based on differential imaging can remove the remaining starlight residual to the necessary level. Although coronagraphy and differential imaging are not the focus of this review, they put stringent constraints on the AO system that will be discussed here.
[width=0.4]./raw_PSF_alpha_Cen.pdf
1.3 From pioneering adaptive optics experiments to extreme adaptive optics system
AO developments have seen a tremendous progress over the past 30 years, from the first experiments to the most advanced systems now in operations and known as extreme AO systems. The concept of compensating astronomical seeing was first proposed by Babcock in 1953 Babcock1953. Military research further developped the concept, and the first prototype for astronomical observations, called COME-ON was installed in 1989 at the ESO/La Silla Observatory Rousset1990. ADONIS, an upgraded version of COME-ON and COME-ON+ became the first user-facility instrument equipped with an AO system Beuzit1994. Ten years later, VLT/Naos and Keck-AO were the workhorses of the first generation of adaptive optics systems, integrating the lessons learnt from the first pioneering experiments. Combined to the science camera Conica and NIRC2 respectively, these instruments led to many science breakthroughs, such as the first discovery of an exoplanet with VLT/NaCo in 2004 Chauvin2004, at a projected separation of 0.8′′, or the discovery of a system of four giant planets orbiting the star HR8799 in 2008 Marois2008. In parallel, the design choices of a second generation of AO systems were made, and these extreme AO (xAO) instruments saw their first light in the past few years. The high contrast requirements set new constraints on the AO systems, in order to control the wavefront to an exquisite level, to feed high-rejection coronagraph and to allow differential imaging and maintain the temporal evolution of aberrations as slow as possible. These new systems benefited from the leassons learnt from the first generations of instruments and will in turn provide valuable feedback for the on-going design of AO systems for extremely large telescopes. The first xAO systems on sky were P3000K-P1640 Oppenheimer2012; Dekany2013, followed by MagAO Close2012. Now three systems had their first light in the last two years: GPI at Gemini South Macintosh2014, SCExAO at Subaru Guyon2010 and SPHERE at the VLT Beuzit2008. Table 1.3 summarises the main instruments / AO systems contributing or havint contributed to the field. The design of those instruments are a trade-off between angular resolution, AO performance and planet sensitivity, as illustrated by the last rows of Table 1.2 , that compare the typical AO performance, contrast and sensitivity for both first generation AO systems and xAO systems in different filters.
1) the decorrelation of the PSF over time Hinkley2007, illustrated in Fig. 10, linear on a timescale of several tens of minutes but very steep within the first seconds 2) the very slow rotation of the field at very short separations where planet are expected, which implies a lot of self-subtraction of the astrophysical signal, especially for the case of extended sources such as disks Milli2012.
[width=0.62]./correlation_radius6_section3.pdf
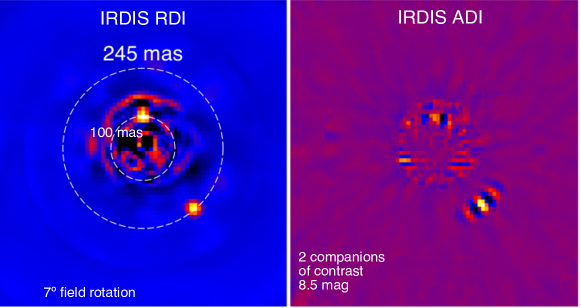
Reference star differential imaging (RDI) is a solution to circumvent these intrinsic difficulties. It implies observing a reference star as close as possible in time and space, ideally with the same parallactic angle variation to keep the motion of the optics as close as possible to the science observations. In practice, fast switching between science targets and calibrators suffers from the overheads of the WFS acquisition, but solutions exist to close the loop after switching target without reacquiring on the WFS, as implemented on VLT/NaCo (”star hopping” Lacour2011; Girard2012). On the other hand, it is also possible to rely on a large library of PSF acquired as part of a survey on many stars along several nights or weeks to build an optimal PSF for the star subtraction. Such a strategy was proposed on the Hubble Space Telescope Soummer2014; Choquet2014 and observing programs are currently on-going to validate this strategy on ground-based instruments in the new high-strehl regime opened by xAO instruments.
Simultaneous differential imaging represents another solution, whether spectral (SDI) or polarimetic (PDI). For that, the target needs to have a spectral feature (usually a methane feature for gas giants) or must show linear polarisation (disks or planets in scattered light). SDI relies on the fact that speckles scale with the wavelength unlike on-sky signal, whereas PDI relies on the fact that the thermal emission from the central star is unpolarized unlike scattered light from circumstellar material. Table 4 summarises the benefits and drawbacks of each differential imaging technique. Note that ADI can be carried out on top of SDI or PDI.
| Name | Diversity parameter | Strengths | Drawbacks |
|---|---|---|---|
| ADI | pupil/fied relative rotation | easy implementation | PSF decorrelation over time, self-subtraction |
| RDI | science/ref star | no self-subraction | rapid switching required or large library, subject to change in the PSF shape/ AO correction, overheads due to the calibrator |
| SDI | wavelength | simultaneous difference | relies on spectral features, chromaticity |
| PDI | linear polarisation | simultaneous difference, achromatic | relies on linear polarisation feature, calibration of instrumental polarisation |
4 Science highlights and new challenges
We provide in this section a few selected examples that showcase the new possibilities offered by xAO instruments.
4.1 Disks at very short separations
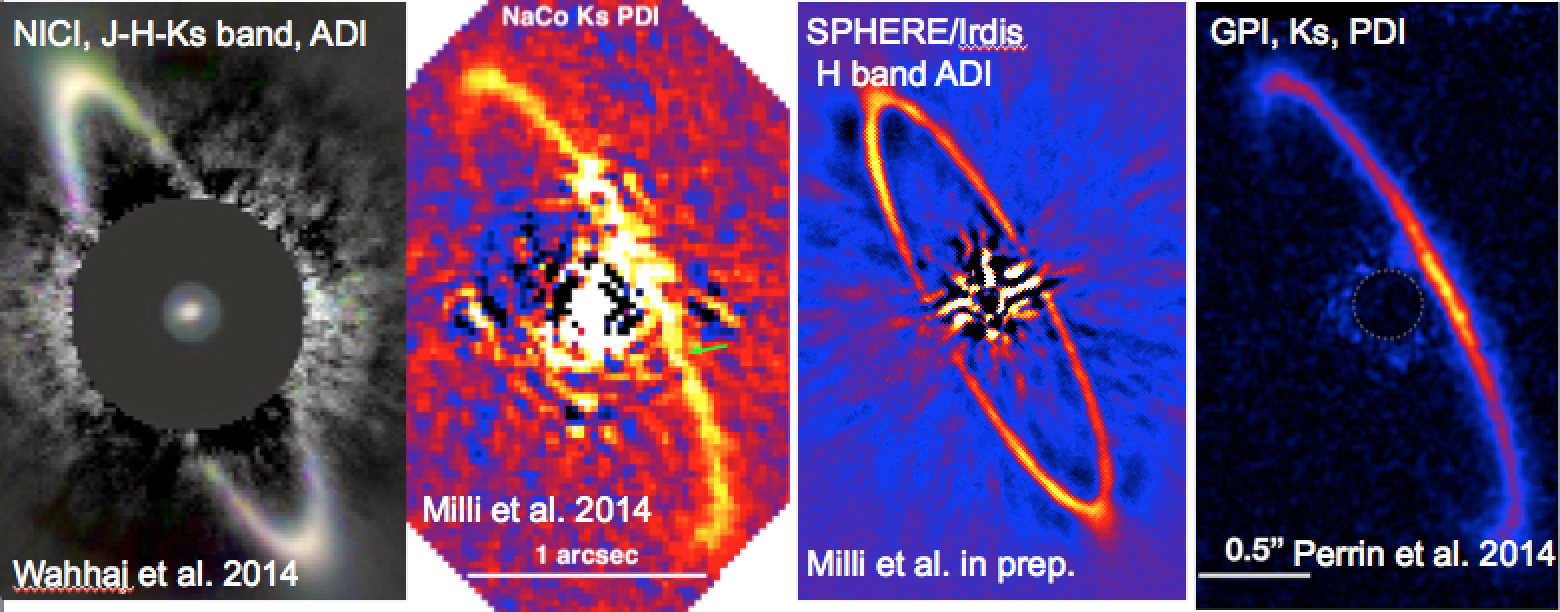
HR4796 is a prototypical debris disc that makes an ideal benchmark to compare instruments because it has been observed with almost all high-contrast instruments. The disc has a semi-major axis of ′′and a semi-minor axis of ′′. It was not detected in early AO imaging with the pioneering AO system COME-ON-PLUS Mouillet1997. First generation AO systems revealed the ring along its semi-major axis (see for instance the recent Subaru NICI image from Wahhaj2014 in Fig. 12 left). They were mostly blind to the semi-minor axis until the recent NaCo polarimetric image could reveal the disc almost entirely (Fig. 12, second image from Milli2015). An uncontrolled mode of the DM (waffle) creates a four-point pattern at the DM cutoff frequency (). With the xAO instruments VLT/SPHERE and Gemini/GPI, the disc is detected directly in raw frames of a few seconds without any star subtraction. The disc was observed in ADI in the H band during VLT/SPHERE commissioning (ESO press release 1417, third image in Fig. 12) under poor conditions. Light leak around the coronagraph below ′′and the small field rotation of only prevent a clear detection of the semi-minor axis but the improvement in achieved separation and image quality is striking. With GPI, the disc is detected unambiguously in polarimetry in the Ks band (right image, Perrin2014). The concept of integral field polarimetry implemented in GPI minimizes differential wavefront error between the two polarization channels, whereas the Wollaston prism of NaCo introduces differential aberrations.
4.2 Planets in the optical
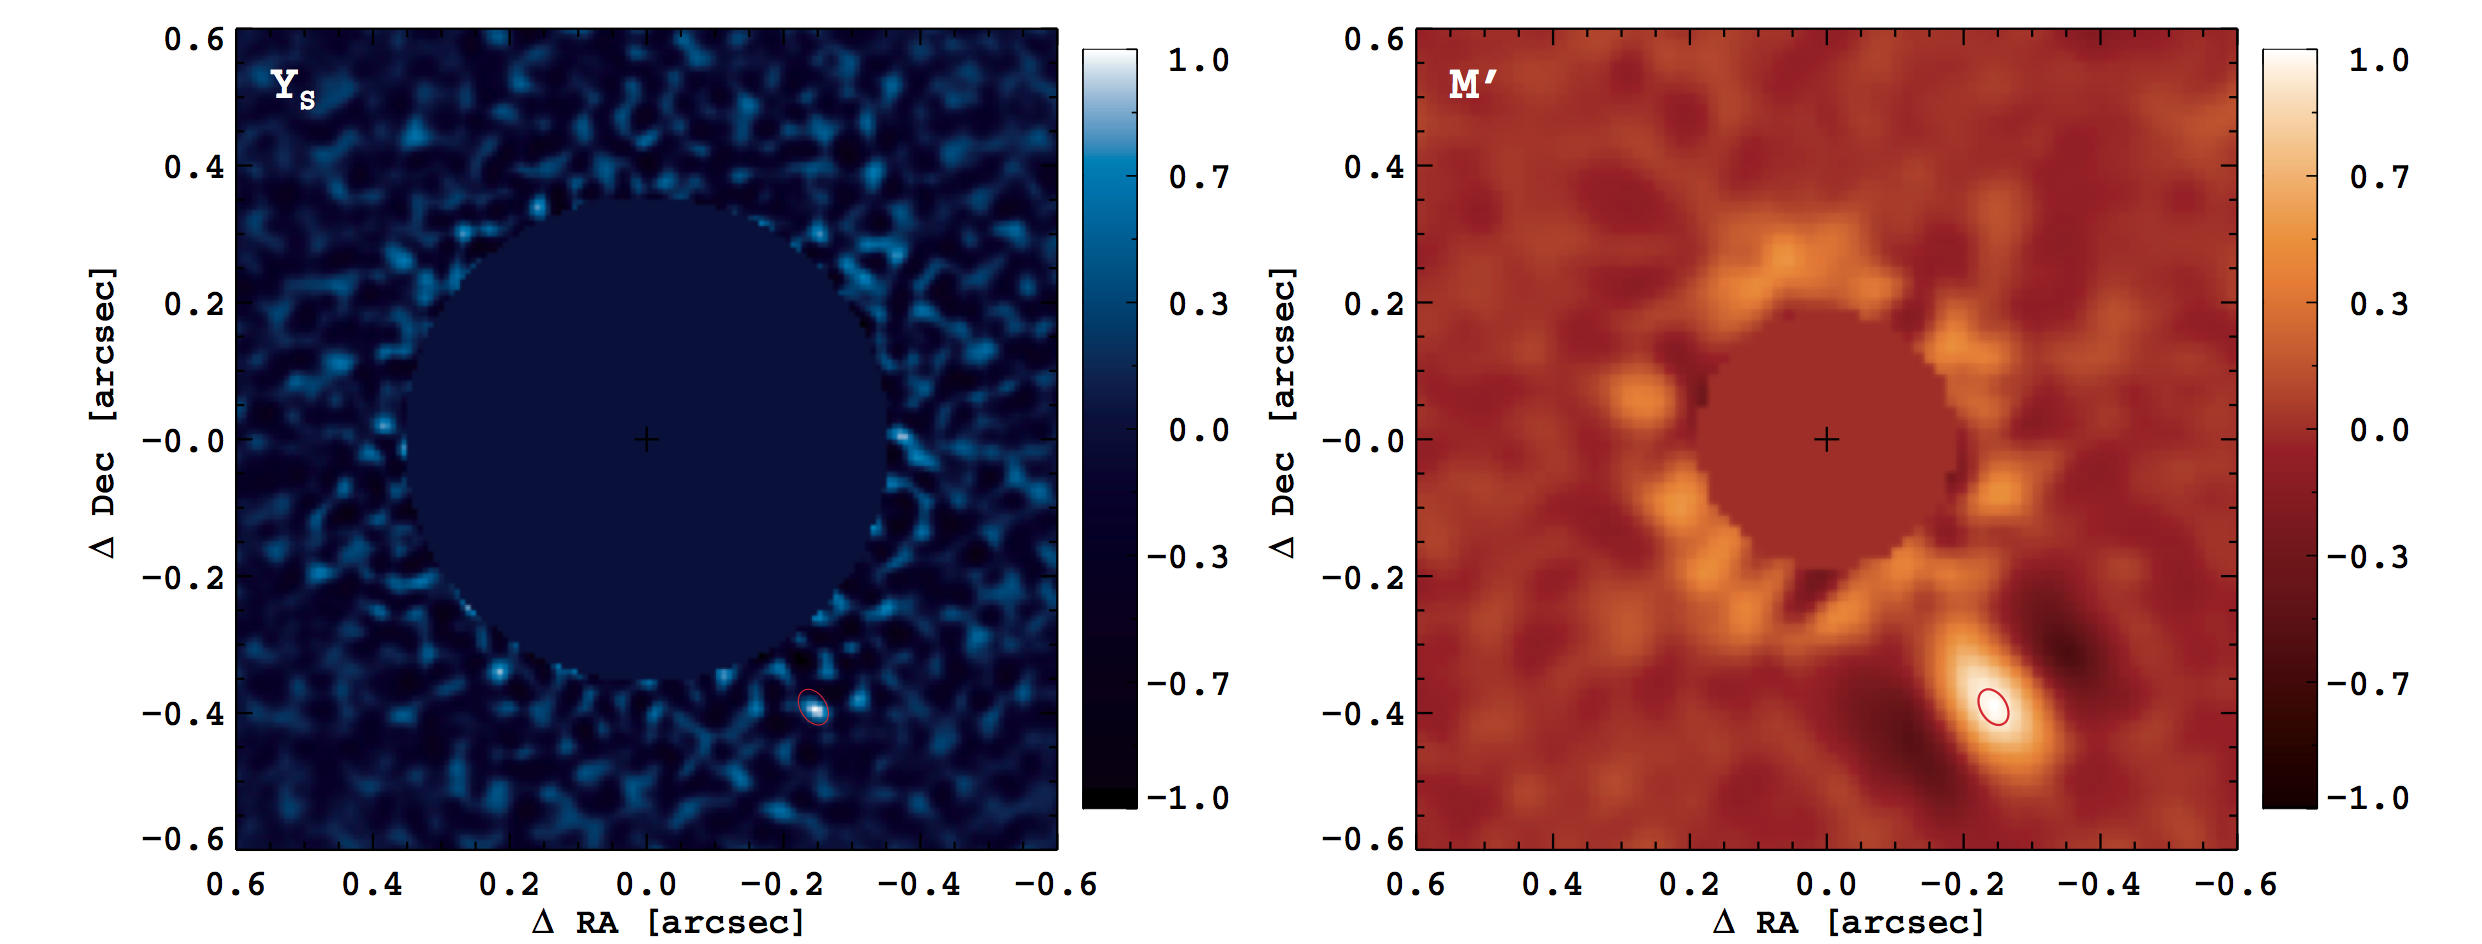
The new generation of xAO systems provides a very high wavefront correction that opens the door to optical AO-assisted imaging, much more demanding due to the smaller wavelengths. The optical range is appealing because the angular resolution is higher, and polarisation can be efficiently used both for starlight rejection and planet/disc characterisation. The first system on-sky was MagAO on the Magellan Clay telescope. MagAO is a 585-actuator adaptive secondary mirror with a pyramid WFS Close2012. It can operate simultaneously in the optical with the camera VisAO and in the infrared with Clio2. The gas giant Pictoris b was detected for the first time in the red optical (band , that still corresponds to the planet thermal emission) with VisAO in 2012 Males2014, with a SNR of (Fig. 13 left) and a Strehl of 40%.
Since then, other visible AO instruments arrived on-sky, such as VAMPIRES Norris2015 fed by the SCExAO system, or SPHERE/Zimpol Schmid2010, both implementing differential polarimetry. Zimpol is an unique concept of a high-accuracy polarimeter and imager. The polarimeter is based on the concept of high-frequency modulation of the polarisation to freeze the non-corrected atmospheric residuals, using a ferroelectric liquid cristal operating at 1 kHz. Demodulation is carried out with a dedicated CCD camera synchronized with the modulator and switching the charges alternatively up and down. Combined with the SPHERE xAO system, Zimpol aims at detecting exoplanets in reflected light Milli2013, due to its exquisite inner working angle of 30mas ( at 600nm). During the science verification, the Zimpol instrument in imaging mode resolved for the first time the surface of a star: the nearby red giant R Doradus, of diameter 57mas.
4.3 Spectra of exoplanets and brown dwarfs
Combined to integral field spectrographs (IFS), xAO provided the first spectra of exoplanets. The first IFS on-sky was P1640 at Palomar Oppenheimer2012. It revealed the spectra of the 4 known exoplanets HR8799 b, c, d and e (Fig. 14) from 995nm to 1769nm, and identified the presence of along with , , and possibly or HCN in variable amounts in each component of the system. More recently, Gemini/GPI revealed the H band spectra of Picoris b Chilcote2015 at only 436 mas of the central star. The spectrum, obtained with a resolving power of , shows a triangular shape, typical of cool low-gravity substellar objects. Extreme AO systems can also be combined to long slit spectroscopy (LSS) to provide medium resolution spectra. The concept of coronagraphic LSS is implemented in VLT/SPHERE Vigan2008 to enhance starligh rejection. It w‘as recently illustrated during Science Verification to reveal an spectrum of the young substellar companion 2MASS 0122-2439B across the YJH bands Hinkley2015 .
[width=0.5]./spectra_HR8799.png
5 Conclusions and future challenges
Today, several large-scale surveys of extrasolar planets using xAO systems are under way. These studies probe a new parameter space at smaller separations and higher contrast and will probably lead to tens of new detections in the coming years, that will help to understand the population and formation mechanisms of giant planets. On individual systems, these new capabilities also open up new perspectives. The photometric accuracy will enable to capture temporal variations of exoplanet emission due to non-uniform cloud coverage, or temporal evolution of disk asymmetries as a result of gravitational perturbation or stellar winds. By reaching shorter separations, direct imaging will bridge the gap with the radial velocity technique, to get access to the dynamical mass of giant planets and therefore test the evolutionary models.
From a technical point of view, the higher Strehl and stability of xAO systems unexpectedly revealed fine instrumental effects that passed unnoticed in first generation systems because of the lack of sensitivity. Such effects include vibration issues, peculiar dome- or low-altitude atmospheric conditions or subtle polarisation mechanisms. It also triggered an intense activity on post-processing techniques and signal detection theory, for which other fields of physics were a major source of inspiration. Observing strategies and data extraction methods valid at large separation and widely used on first generation instruments are not necessarily relevent at very short separation of a few resolution elements and need to be tailored for this new regime.
These developments and the experience acquired through xAO instruments will contribute to the preparation of the first planet-finder instruments for 30m-class telescopes arriving in the 2020s. Such systems are expected to unveil even shorter separations below 10 mas, but they will also have to overcome new challenges such as chromatic effects or segmented mirrors. Complemented by space-based coronagraphic instruments aiming for deeper contrasts, they are expected to reveal the first images of rocky planets around nearby stars.