Electronic correlations of element cerium under high pressure
Abstract
The electronic structures of element cerium under high pressure remain unclear all the time. We tried to calculate the electronic structures of , , and -Ce which only exist in the presence of pressure, by using the combination of traditional density functional theory and single-site dynamical mean-field theory. The momentum-resolved band structures, total and partial density of states, 4 electronic configurations of these phases were exhaustively studied. We found that the 4 electrons tend to be itinerant, and the hybridizations between the 4 and conduction electrons are remarkable. In addition, the fluctuations among the 4 atomic eigenstates are prominent, especially for the phase, which leads to a slight modification of its 4 occupancy.
pacs:
71.10.-w, 71.27.+a, 71.30.+h, 74.20.PqI Introduction
Ce is one of the most mysterious elements in the periodic table because of its unusual electronic structures which manifest in its multiple allotropic phases. Under ambient pressure, Ce may exhibit four allotropes (, , , and phases), and undergo three successive solid phase transitions before reaching its liquid state David C. Koskenmaki and Karl A. Gschneidner Jr. (1978). When GPa and at room temperature, strikingly, an iso-structural phase transition would take place between the and phases (both phases are in face-centered-cubic structure). Though the crystal structure is preserved during the transition, the atomic volume changes by 15% which has not been observed in any other simple metals. The underlying physics and driving force of the phase transition have been, and are being to this day, warmly debated. Particularly, concerning the role played by the correlated 4 electrons in the transition, it is still a matter of dispute and ongoing research Johansson (1974); Johansson et al. (1995); Allen and Martin (1982); Allen and Liu (1992); Jeong et al. (2004); Lipp et al. (2008); Jarlborg (2014).
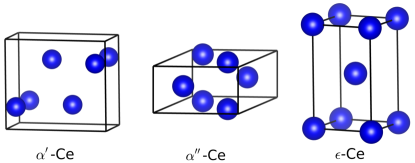
Besides, under moderate pressure and temperature Ce will exhibit another three distinct phases, namely, the , , and phases (see Fig. 1), which result in an extremely complicated phase diagram Nikolaev and Tsvyashchenko (2012). The crystal structure of the phase is orthorhombic (space group ). Noted that it is iso-structural with -U. The phase is monoclinic (space group ). The -Ce will transform into the two phases in the pressure range from 5 to 12 GPa, but which phase transition (i.e., or transition) could occur in a cerium sample strongly depends on the method of sample preparation. Upon further volume compression ( GPa) both the and phases can transform into the phase, which is body centered tetragonal (space group ). Recently, the inelastic X-ray scattering experiment has demonstrated that there exist strong electron-phonon coupling and pronounced phonon anomalies in the phase, which means that it is at the verge of lattice instability Loa et al. (2012). Similar to -U, a charge density wave perhaps develops in the -Ce. Furthermore, the superconductivity with K found in the high-pressure phases of Ce can be attributed to the phase as well.
It is very difficult to prepare and identify pure high-pressure phases of Ce, which requires precise controls of pressure and thermal process Ellinger and Zachariasen (1974). Therefore, it is not easy to conduct extensively experimental researches. On the other hand, low-symmetry crystal structures, strong spin-orbit coupling, and notable electronic correlations in 4 electrons also pose great challenges to the first-principles calculations David C. Koskenmaki and Karl A. Gschneidner Jr. (1978). As a result, though numerous efforts have been made to explore the basic properties of Ce under pressure, actually we know a little about the electronic structures of its high-pressure phases and there are a lot of puzzles that need to be solved. For instance, do the 4 electrons remain itinerant or localized state Smith and Kmetko (1983)? What’s the consequence in electronic structures since the interplay of spin-orbit coupling and 4 electronic correlations? Are there strong hybridization between the 4 and bands as predicted by the Kondo volume collapse (KVC) scenario Allen and Martin (1982); Allen and Liu (1992)? Last, but by no means least, are the 4 electronic configurations for these high-pressure phases the same, and are they similar to or different from those for the other phases under ambient pressure Haule et al. (2005); McMahan et al. (2003); Held et al. (2001); Zölfl et al. (2001); McMahan (2005); Amadon et al. (2006); Chakrabarti et al. (2014)? In order to answer the above questions, more experimental investigations and theoretical calculations are highly desired.
Bearing these questions in mind, the purpose of this paper is to endeavour to build an unified picture for the evolution of electronic structures of high-pressure phases of Ce, by utilizing the state-of-the-art first-principles many-body approach. The rest of the paper is organized as follows. In Sec. II, we briefly introduce the calculation method and parameters. In Sec. III, we present all of the calculated results and make a detailed discussion. We also compare the electronic configurations between the high-pressure phases and -Ce. Finally, Section IV serves as a short summary and conclusion.
II Methods
In the present work, we employed the density functional theory in combination with the single-site dynamical mean-field theory (dubbed as DFT + DMFT) to study the electronic structures of , , and -Ce. This approach can treat the strong electronic correlations, spin-orbit coupling as well as on-site Kondo screening on the same footing, and incorporate them into realistic band structures based on DFT calculations. As for the basic principles and technical details of the DFT + DMFT method, please refer to the good reviews (see Refs. [Kotliar et al., 2006] and [Georges et al., 1996]) and references therein. In fact, it is considered as the most powerful method established so far for the calculations of electronic structures of strongly correlated materials, and has been successfully applied to study many interesting problems in lanthanides and actinides, such as the best known phase transition in Ce Zölfl et al. (2001); Held et al. (2001); Haule et al. (2005); Amadon et al. (2006); Chakrabarti et al. (2014); McMahan et al. (2003); McMahan (2005), the low-temperature hidden order phase of URu2Si2 Mydosh and Oppeneer (2011), and the valence state fluctuations in Yb Ylvisaker et al. (2009) and Pu Shim et al. (2007); Janoschek et al. (2015).
We performed charge fully self-consistent DFT + DMFT calculations by using the EDMFTF software package Haule et al. (2010). The Kohn-Sham equation within the DFT part was solved by using the WIEN2K code, which implements a full-potential linear augmented plane-wave formalism Blaha et al. (2001). We selected the generalized gradient approximation to represent exchange-correlation functional Perdew et al. (1996). The hybridization expansion version continuous-time quantum Monte Carlo impurity solver (dubbed as CT-HYB) Gull et al. (2011); Haule (2007); Werner et al. (2006) was used to solve the quantum impurity model within the DMFT part. Undoubtedly, the 4 bands were treated as correlated orbitals. The corresponding interaction parameters were on-site Coulomb interaction eV and Hund’s coupling eV Zölfl et al. (2001); Held et al. (2001). The experimental lattice structures and system temperature K () were used throughout the calculations.
III Results
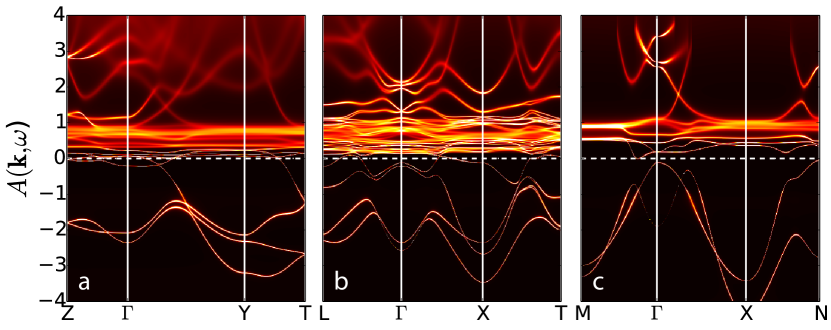
Momentum-resolved spectral functions . The calculated band structures of the three high-pressure phases along the high-symmetry lines in the Brillouin zone are displayed in Fig. 2. Since most of the 4 bands in Ce are unoccupied, their positions are well above the Fermi level. As eV, we observe some intense and stripe-like features, which are mainly associated with the 4 bands. Their bandwidths are approximately eV, which are much smaller than the Coulomb interaction strength (i.e., ). It is an exact evidence to support the statement that the 4 bands in the high-pressure phases of Ce are still strongly correlated Georges et al. (1996). In addition, we also observe heavy hybridizations between the 4 and the conduction bands in this energy window. As eV and , the general features become somewhat blurry. The bands in this energy range exhibit remarkable dispersions and large bandwidths. Apparently, they belong to the itinerant bands to a large extent.
Now let us concentrate on the similarities and differences in the band structures of the three phases. As for the and phases, since their lattice volumes are very close and their crystal structures are tightly related, the corresponding band structures are quite similar and share some common features, such as the positions of the 4 and valence bands. However, for the phase, which exists under higher pressure and thus has a smaller lattice volume Nikolaev and Tsvyashchenko (2012), the center of the correlated 4 bands shifts upwards slightly and the itinerant bands exhibit much more significant dispersions. Finally, from Fig. 2, we can speculate that for the phase the volume encapsulated by the Fermi surface is the smallest. In the and phases, the Fermi surfaces that enclose the point are hole-type and electron-type, respectively.
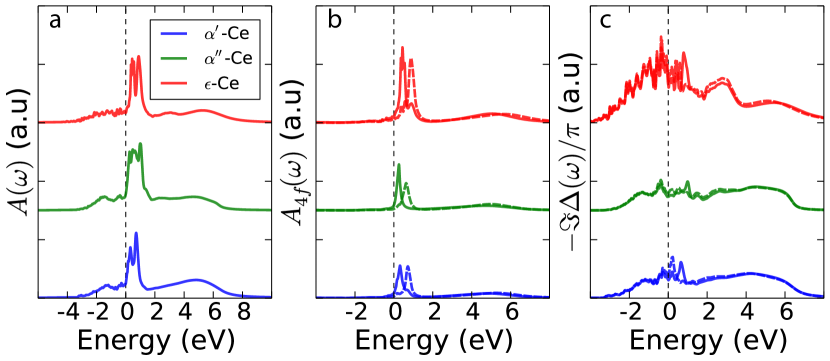
Density of states . The total density of states are shown in Fig. 3(a). In the vicinity of the Fermi level, there is the so-called Kondo resonance peak with sharp two-peak structure. This splitting is owing to the spin-orbit coupling effect. Away from the Fermi level, the spectrum spreads out and becomes almost featureless. Just as discussed above, the spectra for the and phases are very similar, including the magnitude of the Kondo resonance peak, the two satellite peaks between -2 eV and , and the total bandwidth. As for the phase, its spectrum turns broader and has a stronger Kondo resonance peak.
The 4 partial density of states are shown in Fig. 3(b). Clearly, according to the difference between and , the contributions from the 4 bands are predominant near the Fermi level. They compose the Kondo resonance peak. On the other hand, below the Fermi level, the itinerant bands are the most important (the 4 spectral weight approaches zero). Due to the spin-orbit coupling, the 4 bands are split into two components, namely and . The component has a lower energy and is closer to the Fermi level. The lower Hubbard bands are almost invisible since the 4 occupancy is small. The upper Hubbard bands look like broad “humps”, and they locate roughly from 2 eV to 8 eV. All these features are comparable to those already found in the phase by using the DFT + DMFT method McMahan (2005); Zölfl et al. (2001); Held et al. (2001); McMahan et al. (2003) and photoemission spectroscopy Wieliczka et al. (1984); Wuilloud et al. (1983). Compared to the and phases, the of the phase is a bit different. The peaks ascribed to the and components (and the upper Hubbard bands) have larger intensity, and their positions are shifted to high-energy regime marginally.
In Fig. 3(c), we visualize the imaginary parts of the real-frequency hybridization functions, i.e., , which are approximately proportional to the strength of hybridization effect between the strongly correlated 4 bands and the weakly correlated (or non-correlated) bands. We can see that the hybridization effect is very strong, especially near the Fermi level. It indicates that the KVC scenario not only can be used to explain the phase transition Allen and Martin (1982); Allen and Liu (1992), but also is useful for understanding the underlying electronic structures of the high-pressure phases of Ce. Noticed that the hybridization function of the phase is much higher than the others, which implies that its 4 electrons tend to be more itinerant. Naturally, we believe that the valence state fluctuation in the phase must be the most pronounced among cerium’s allotropes. We will discuss this issue later.
Distribution of atomic eigenstates. The CT-HYB quantum impurity solver is capable of computing the valence state histogram , which means the probability to find a valence state electron (such as the electrons in Ce) in a given atomic eigenstate (labelled by ) Haule (2007). It provides us a powerful lens to learn the subtle electronic structures of strongly correlated systems directly. Besides the first successful application for the 4 electrons in and -Ce, it has been adopted to analyze the status of 5 electrons in and -Pu Shim et al. (2007); Janoschek et al. (2015), and the 4 localized-itinerant crossover in heavy fermion compound CeIn3 Lu and Huang (2016). Here, we would like to utilize it to unveil whether the 4 electrons in the high-pressure phases of Ce are localized or not. In the presence of spin-orbit coupling, the 4 atomic eigenstates could be classified by using the good quantum numbers (total occupancy) and (total angular momentum). In the present work, in order to accelerate the calculations, we made a crucial truncation that only those atomic eigenstates whose were taken into considerations Haule (2007). Next we will prove that the contributions from the atomic eigenstates with larger occupancy () are trivial and the truncation we used is reasonable.
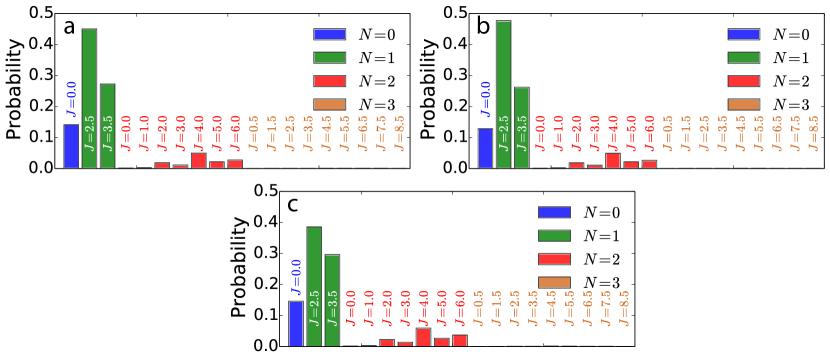
The calculated valence state histograms are shown in Fig. 4. As is seen in this figure, the predominant atomic eigenstates are and . Their probabilities add up to about 68% 74%. The less important atomic eigenstate is , which amounts to about 13% 15%. For the case, the contributions from various atomic eigenstates account for about 13% 17%. They are comparable and no dominant ones. The probabilities for the atomic eigenstates with are tiny ( in total), so it is hardly to see them in Fig. 4. Since the contributions from the atomic eigenstates are unimportant, it is acceptable to discard them to improve the efficiency during the DFT + DMFT calculations. Actually, we rerun all of the calculations with and . The calculated results are practically identical.
Next, let us compare the valence state histograms of the three phases. First, in the and phases, the probability of the eigenstate is nearly twice as much as the one of the eigenstate. While for the phase, the probabilities for the two atomic eigenstates are close. Second, the probabilities for the , 2, and 3 cases in the phase are somewhat larger than those in the and phases. All these facts reveal that the 4 electrons in the high-pressure phases of cerium are not always bound to the case, and tend to hop among a variety of atomic eigenstates with different occupancy and angular momentum. Especially for the phase, this tendency is the most noticeable.
Valence state fluctuations. From the 4 valence state histograms, we can easily evaluate the distributions of 4 electronic configurations, and then discuss the valence state fluctuation phenomenon which usually manifests itself in the rare earth compounds (such as the Ce-based, Sm-based, and Yb-based heavy fermion systems Jarrige et al. (2013); Ylvisaker et al. (2009)) and the actinides (such as Pu Janoschek et al. (2015); Shim et al. (2007)). Supposed that the weight for the (where ) configuration is , then it can be calculated via the following equation,
| (1) |
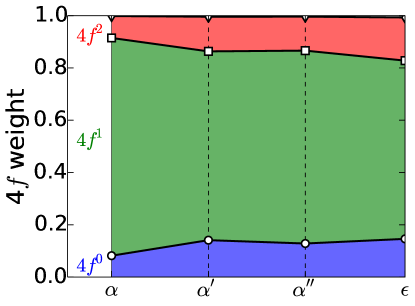
We tried to calculate the weights for the electronic configurations. The results are presented in Fig. 5. In order to gain a clear impression about the evolution of electronic configurations, we performed additional calculations for the phase, and supplemented its data to this figure. Obviously, for , we have . However, for or , the sequence is inverse, i.e., .
Based on the obtained data, we reached the following conclusions. First, the distributions of electronic configurations for the and phases are similar in all respects. Second, in the high-pressure phases of cerium, the 4 valence state fluctuations are more significant than the phases under ambient pressure. Particularly, in the phase, the 4 valence state fluctuation is much stronger than the other allotropes. Third, strong valence state fluctuation will modify the valence state occupancy inevitably. Thus we employed the following equation to evaluate the averaged 4 occupancy Lu and Huang (2016),
| (2) |
The calculations suggest that the for the , , and phases are 0.98, 0.99, and 1.03, respectively occ . Alternatively, the 4 occupancy is only modified slightly in this case.
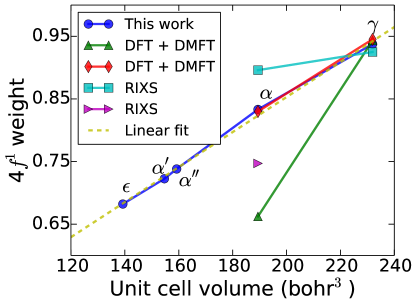
Discussions. Under external pressure, the unit cell volumes of cerium is reduced, and the corresponding electronic structure (including the band structure, density of states, Fermi surface, valence state histogram, and distribution of electronic configuration) is tuned gradually. Here, we would like to figure out the relationship between the lattice volume and the 4 electronic configurations.
In Fig. 6, we try to plot the against lattice volume vol . Besides the three high-pressure phases, the available data for the and phases are also included. Surprisingly, we find that the curve exhibits a quasi-linear behavior. Then we used the formula to fit the data (please see the dashed dark-yellow line in Fig. 6). The fitting parameters and are 0.00279767 and 0.293449, respectively. This linear behavior is easily to be understood. The larger the lattice volume is, the more localized the 4 electrons are, and the smaller the 4 valence state fluctuation will be. As a result, the 4 electrons have a tendency to stay at the electronic configuration instead of hopping to and fro, with respect to the increment of lattice volume. On the other hand, we think that the could be considered as a quantitative tool to measure the valence state fluctuation and electronic localized degree of freedom for Ce-based system.
IV summary
In conclusion, we studied the electronic structures of three high-pressure phases of Ce by using the charge fully self-consistent DFT + DMFT method. We found that the 4 electrons exhibit more itinerant features. And the valence state fluctuation in the phase is the most remarkable, which is precisely described by the quantity . To the best of our knowledge, it is the first time to adopt the first-principles many-body approach to study the , , and -Ce. It is also the first step to build an unified picture for the electronic structures and related physical properties of all allotropes of Ce. Unfortunately, the corresponding experiments are rare in the literatures. Our results serve as critical predictions, and require further experimental examinations.
Acknowledgements.
This work was supported by the Natural Science Foundation of China (No. 11504340), the Foundation of President of China Academy of Engineering Physics (No. YZ2015012), the Discipline Development Fund Project of Science and Technology on Surface Physics and Chemistry Laboratory (No. 201502), and the Science Challenge Project of China (No. JCKY2016212A56401).References
- David C. Koskenmaki and Karl A. Gschneidner Jr. (1978) David C. Koskenmaki and Karl A. Gschneidner Jr., in Handbook on the Physics and Chemistry of Rare Earths, Vol. 1, edited by Karl A. Gschneidner Jr. and LeRoy Eyring (Elsevier, 1978) Chap. 4.
- Johansson (1974) B. Johansson, Phil. Mag. 30, 469 (1974).
- Johansson et al. (1995) B. Johansson, I. A. Abrikosov, M. Aldén, A. V. Ruban, and H. L. Skriver, Phys. Rev. Lett. 74, 2335 (1995).
- Allen and Martin (1982) J. W. Allen and R. M. Martin, Phys. Rev. Lett. 49, 1106 (1982).
- Allen and Liu (1992) J. W. Allen and L. Z. Liu, Phys. Rev. B 46, 5047 (1992).
- Jeong et al. (2004) I.-K. Jeong, T. W. Darling, M. J. Graf, T. Proffen, R. H. Heffner, Y. Lee, T. Vogt, and J. D. Jorgensen, Phys. Rev. Lett. 92, 105702 (2004).
- Lipp et al. (2008) M. J. Lipp, D. Jackson, H. Cynn, C. Aracne, W. J. Evans, and A. K. McMahan, Phys. Rev. Lett. 101, 165703 (2008).
- Jarlborg (2014) T. Jarlborg, Phys. Rev. B 89, 184426 (2014).
- Nikolaev and Tsvyashchenko (2012) A. V. Nikolaev and A. V. Tsvyashchenko, Physics-Uspekhi 55, 657 (2012).
- Loa et al. (2012) I. Loa, E. I. Isaev, M. I. McMahon, D. Y. Kim, B. Johansson, A. Bosak, and M. Krisch, Phys. Rev. Lett. 108, 045502 (2012).
- Ellinger and Zachariasen (1974) F. H. Ellinger and W. H. Zachariasen, Phys. Rev. Lett. 32, 773 (1974).
- Smith and Kmetko (1983) J. Smith and E. Kmetko, J. Less Common Metals 90, 83 (1983).
- Haule et al. (2005) K. Haule, V. Oudovenko, S. Y. Savrasov, and G. Kotliar, Phys. Rev. Lett. 94, 036401 (2005).
- McMahan et al. (2003) A. K. McMahan, K. Held, and R. T. Scalettar, Phys. Rev. B 67, 075108 (2003).
- Held et al. (2001) K. Held, A. K. McMahan, and R. T. Scalettar, Phys. Rev. Lett. 87, 276404 (2001).
- Zölfl et al. (2001) M. B. Zölfl, I. A. Nekrasov, T. Pruschke, V. I. Anisimov, and J. Keller, Phys. Rev. Lett. 87, 276403 (2001).
- McMahan (2005) A. K. McMahan, Phys. Rev. B 72, 115125 (2005).
- Amadon et al. (2006) B. Amadon, S. Biermann, A. Georges, and F. Aryasetiawan, Phys. Rev. Lett. 96, 066402 (2006).
- Chakrabarti et al. (2014) B. Chakrabarti, M. E. Pezzoli, G. Sordi, K. Haule, and G. Kotliar, Phys. Rev. B 89, 125113 (2014).
- Kotliar et al. (2006) G. Kotliar, S. Y. Savrasov, K. Haule, V. S. Oudovenko, O. Parcollet, and C. A. Marianetti, Rev. Mod. Phys. 78, 865 (2006).
- Georges et al. (1996) A. Georges, G. Kotliar, W. Krauth, and M. J. Rozenberg, Rev. Mod. Phys. 68, 13 (1996).
- Mydosh and Oppeneer (2011) J. A. Mydosh and P. M. Oppeneer, Rev. Mod. Phys. 83, 1301 (2011).
- Ylvisaker et al. (2009) E. R. Ylvisaker, J. Kuneš, A. K. McMahan, and W. E. Pickett, Phys. Rev. Lett. 102, 246401 (2009).
- Shim et al. (2007) J. H. Shim, K. Haule, and G. Kotliar, Nature 446, 513 (2007).
- Janoschek et al. (2015) M. Janoschek, P. Das, B. Chakrabarti, D. L. Abernathy, M. D. Lumsden, J. M. Lawrence, J. D. Thompson, G. H. Lander, J. N. Mitchell, S. Richmond, M. Ramos, F. Trouw, J.-X. Zhu, K. Haule, G. Kotliar, and E. D. Bauer, Sci. Adv. 1, 1500188 (2015).
- Haule et al. (2010) K. Haule, C.-H. Yee, and K. Kim, Phys. Rev. B 81, 195107 (2010).
- Blaha et al. (2001) P. Blaha, K. Schwarz, G. Madsen, D. Kvasnicka, and J. Luitz, WIEN2k, An Augmented Plane Wave + Local Orbitals Program for Calculating Crystal Properties (Karlheinz Schwarz, Techn. Universität Wien, Austria, 2001).
- Perdew et al. (1996) J. P. Perdew, K. Burke, and M. Ernzerhof, Phys. Rev. Lett. 77, 3865 (1996).
- Gull et al. (2011) E. Gull, A. J. Millis, A. I. Lichtenstein, A. N. Rubtsov, M. Troyer, and P. Werner, Rev. Mod. Phys. 83, 349 (2011).
- Haule (2007) K. Haule, Phys. Rev. B 75, 155113 (2007).
- Werner et al. (2006) P. Werner, A. Comanac, L. de’ Medici, M. Troyer, and A. J. Millis, Phys. Rev. Lett. 97, 076405 (2006).
- Wieliczka et al. (1984) D. M. Wieliczka, C. G. Olson, and D. W. Lynch, Phys. Rev. B 29, 3028 (1984).
- Wuilloud et al. (1983) E. Wuilloud, H. R. Moser, W. D. Schneider, and Y. Baer, Phys. Rev. B 28, 7354 (1983).
- Lu and Huang (2016) H. Lu and L. Huang, Phys. Rev. B 94, 075132 (2016).
- Jarrige et al. (2013) I. Jarrige, H. Yamaoka, J.-P. Rueff, J.-F. Lin, M. Taguchi, N. Hiraoka, H. Ishii, K. D. Tsuei, K. Imura, T. Matsumura, A. Ochiai, H. S. Suzuki, and A. Kotani, Phys. Rev. B 87, 115107 (2013).
- (36) We can evaluate the 4 occupations through the impurity Green’s function or , but usually the calculated values are a little smaller.
- (37) Here, the volume means the lattice volume occupied by single cerium atom.
- Rueff et al. (2006) J.-P. Rueff, J.-P. Itié, M. Taguchi, C. F. Hague, J.-M. Mariot, R. Delaunay, J.-P. Kappler, and N. Jaouen, Phys. Rev. Lett. 96, 237403 (2006).