Characterizing K2 Candidate Planetary Systems Orbiting Low-Mass Stars I: Classifying Low-mass Host Stars Observed During Campaigns 1-7
Abstract
We present near-infrared spectra for 144 candidate planetary systems identified during Campaigns 1-7 of the NASA K2 Mission. The goal of the survey was to characterize planets orbiting low-mass stars, but our IRTF/SpeX and Palomar/TripleSpec spectroscopic observations revealed that 49% of our targets were actually giant stars or hotter dwarfs reddened by interstellar extinction. For the 72 stars with spectra consistent with classification as cool dwarfs (spectral types K3 - M4), we refined their stellar properties by applying empirical relations based on stars with interferometric radius measurements. Although our revised temperatures are generally consistent with those reported in the Ecliptic Plane Input Catalog (EPIC), our revised stellar radii are typically (39%) larger than the EPIC values, which were based on model isochrones that have been shown to underestimate the radii of cool dwarfs. Our improved stellar characterizations will enable more efficient prioritization of K2 targets for follow-up studies.
1 Introduction
Beginning in 2009, the NASA Kepler mission revolutionized exoplanet science by searching for planets transiting roughly 190,000 stars and detecting thousands of planet candidates (Borucki et al., 2010, 2011a, 2011b; Batalha et al., 2013; Burke et al., 2014). The main Kepler mission ended in 2013 when the second of four reaction wheels failed, thereby destroying the ability of the spacecraft to point stably. Although the two-wheeled Kepler was not able to continue observing the original targets, Ball Aerospace engineers and Kepler team members realized that the torque from solar pressure could be mitigated by selecting fields along the ecliptic plane. In this new mode of operation (known as the K2 Mission), the spacecraft stares at 10,000 - 30,000 stars per field for roughly 80 days before switching to another field along the ecliptic (Howell et al., 2014; Van Cleve et al., 2016). Unlike in the original Kepler mission, all K2 targets are selected from community-driven Guest Observer (GO) proposals.
The K2 mission design is particularly well-matched for studies of planetary systems orbiting low-mass stars. Although M dwarfs are intrinsically fainter than Sun-like stars, the prevalence of M dwarfs within the galaxy (e.g., Henry et al., 2006; Winters et al., 2015) ensures that there are several thousand reasonably bright low-mass stars per K2 field. Due to their smaller sizes and cooler temperatures, these stars are relatively easy targets for planet detection for two main reasons. First, the transit depth is deeper for a given planet radius. Second, the habitable zones are closer to the stars, thereby increasing both the geometric likelihood that planets within the habitable zone will appear to transit and the number of transits that could be observed during a single K2 campaign. For the coolest low-mass stars, the orbital periods of planets within the habitable zone are even short enough that potentially habitable planets would transit multiple times per campaign.
The “Small Star Advantage” of deeper transit depths and higher transit probabilities within the habitable zone is partially offset by the challenge of identifying samples of low-mass stars for observation. When preparing for the original Kepler mission, Brown et al. (2011) conducted an extensive survey of the proposed field of view to identify advantageous targets and determine rough stellar properties. In contrast, the planning cycle for the K2 mission was too fast-paced to allow for such methodical preparation. During the early days of the K2 mission, the official Ecliptic Plane Input Catalog (EPIC) contained only coordinates, photometry, proper motions, and, when available, parallaxes. Proposers therefore had to use their own knowledge of stellar astrophysics to determine which stars were suitable for their investigations.
More recently, Huber et al. (2016) updated the EPIC to include stellar properties for 138,600 stars. After completing the messy tasks of matching sources from multiple catalogs, converting the photometry to standard systems, and enforcing quality cuts to discard low-quality photometry, Huber et al. (2016) used the Galaxia galactic model (Sharma et al., 2011) to generate synthetic realizations of different K2 fields. They then determined the most likely parameters for each K2 target star given the available photometric and kinematic information. When possible, the analysis also incorporated Hipparcos parallaxes (van Leeuwen, 2007) and spectroscopic estimates of , , and [Fe/H] from RAVE DR4 (Kordopatis et al., 2013), LAMOST DR1 (Luo et al., 2015), and APOGEE DR12 (Alam et al., 2015).
In all cases, Galaxia used Padova isochrones (Girardi et al., 2000; Marigo & Girardi, 2007; Marigo et al., 2008) to determine stellar properties. Aware that these isochrones tend to underpredict the radii of low-mass stars (Boyajian et al., 2012), Huber et al. (2016) therefore warned that the EPIC radii of low-mass stars may be up to roughly 20% too small. Given that 41% of selected K2 targets are low-mass M and K dwarfs (Huber et al., 2016), improving the radius estimates of low-mass K2 targets is important for maximizing the scientific yield of the K2 mission. Both accurate characterization of individual planet candidates and ensemble studies of planetary occurrence demand reliable stellar properties.
Even during the more methodical Kepler era, the properties of low-mass targets were frequently revised. Initially, Brown et al. (2011) characterized all of the targets by comparing multi-band photometry to Castelli & Kurucz (2004) stellar models. This approach worked well for characterizing Sun-like stars, but Brown et al. (2011) cautioned that the Kepler Input Catalog (KIC) temperatures were untrustworthy for stars cooler than 3750 K. Batalha et al. (2013) later improved the classifications for many Kepler targets by replacing the original KIC values with parameters of the nearest model star selected from Yonsei-Yale isochrones (Demarque et al., 2004), but those models noticeably underpredict the radii of low-mass stars (Boyajian et al., 2012).
Considering the non-planet candidate host stars, Mann et al. (2012) acquired medium-resolution () visible spectra of 382 putative low-mass dwarf targets. Using those stars as a “training set,” they found that the vast majority () of cool, bright () Kepler target stars were actually giants. For fainter cool stars, giant contamination was much less pronounced (). For stars that were correctly classified as dwarfs, Mann et al. (2012) found that the KIC temperatures were systematically 110K hotter than the values determined by comparing their spectra to the BT-SETTL series of PHOENIX stellar models (Allard et al., 2011).
In a following paper, Mann et al. (2013b) obtained optical spectra of 123 putative low-mass stars hosting 188 planet candidates and NIR spectra for a smaller subset of host stars. Flux-calibrating their spectra and comparing them to BT-SETTL stellar models, they derived a set of empirically-based relations to determine stellar effective temperatures from spectral indices measured at visible and near-infrared wavelengths. Mann et al. (2013b) also introduced a set of temperature–radius, temperature–mass, and temperature–luminosity relations based on the sample of stars with well-constrained radii, effective temperatures, and bolometric fluxes.
Focusing specifically on the coolest Kepler targets, Muirhead et al. (2012) re-characterized 84 cool Kepler Object of Interest (KOI) host stars by obtaining near-infrared spectra with TripleSpec at the Palomar Hale Telescope. As explained in Rojas-Ayala et al. (2012), they estimated temperatures and metallicities using the H2O-K2 index and the equivalent widths (EW) of the Na I line at 2.210 and the Ca I line at 2.260. Depending on stellar metallicity, the H2O-K2 index saturates at approximately 3900K, so this approach cannot be used to characterize mid-K dwarfs. Muirhead et al. (2012) then interpolated the temperatures and metallicities onto Dartmouth isochrones (Dotter et al., 2008; Feiden et al., 2011) to estimate the radii and masses of their target stars. In a follow-up analysis, Muirhead et al. (2014) expanded their sample to 103 cool KOI host stars and updated their mass and radius estimates using newer versions of the Dartmouth isochrones.
Both KOIs and non-KOIs need to be accurately characterized in order to use the Kepler data to investigate planet occurrence rates, which motivated Dressing & Charbonneau (2013) to refit the KIC photometry using Dartmouth Stellar Evolutionary Models (Dotter et al., 2008; Feiden et al., 2011) to determine revised properties for 3897 dwarfs cooler than 4000K. We then used the revised stellar properties to investigate the frequency of planetary systems orbiting low-mass stars.
Recognizing that the stellar parameters inferred in the previous studies were based on stellar models and therefore likely to underestimate stellar radii, Newton et al. (2015) revised the properties of cool KOI host stars by employing empirical relations based on interferometrically characterized stars. Specifically, Newton et al. (2015) established relationships between the EWs of Mg and Al features in -band spectra from IRTF/SpeX and the temperatures, luminosities, and radii of low-mass stars. Newton et al. (2015) found that the radii of M dwarf planet candidates were typically 15% larger than previously estimated in the Huber et al. (2014) catalog, which contained a compilation of results from previous studies including Dressing & Charbonneau (2013), Muirhead et al. (2012, 2014), and Mann et al. (2013b).
Accounting for the systematic effect of previously underestimated stellar radii, Dressing & Charbonneau (2015) investigated low-mass star planet occurrence in more detail by employing their own pipeline to detect candidates and measure search completeness. Using the full four-year Kepler dataset, we found that the mean number of small () planets per late K or early M dwarf is planets per star for orbital periods shorter than 200 days. Within the habitable zone, we estimated occurrence rates of Earth-size planets and super-Earths () per star. Those estimates agree well with rates derived in independent studies (e.g., Gaidos, 2013; Morton & Swift, 2014; Gaidos et al., 2014, 2016).
In order to use the K2 data to conduct similar studies of planet occurrence rates and possibly investigate how the frequency of planetary systems orbiting low mass stars varies as a function of stellar mass, metallicity, or multiplicity, we first need to characterize the stellar sample. In this paper, we classify the subset of K2 target stars that appear to be low-mass stars harboring planetary systems. In the second paper in this series (Dressing et al., 2016), we use our new stellar classifications to revise the properties of the associated planet candidates and identify intriguing systems for follow-up analyses.
2 Observations
We conducted our observations using the SpeX instrument on the NASA Infrared Telescope Facility (IRTF) over 15 partial nights during the 2015A, 2015B, 2016A, and 2016B semesters and the TripleSpec instrument on the Palomar 200” over four full nights during the 2016A semester. Eleven of our IRTF/SpeX nights were awarded to C. Dressing via programs 2015B068, 2016A066, and 2016B057; the remaining SpeX time was provided by K. Aller, W. Best, A. Howard, and E. Sinukoff. All of our Palomar time was awarded to C. Dressing for program P08.
As detailed in Table 1, our observing conditions varied from photometric nights to nights with significant cloud cover through which only our brightest targets were observable. As recommended by Vacca et al. (2003), we removed telluric features from our science spectra using observations of A0V stars acquired under similar observing conditions. Accordingly, we interspersed our science observations with observations of nearby A0V stars. When possible, these A0V stars were within of our target stars and observed within one hour at similar airmasses (difference airmasses).
| Date | Seeing | Weather | K2 | |||
|---|---|---|---|---|---|---|
| Semester | Instru | Program | (UT) | Conditions | TargetsaaWe observed some stars twice on two different nights to assess the repeatability of our analysis. | |
| 2015A | SpeX | 989 | Apr 16, 2015 | Clear | 2bbNight awarded to Andrew Howard. | |
| SpeX | 989 | May 5, 2015 | Light wind, clear | 5ccNight awarded to Andrew Howard, but observations obtained by Joshua Schlieder. | ||
| SpeX | 981 | June 13, 2015 | Cirrus, patchy clouds | 2ddObservations obtained by Evan Sinukoff. | ||
| 2015B | SpeX | 057, 068 | Aug 7, 2015 | Clear at start; closed early due to high humidity | 3eeIncludes one observation acquired by Will Best (Program 057) and two acquired by Courtney Dressing (Program 068). | |
| SpeX | 068 | Sep 24, 2015 | Patchy clouds cleared slightly overnight | 20 | ||
| SpeX | 072 | Oct 14, 2015 | Cirrus | 1ffObservations obtained by Kimberly Aller. | ||
| SpeX | 068 | Nov 26, 2015 | Patchy clouds; high humidity | 16 | ||
| SpeX | 068 | Nov 27, 2015 | Cirrus | 16 | ||
| 2016A | TSPEC | P08 | Feb 19, 2016 | Cirrus clouds at start; moderately cloudy by morning | 3 | |
| SpeX | 066 | Mar 4, 2016 | Clear | 10 | ||
| SpeX | 066 | Mar 8, 2016 | Thick, patchy clouds at sunset; thinner clouds by morning | 12 | ||
| SpeX | 986 | Mar 10, 2016 | Cirrus | 5ggNight awarded to Andrew Howard, but observations obtained by Courtney Dressing. | ||
| TSPEC | P08 | Mar 27, 2016 | Clear | 15 | ||
| TSPEC | P08 | Mar 28, 2016 | Patchy clouds; closed early due to high humidity & fog | 9 | ||
| TSPEC | P08 | April 18, 2016 | Clear | 11 | ||
| SpeX | 066 | May 5, 2016 | Patchy clouds | 11 | ||
| SpeX | 066 | May 6, 2016 | Clear | 6 | ||
| SpeX | 066 | June 7, 2016 | Clear | 8 | ||
| 2016B | SpeX | 057 | Oct 26, 2016 | Clear | 5 |
2.1 IRTF/SpeX
For our SpeX observations, we selected the slit and observed in SXD mode to obtain moderate resolution () spectra (Rayner et al., 2003, 2004). Due the SpeX upgrade in 2014, our spectra include enhanced wavelength coverage from 0.7 - 2.55 m.
We carried out all of our observations using an ABBA nod pattern with the default settings of 75 separation between positions A and B and 375 separation between either pointing and the ends of the slit. For all targets except close binary stars, we aligned the slit with the parallactic angle to minimize systematic effects in our reduced spectra; for binary stars, we rotated the slit so that the sky spectra acquired in the B position would be free of contamination from the second star or so that spectra from both stars could be captured simultaneously. We scaled the exposure times for our targets and repeated the ABBA nod pattern as required so that the resulting spectra would have S/N of per resolution element.
We calibrated these spectra by running the standardized IRTF calibration sequence every few hours during our observations and ensuring that each region of the sky had a separate set of calibration frames. The calibration sequence includes flats taken using an internal quartz lamp and wavelength calibration spectra acquired using an internal thorium-argon lamp.
2.2 Palomar/TripleSpec
We acquired our TripleSpec observations using the fixed slit, which yields simultaneous coverage between 1.0 and 2.4 m at a spectral resolution of (Herter et al., 2008). In order to decrease the effect of bad pixels on the detector, we adopted the 4-position ABCD nod pattern used by Muirhead et al. (2014) rather than the 2-position ABBA pattern we used for our SpeX observations. With the exception of double star systems for which we altered the slit rotation to place both stars in the slit when possible, we left the slit in a fixed East-West orientation. We calibrated our spectra using dome darks and dome flats acquired at both the beginning and end of the night.
| Campaign | Total | Classification in This Paper | |||||
|---|---|---|---|---|---|---|---|
| Field | RA | Dec | Galactic | Targets | Cool | Hotter | |
| Number | (hh:mm:ss) | (dd:mm:ss) | Latitude (∘) | Observed | Dwarfs11Two K2 targets (EPIC 211694226 and EPIC 212773309) have nearby companions that may or may not be physically associated. We classified 74 cool dwarfs in 72 systems. | Dwarfs | Giants |
| 1 | 11:35:46 | 10 | 9 (90%) | 1 (10%) | 0 (0%) | ||
| 2 | 16:24:30 | 8 | 0 (0%) | 4 (50%) | 4 (50%) | ||
| 3 | 22:26:40 | 12 | 6 (50%) | 5 (42%) | 1 (8%) | ||
| 4 | 03:56:18 | 24 | 10 (42%) | 10 (42%) | 4 (17%) | ||
| 5 | 08:40:38 | 41 | 27 (66%) | 13 (32%) | 1 (2%) | ||
| 6 | 13:39:28 | 34 | 16 (47%) | 12 (36%) | 6 (18%) | ||
| 7 | 19:11:19 | 17 | 6 (35%) | 4 (24%) | 7 (41%) | ||
| 146 | 74 (51%) | 49 (34%) | 23 (16%) | ||||
3 Target Sample
The objective of our observing campaign was to determine the properties of K2 target stars and assess the planethood of associated planet candidates. Consequently, our targets were selected from lists of K2 planet candidates compiled by A. Vanderburg and the K2 California Consortium (K2C2). These early target lists are preliminary versions of planet candidate catalogs such as those published in Vanderburg et al. (2016) and Crossfield et al. (2016).
Of the 144 K2 targets observed, 99 (69%) appear in unpublished lists provided by A. Vanderburg, 28 (19%) were published in the Vanderburg et al. (2016) catalog, and 77 (53%) were reported in previously unpublished lists generated by K2C2. (These totals sum to due to partial overlap between the Vanderburg and K2C2 candidate lists.) The K2C2 planet candidates from K2 Campaigns were later published in Crossfield et al. (2016). Although we did not consult these catalogs for initial target selection, our target sample also contains 46 systems from Barros et al. (2016), 26 stars from Pope et al. (2016), 5 stars from Foreman-Mackey et al. (2015), 5 stars from Montet et al. (2015), and 4 stars from Adams et al. (2016).
The Vanderburg and K2C2 catalogs contain all of the planet candidates detected by the corresponding pipeline (K2SFF and TERRA, respectively) in the K2 light curves of stars proposed as individual Guest Observer targets. Neither pipeline considers stars observed as part of “super-stamps.” Due to the heterogenous nature of the K2 target lists and the limited information provided in the EPIC during early K2 campaigns, the selected target sample is heavily biased. As noted by Huber et al. (2016), the K2 target lists are biased toward cool dwarfs. Overall, the set of stars observed during Campaigns 1–8 consisted primarily of K and M dwarfs (41%), F and G dwarfs (36%), and K giants (21%), but the giant fraction was higher for fields close to the galactic plane (see Table 2) than for fields at higher galactic latitude (Huber et al., 2016). Many Guest Observers used a magnitude cut when proposing targets, which may have increased the representation of multiple star systems within the selected sample.
Due to the design of the K2 mission, our K2 targets were concentrated in distinct fields of the sky each spanning roughly 100 square degrees. We note the number of targets observed from each campaign in Table 2. As shown in Figure 1, the magnitude distribution of our K2 targets ranged from in Ks, with a median Ks magnitude of 10.8. In the Kepler bandpass (similar to -band), our targets had brightnesses of and a median brightness of .
With each K2 data release, we initially prioritized observations of stars harboring small planet candidates (estimated planet radius ) and systems that could potentially be well-suited for high-precision radial velocity observations (host star brighter than and estimated radial velocity semi-amplitude m/s). Once we had exhausted the those targets, we worked down the target list and observed increasingly fainter host stars harboring larger planets. Our goal was to select late K dwarfs and M dwarfs, but the initial stellar classifications were uncertain, particularly for the first K2 fields when the Huber et al. (2016) EPIC stellar catalog was not yet available. To ensure that few low-mass stars were excluded from our analysis, we adopted lenient criteria when selecting potential target stars. Our rough guidelines were and, for stars with coarse initial temperature estimates, temperature cooler than 4900K. Concentrating on the brightest targets biased our sample towards giant stars and binary stars. Similarly, our selected color-cut also boosted the giant fraction by excluding hotter dwarfs with bluer colors without discarding giant stars with extremely red colors. The binary boost due to prioritizing bright targets may have been partially offset by our avoidance of stars with nearby companions detected in follow-up adaptive optics images.

4 Data Analysis &
Stellar Characterization
We performed initial data reduction using the publicly-available Spextool pipeline (Cushing et al., 2004) and a version customized for use with TripleSpec data (available upon request from M. Cushing). Both versions of the pipeline include the xtellcor telluric correction package (Vacca et al., 2003). As recommended in the Spextool manual, we selected the Paschen line at m when generating the convolution kernel used to apply the observed instrumental profile and rotational broadening to the Vega model spectrum.
4.1 Initial Classification
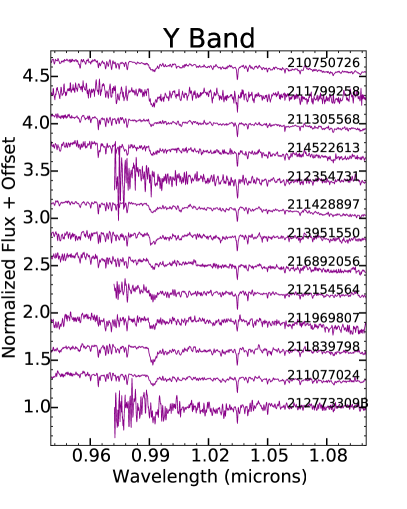
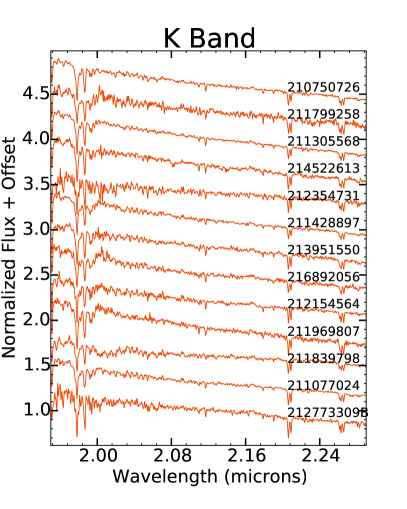
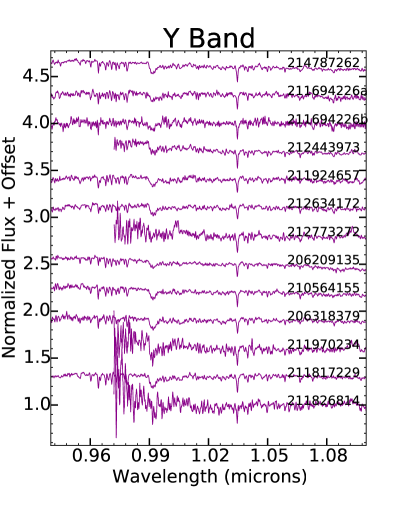
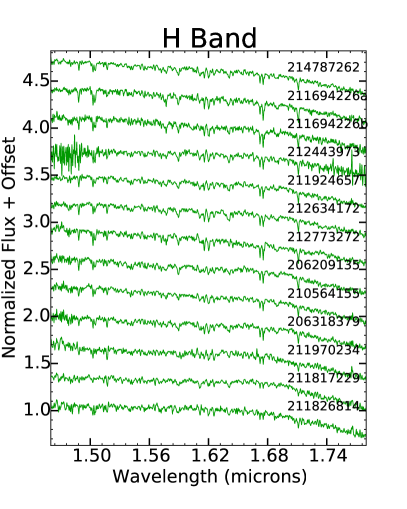
After completing the Spextool reduction, we used an interactive Python-based plotting interface to compare our spectra to the spectra of standard stars from the IRTF Spectral Library (Rayner et al., 2009). We allowed each model spectrum to shift slightly in wavelength space to accommodate differences in stellar radial velocities. Considering the , , and bandpasses independently, we assessed the of a fit of each model spectrum to our data and recorded the dwarf and giant models with the lowest .
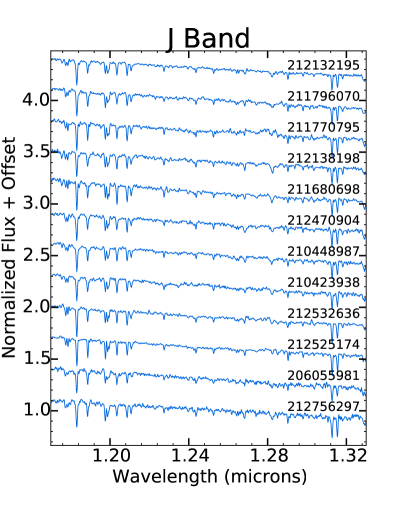
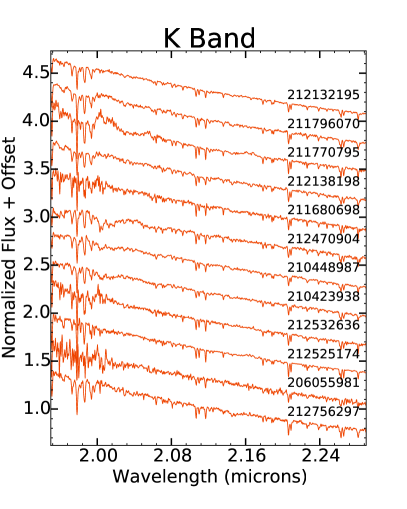
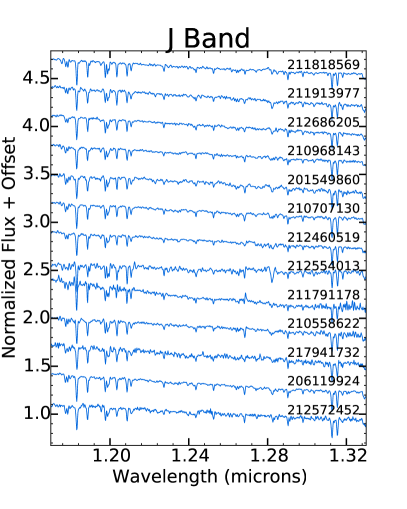
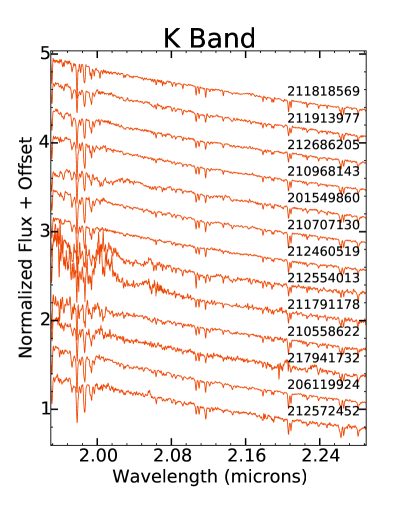
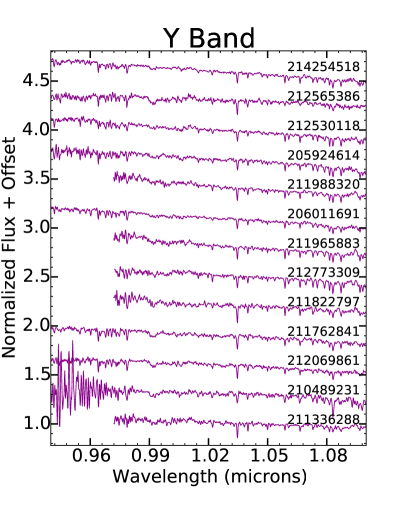
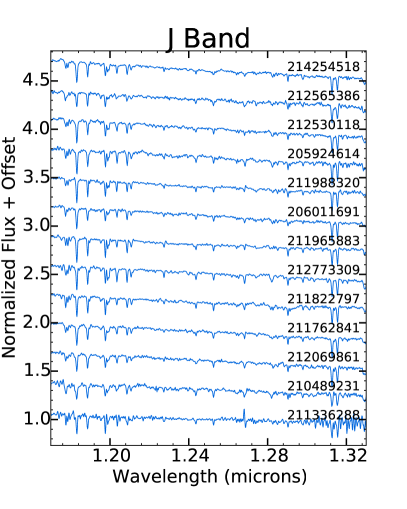
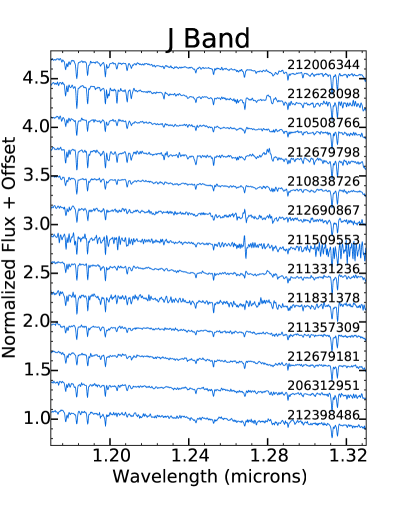
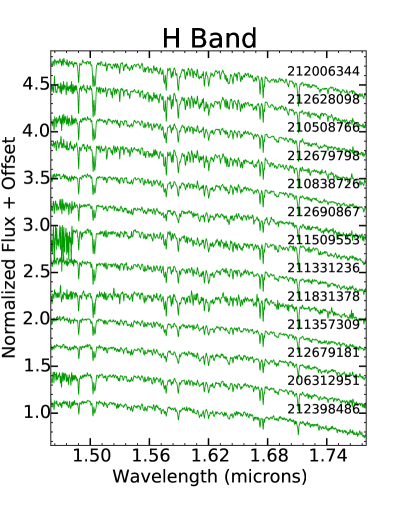
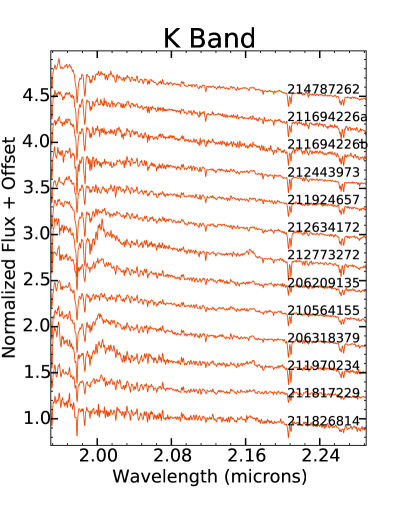
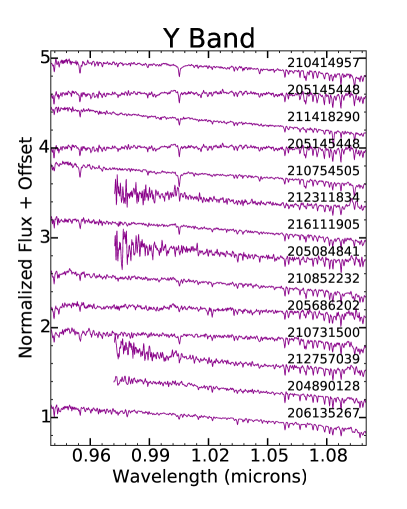
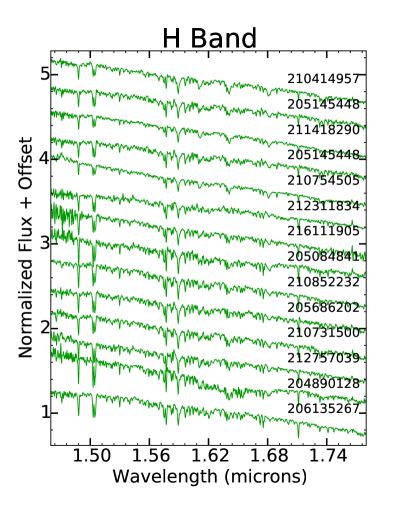
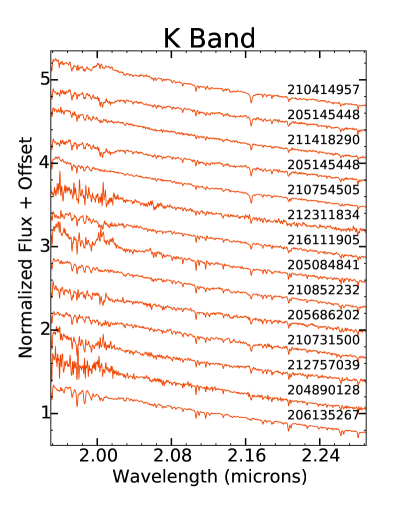
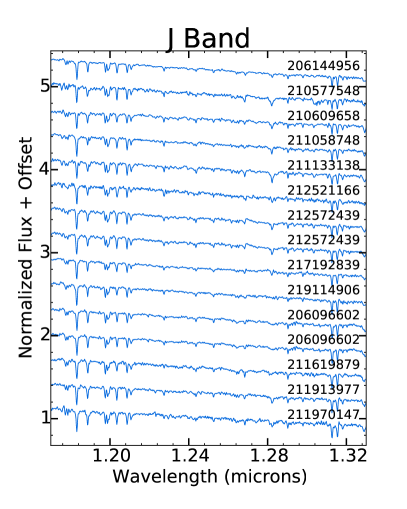
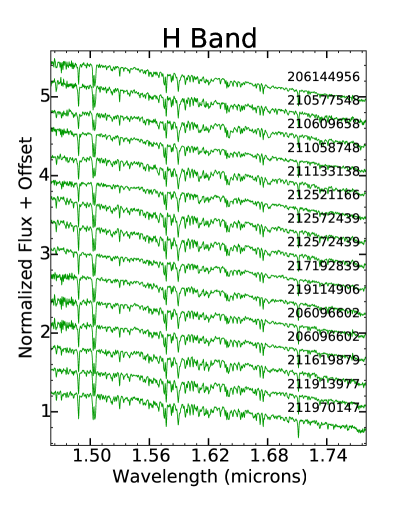
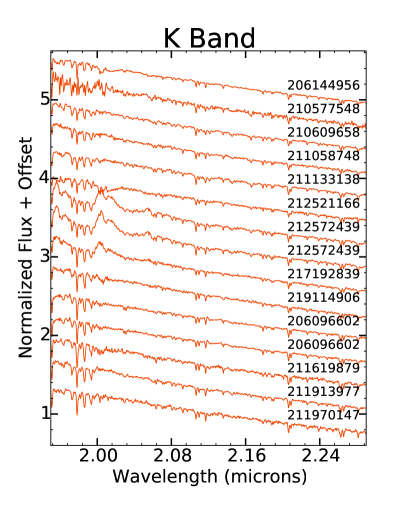
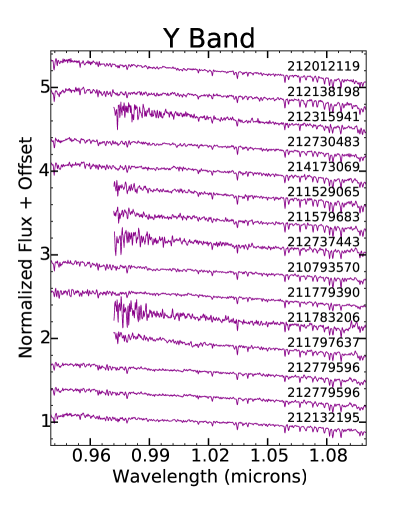
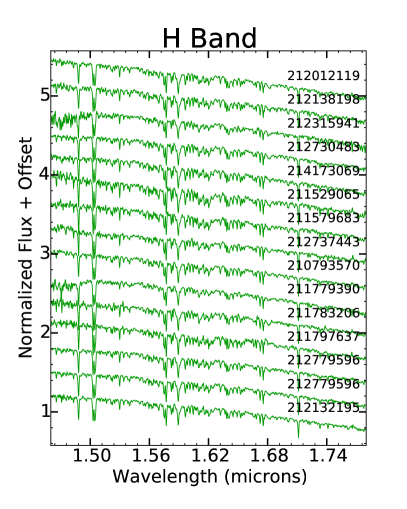
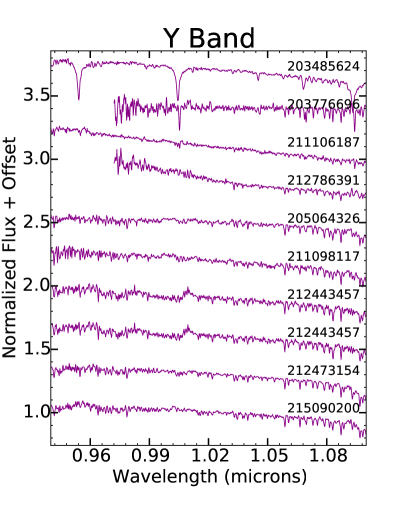
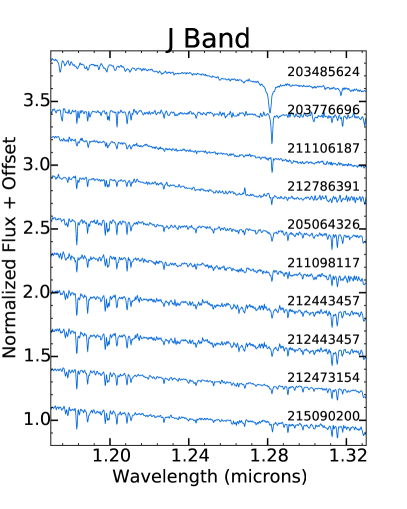
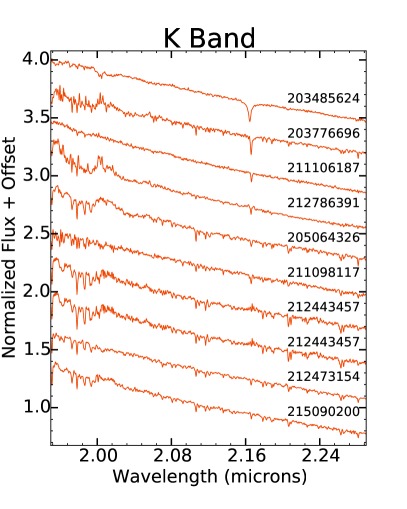
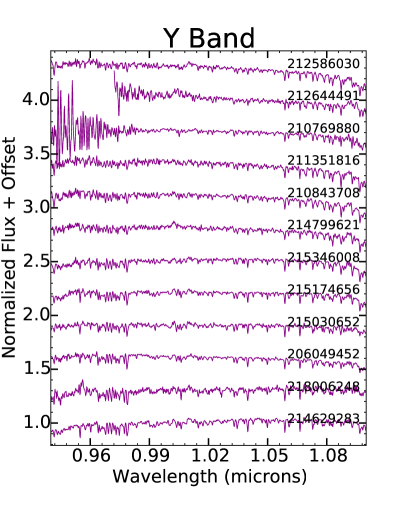
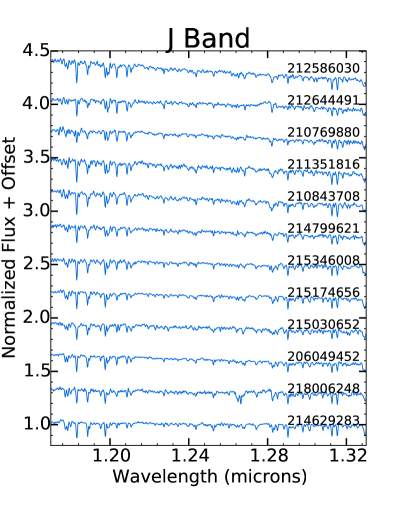
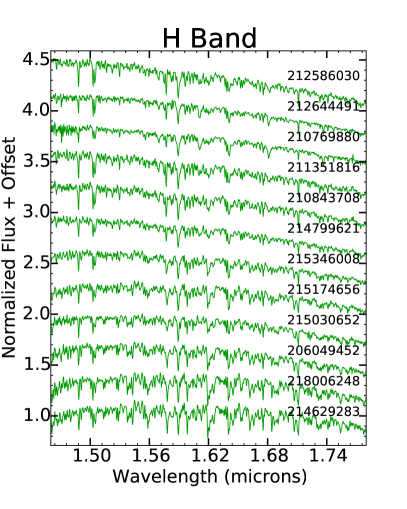
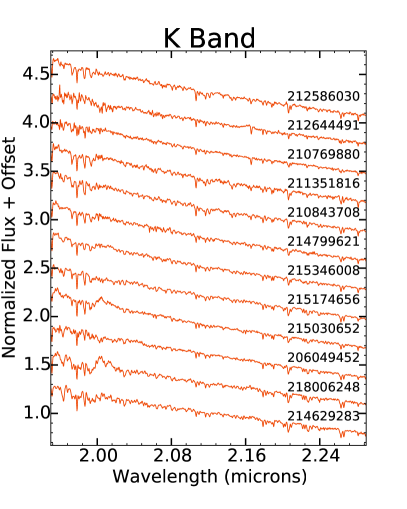
We then considered the target spectrum holistically and assigned a single classification to the star. Although the focus of this analysis was to characterize planetary systems orbiting low-mass dwarfs, our target sample did include contamination from hotter and evolved stars. We list the 23 giants and 49 hotter dwarfs in Tables 3 and 4, respectively. We did not include either group in the more detailed analyses described in Section 4.2. For the purposes of identifying contamination, we rejected all stars that we visually classified as giants or dwarfs with spectral types earlier than K3. Table 4 also includes all stars for which the Newton et al. (2015) routines yielded estimated temperatures above 4800K or radii larger than (see Section 4.2). We display the reduced spectra for all targets in Appendix A. We have also posted our spectra and stellar classifications on the ExoFOP-K2 follow-up website.111https://exofop.ipac.caltech.edu/k2/
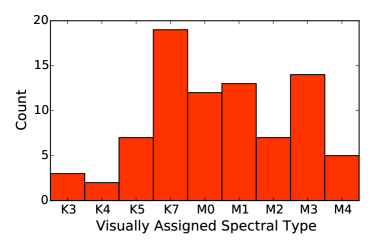
Figure 2 displays the spectral type distribution of the stars in the selected cool dwarf sample. The sample includes stars with spectral types between K3 and M4, with a median spectral type of M0. These spectral types are rather coarse visual assignments ( subclass), so the spike at M3V may be a quirk of the particular template stars used for spectral type assignment rather than a true feature of the distribution. Due to the small sample size, the spike can also be explained by Poisson counting errors.
4.2 Detailed Stellar Characterization
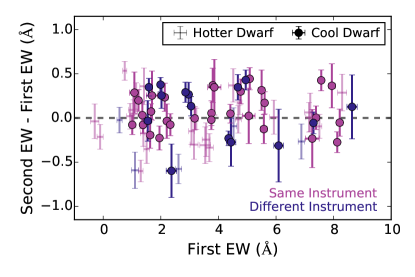
For the stars that were visually identified as dwarfs with spectral types of K3 or later, we used a series of empirical relations to refine the stellar classification. We began by using the publicly-available, IDL-based tellrv222https://github.com/ernewton/tellrv and nirew333https://github.com/ernewton/nirew packages developed by Newton et al. (2014, 2015) to shift each spectrum to the stellar rest frame on an order-by-order basis, measure the equivalent widths of key spectral features, and estimate stellar properties. Specifically, the packages employ empirically-based relations linking the equivalent widths of H-band Al and Mg features to stellar temperatures, radii, and luminosities (Newton et al., 2015). These relations are appropriate for stars with spectral types between mid-K and mid-M (i.e., temperatures of K, radii of , and luminosities of ). The relations were calibrated using IRTF/SpeX spectra (Newton et al., 2015) so we downgraded the Palomar/TSPEC spectra to match the lower resolution of IRTF/SpeX data before applying the relations. We note that neglecting the change in resolution can lead to systematic differences in the measured EW due to variations in the amount of contamination included in the designated wavelength interval (Newton et al., 2015). As shown in Figure 3, we find generally consistent equivalent widths in spectra acquired on different occasions even if the two observations used separate instruments under variable observing conditions. Specifically, the median absolute difference in equivalent widths for the five cool dwarfs with repeated measurements using the same instrument was 0.2Å(). The median absolute difference for the three cool dwarfs with measurements from different instruments was 0.3Å().
In the original formulation of the measure_hband stellar characterization routine, the errors on stellar parameters are determined via a Monte Carlo simulation in which multiple realizations of noise are added to the spectra and the equivalent widths of features are re-measured. The errors are then determined by combining the random errors in the resulting EWs with the intrinsic scatter in the relations. This approach yields useful errors, but the adopted stellar parameters are taken from a single realization of the noise. For high SNR spectra, variations in the simulated noise might not lead to large changes in stellar properties, but for lower SNR spectra the estimated properties can differ considerably from one realization to the next. Several of our spectra have SNR of less than 200, which was the threshold used in the Newton et al. (2014) study. Accordingly, we altered measure_hband to calculate the temperatures, luminosities, and radii for each realization of the noise and report the 50th, 16th, and 84th percentiles as the best-fit values, lower error bars, and upper error bars, respectively.
Our changes significantly improve the reproducibility of temperature, luminosity, and radius estimates for stars with lower SNR spectra. For example, we repeated the classification of the M2 dwarf EPIC 206209135 five times using both the original and modified versions of measure_hband. For each classification, we determined parameter errors by generating 1000 noise realizations. The original code yielded estimated temperatures ranging from K, radii of , and . The variations in the assigned temperatures and luminosities of 194 K and were significantly larger than the individual error estimates of K and and the spread in assigned radii of was equal to the individual radius errors. In comparison, our new method found K, , and in all cases. Due to the asymmetry of the resulting temperature and radius distributions for some stars, we also report separate upper and lower error bounds instead of forcing the errors to be symmetric in all cases. (EPIC 2106209135 is an example of a star with naturally symmetric errors.)
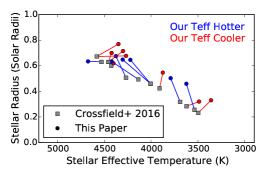
We confirmed that our cool dwarf classifications were repeatable by comparing our parameter estimates for the fifteen stars observed on two different observing runs. Figure 4 reveals satisfactory agreement in the temperature and radius estimates for the eight stars cooler than 4800K, the designated upper limit for our cool dwarf sample. Our results for the seven hotter stars are less consistent, but the relations from Newton et al. (2015) are not valid at those temperatures.
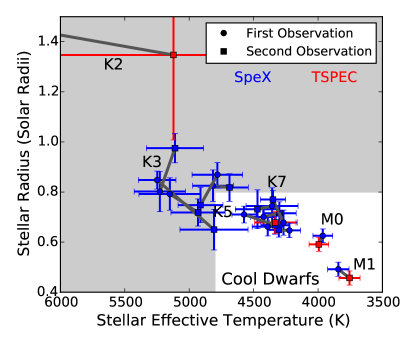
K, .
4.2.1 Stellar Effective Temperature
For comparison, we also determined stellar effective temperatures using the -, -, and -band temperature-sensitive indices and relations presented by Mann et al. (2013b). We then applied the temperature–metallicity–radius relation from Mann et al. (2015) to assign stellar radii. Next, we determined luminosities and masses from the estimated stellar effective temperatures using relations 7 & 8 from Mann et al. (2013b). These relations are based on stars with effective temperatures between 3238K and 4777K and radii between and .
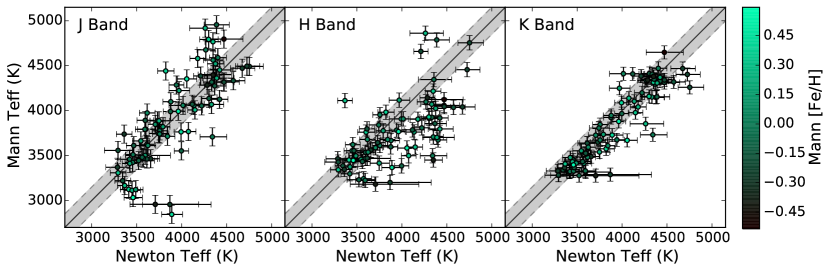
In Figure 5, we plot the temperature estimates generated using the Newton et al. (2015) pipeline against those from the Mann et al. (2013b) relations. The Mann -band based temperatures display considerable scatter and are systematically lower than the three other estimates (the temperatures based on the Newton et al. (2015) routines, the -band temperatures, and the -band temperatures). This discrepancy, which is most noticeable for stars hotter than 4000K, is likely caused by saturation of the index as the continuum flattens for hotter stars. The -band temperatures also display large scatter, but they are more centered along a one-to-one relation than the -band estimates. Due to the much tighter correlation observed between the -band temperatures and the EW-based temperature estimates, we adopt the -band temperatures as the “Mann temperatures” for our stars. We also see discrepancies for stars with . There are three stars for which the temperature inferred using the Newton et al. (2015) relations is larger than that inferred from the J, H and K band temperatures, The error bars in the temperature inferred from the Newton et al. (2015) relations are also large. This is caused by the disappearance of the Mg and Al features in the coolest dwarf stars, which tends to result in an overestimate of Teff. Al is weaker at lower metallicity, consistent with this effect only being seen in metal-poor stars at the limits of the calibration.
Newton et al. (2015) also compared temperature estimates derived using their empirical relations with those based on the Mann et al. (2013b) temperature-sensitive indices. They found large standard deviations of K and K in -band and -band, respectively, between temperatures determined using each method, which they attributed to telluric contamination. In contrast, the standard deviation between the Newton et al. (2015) estimates and the Mann et al. (2013b) -band estimates was only = 90 K, suggesting that the -band relation is less contaminated by telluric features.
For our sample of stars, the agreement between the two methods is much worse: we measure standard deviations of 278 K, 311 K, and 162 K for the temperature differences between the EW-based estimates and the estimates based on the -band, -band, and -band spectral indices, respectively. The median temperature differences are 13 K, 143 K, and 64 K for -band, -band, and -band, respectively, with the EW-based estimates higher than the spectral index-based estimate for - and -band and lower for -band. The significantly poorer agreement is likely due to the differences between the Newton et al. (2015) stellar sample and our stellar sample. The Newton et al. (2015) sample was dominated by mid- and late-M dwarfs with effective temperatures between 3000 K and 3500 K. In contrast, our targets are primarily late K dwarfs and early M dwarfs.
For an additional check on our stellar classifications, we applied the H2O-K2 index - spectral type relation calibrated by Newton et al. (2014) to estimate near-infrared spectral types. The H2O-K2 index (Rojas-Ayala et al., 2012) provides an estimate of the level of water absorption in an M dwarf spectrum by measuring the shape of the spectrum between 2.07m and 2.38m. Higher values indicate lower H2O opacity and therefore hotter temperatures. The H2O-K2 index is the second-generation version of the H2O-K index introduced by Covey et al. (2010) and uses slightly different portions of the spectrum to avoid contamination from atomic lines in early M dwarfs. The index is gravity-insensitive for stars with effective temperatures between 3000K and 3800K and metallicity-insensitive for stars cooler than 4000K. The H2O-K2 index saturates near 4000K, so these index measurements and spectral types are not valid for the hotter stars in our sample.
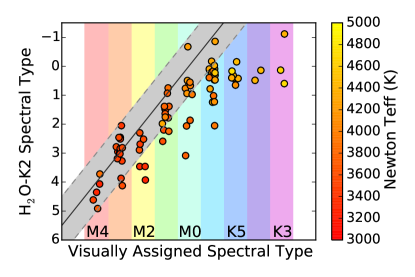
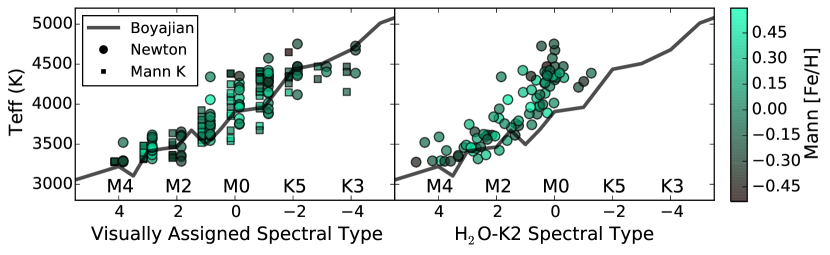
As shown in Figure 6, our visually assigned spectral types and the index-based spectral types agree well for stars cooler than roughly 3800K. Above this temperature, the index-based spectral types plateau near M1 due to the inapplicability of the index for the earliest M dwarfs. The saturation of the H2O-K2 index is highlighted in Figure 7, which provides an alternative comparison of our spectral type assignments and temperature estimates. In the left panel, we show that our visually-assigned spectral types display the expected correlation with temperature throughout the spectral type range of our sample. In contrast, the index-based spectral types deviate from the expected correlation for stars earlier than M1V. We list the visually-assigned and index-based spectral types for the cool dwarf sample in Table 5.
4.2.2 Stellar Metallicities
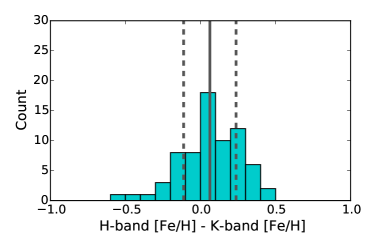
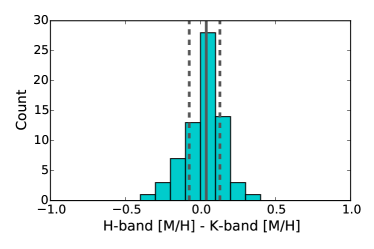
We estimated [Fe/H] and [M/H] using the relations from Mann et al. (2013a). The latest stars in our sample are M4 dwarfs, so we did not need to transition from the metallicity relations for K7M5 dwarfs provided by Mann et al. (2013a) to the relations for M4.5M9.5 dwarfs from Mann et al. (2014). We calculated metallicities using -band and -band spectra separately and compare the resulting distributions of [Fe/H] and [M/H] in Figure 8. On average, a typical star in our cool dwarf sample has near-solar metallicity. Averaging the -band and -band estimates for each star, we obtain median metallicities of [Fe/H] and [M/H]. Figure 8 also displays distributions of the differences between the -band and -band metallicity estimates; they agree at the level. Although our cool dwarf sample includes 11 mid-K dwarfs, we restricted our metallicity analysis to the 63 cool dwarfs with spectral types of K7 or later.


4.2.3 Stellar Radii
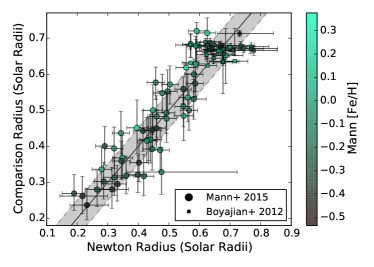
We infer stellar radius using the methods from Newton et al. (2015) and Mann et al. (2015). The former are derived directly from the EWs. The latter use and metallicity to estimate radii indirectly; for we use the -band temperatures (which we refer to as “Mann temperatures”, see Section 4.2.1). The Mann et al. (2015) temperature-metallicity-radius relation is valid for stars with temperatures between 2700K and 4100K, but many of the stars in our sample are hotter than this upper limit. For the stars for which the Mann et al. (2015) relations yield temperatures hotter than 4100K, we instead compare the Newton et al. (2015) radii to the radii estimated by applying the temperature-radius relation provided in Equation 8 of Boyajian et al. (2012) using the Mann temperatures.
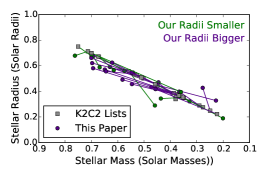
We display the resulting radius estimates in Figure 9. The Mann et al. (2015) methodology and the Newton et al. (2015) routines yield similar radii: the median radius difference is (the Mann radii are larger) and the standard deviation of the differences is . For comparison, the median reported radius errors are for the Newton et al. (2015) values and for the Mann et al. (2015) values. Looking at the hotter stars, the median difference between the Newton radii and Boyajian et al. (2012) radii is only and the standard deviation of the difference is

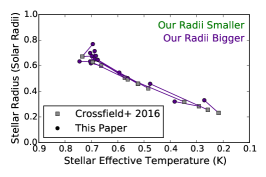
As shown in Figure 10, the primary reason why the temperature agreement looks worse for the coolest stars is because three cool stars (EPIC 211817229, EPIC 211799258, and EPIC 211826814) have significantly different parameters using the two methods. Based on the sample of stars with interferometrically constrained properties, the expected temperatures and radii of M5.5M3 dwarfs are K and , respectively (Boyajian et al., 2012). Although these stars were visually classified as M3 or M4 dwarfs, the Newton et al. (2015) routines assigned them high temperatures of K because the Al-a EW measured in their spectra were below the lower limit of the calibration sample (see Table 7 for EW measurements). The Mann routines assigned the stars cooler temperatures of K. Due to the better agreement between the Mann temperatures and expected temperatures of mid-M dwarfs, we chose to adopt the Mann et al. classifications for those three stars.
4.2.4 Stellar Luminosities
We compared the stellar luminosities estimated using the EW-based relation from Newton et al. (2015) to those found using the temperature-luminosity relation from Mann et al. (2013b). Due to the functional nature of the Mann et al. (2013b) relation, the Mann values followed a single track whereas the Newton values displayed scatter about that relation. Ignoring the three mid-M dwarfs that are too cool for the Newton relations, the luminosity differences (Newton - Mann) have a median value of and a standard deviation of . The scatter increases as temperature increases. Dividing the sample into stars hotter and cooler than 4000 K, the luminosity differences for cooler sample have a median value of and a standard deviation of while the hotter sample has a median value of and a standard deviation of . In the left panel of Figure 11, we display the adopted luminosities as a function of effective temperature.
4.2.5 Stellar Masses
The Newton et al. (2015) relations do not include masses, so we computed the masses for all stars using the stellar effective temperature - mass relation from Mann et al. (2013b). The right panel of Figure 11 displays the resulting mass estimates as a function of stellar radius.

4.3 Adopted Properties
After checking that the results from both classification schemes are generally consistent, we adopted parameters based on the Newton et al. (2015) relations when possible because the calibrations are valid for hotter stars (K versus K), and because EWs are less susceptible to telluric contamination than the indices used by Mann et al. (2013b). Furthermore, the Mann et al. (2013b) temperature calibrations have inflection points while the Newton et al. (2015) relations do not.
Specifically, we report temperatures, radii, and luminosities estimated using the Newton et al. (2015) relations, metallicities based on the Mann et al. (2013a) relations, masses generated by running the Newton temperatures through the temperature-mass relation from Mann et al. (2013b), and surface gravities computed from the radii and masses. (The exceptions are EPIC 211817229, EPIC 211799258, and EPIC 211826814, for which we adopt the Mann parameters as explained in Section 4.2.3.) The Newton et al. (2015) relations are not valid for early K dwarfs, so we rejected all of the stars with assigned temperatures hotter than 4800 K or radii larger than .
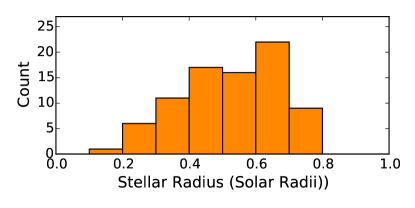
As shown in the left panel of Figure 12, our cool dwarf sample has a median radius of . The temperature distribution in the right panel is bimodal, featuring a peak near 3500 K from the mid-M dwarfs in the sample and a second peak near 4350 K from late K dwarfs. The median value of the distribution is 3884 K.

Our final cool dwarf sample consists of 74 stars in 72 systems; EPIC 211694226 and EPIC 212773309 are visual binaries. We obtained spectra of both components and consider all four stars as possible planetary host stars. As of 24 August 2016, there were no AO images of either system posted on the ExoFOP-K2 follow-up website. Using our data, we measured separations of roughly and , respectively. The companion star to EPIC 212773309 is likely 2MASS J13493168-0619267, which is listed on ExoFOP-K2 website444https://exofop.ipac.caltech.edu/k2/edit_target.php?id=212773309 at a separation of . 2MASS J13493168-0619267 is 2.6 magnitudes fainter than EPIC 212773309 and far enough away to lie outside the K2 target aperture. In contrast, both stars in the EPIC 211694226 system could fall within a single K2 pixel.
The adopted parameters for the EPIC 211694226 and EPIC 212773309 visual binaries and all of the other stars in our cool dwarf sample are reported in Tables 6. For reference, we also provide the intermediate measurements in Table 7 along with our metallicity estimates.

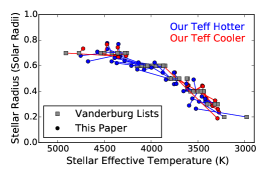

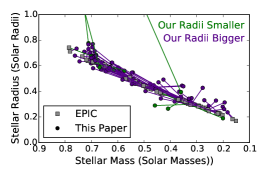


As shown in Figure 13, three of the stars in our cool dwarf sample were initially classified as giants in the EPIC. Considering only the stars originally classified as dwarfs, the median changes between our revised estimates and the EPIC values are (+26%), (+39%), and K (%). For the 15 cool dwarfs with previous published estimates in Crossfield et al. (2016), we find median changes of (+23%), (+28%), and K (%). We find smaller radius changes (, +8%) but larger temperature changes ( K, +2%) for the nine cool dwarfs with earlier estimates from Vanderburg et al. (2016). Consulting the unpublished planet candidate lists in which the stellar parameters are only coarsely estimated, we find median changes of (+4%) and K (+2%) for the 56 cool dwarfs in lists provided by A. Vanderburg and (+22%) and (+17%) for the 28 cool dwarfs in lists from the K2C2 Consortium.
Martinez et al. (2017) recently completed a parallel study in which they estimated the properties of low-mass K2 planet host stars using NTT/SOFI spectra covering the wavelength range. Although their spectra are lower resolution than our data ( rather than , they report consistent parameters for most of the 15 stars observed by both studies. Specifically, the median differences between our estimates (Dressing - Martinez) are 61K, , and .
5 Discussion & Conclusions
In this paper, we presented revised system parameters for 144 targets observed by the NASA K2 mission. All of those stars were initially suspected to be cool dwarfs harbor transiting planets, but some of these systems have since been revealed to be false positives. Comparing our IRTF/SpeX and Palomar/TripleSpec spectra to standard spectra from the IRTF Spectral Library (Rayner et al., 2009), we found that 49% of our targets were contaminating giants or hotter dwarfs.
Intriguingly, one star (EPIC 211817229) has large proper motion (380 mas/yr Roeser et al., 2010) and moderate radial velocity (28 km/s), indicating that the star likely does not belong to the thin disk population. Accordingly, we used the measured position, proper motion, and radial velocity of EPIC 211817229 along with an estimated photometric distance of pc (Pecaut & Mamajek, 2013), to calculate the star’s UVW Galactic velocities corrected for the Sun’s velocity (Coşkunoǧlu et al., 2011). We estimated km/s.
We then compared the Galactic velocities of EPIC 211817229 to distributions proposed in Bensby et al. (2014) that approximately define the thin disk, thick disk, and halo populations. The total Galactic velocity of EPIC 211817229, km/s, is consistent with the thick disk population ( km/s). The placement of the star in a Toomre diagram and the estimated probability of membership in the three populations (Bensby et al., 2014, Appendix A) also point to a star in the thick disk. This kinematic classification is consistent with EPIC 211817229 being metal poor and suggests an old age.
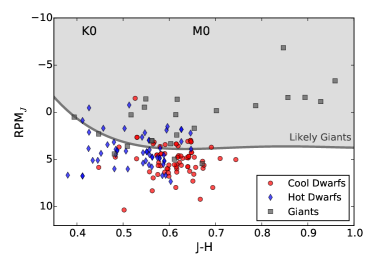
After classifying all of our targets, we revisited the initial selection of our sample to ask whether we could better identify low-mass stars in the future. As shown in the -band reduced proper motion () versus color plot in Figure 14, one possible avenue for improvement is to impose stricter cuts on the color and reduced proper motions of the target stars. For instance, confining our follow-up sample to stars with would have decreased the giant contamination by 30% and hot dwarf contamination by 18% while excluding only one cool dwarf from our sample. Imposing a further cut of would decrease giant contamination by an additional 35% and hot dwarf contamination by an additional 2% at the cost of excluding two more cool dwarfs. Employing the more complicated polynomial cut suggested by Collier Cameron et al. (2007) would remove 74% of the giants and 29% of the hot dwarfs along with 31% of the cool dwarfs.
The main focus of this work was the sample of 74 cool dwarfs with spectral types between K3 and M4. For those stars, we estimated temperatures, radii, masses, luminosities, and metallicities using empirical relations (Mann et al., 2013a, b, 2015; Newton et al., 2015). In most cases, we found that the original radius estimates were smaller than the actual radii of the stars: our revised estimates are typically (39%) larger than the values reported in the EPIC (Huber et al., 2016), (28%) larger than the values in Crossfield et al. (2016), and (8%) larger than those in Vanderburg et al. (2016).
We defer a detailed discussion of the planetary implications of our revisions to the stellar parameters to the next paper in this series (Dressing et al., 2016), but assuming that the initial planet/star radius ratios are correct, we predict that the associated planet candidates are also larger than initially estimated. Accordingly, potentially habitable Earth-sized planets orbiting stars originally believed to be small, cool M dwarfs may be larger and significantly less habitable than previously inferred. This result underscores the importance of characterizing TESS planet host stars before acquiring detailed atmospheric observations with JWST and the next-generation of extremely large ground-based telescopes.
References
- Adams et al. (2016) Adams, E. R., Jackson, B., & Endl, M. 2016, ArXiv e-prints, arXiv:1603.06488
- Alam et al. (2015) Alam, S., Albareti, F. D., Allende Prieto, C., et al. 2015, ApJS, 219, 12
- Allard et al. (2011) Allard, F., Homeier, D., & Freytag, B. 2011, in Astronomical Society of the Pacific Conference Series, Vol. 448, 16th Cambridge Workshop on Cool Stars, Stellar Systems, and the Sun, ed. C. Johns-Krull, M. K. Browning, & A. A. West, 91
- Barros et al. (2016) Barros, S. C. C., Demangeon, O., & Deleuil, M. 2016, ArXiv e-prints, arXiv:1607.02339
- Batalha et al. (2013) Batalha, N. M., Rowe, J. F., Bryson, S. T., et al. 2013, ApJS, 204, 24
- Bensby et al. (2014) Bensby, T., Feltzing, S., & Oey, M. S. 2014, A&A, 562, A71
- Borucki et al. (2010) Borucki, W. J., Koch, D., Basri, G., et al. 2010, Science, 327, 977
- Borucki et al. (2011a) Borucki, W. J., Koch, D. G., Basri, G., et al. 2011a, ApJ, 728, 117
- Borucki et al. (2011b) —. 2011b, ApJ, 736, 19
- Boyajian et al. (2012) Boyajian, T. S., von Braun, K., van Belle, G., et al. 2012, ApJ, 757, 112
- Brown et al. (2011) Brown, T. M., Latham, D. W., Everett, M. E., & Esquerdo, G. A. 2011, AJ, 142, 112
- Burke et al. (2014) Burke, C. J., Bryson, S. T., Mullally, F., et al. 2014, ApJS, 210, 19
- Castelli & Kurucz (2004) Castelli, F., & Kurucz, R. L. 2004, Proceedings of the IAU Symp. No 210; IAU Symp. No 210, Modelling of Stellar Atmospheres, eds. N. Piskunov et al. 2003, poster A20, arXiv:astro-ph/0405087, arXiv:astro-ph/0405087
- Coşkunoǧlu et al. (2011) Coşkunoǧlu, B., Ak, S., Bilir, S., et al. 2011, MNRAS, 412, 1237
- Cohen et al. (2003) Cohen, M., Wheaton, W. A., & Megeath, S. T. 2003, AJ, 126, 1090
- Collier Cameron et al. (2007) Collier Cameron, A., Wilson, D. M., West, R. G., et al. 2007, MNRAS, 380, 1230
- Covey et al. (2010) Covey, K. R., Lada, C. J., Román-Zúñiga, C., et al. 2010, ApJ, 722, 971
- Crossfield et al. (2016) Crossfield, I. J. M., Ciardi, D. R., Petigura, E., et al. 2016, Accepted to ApJ, arXiv:1607.05263
- Cushing et al. (2004) Cushing, M. C., Vacca, W. D., & Rayner, J. T. 2004, PASP, 116, 362
- Demarque et al. (2004) Demarque, P., Woo, J.-H., Kim, Y.-C., & Yi, S. K. 2004, ApJS, 155, 667
- Dotter et al. (2008) Dotter, A., Chaboyer, B., Jevremović, D., et al. 2008, ApJS, 178, 89
- Dressing & Charbonneau (2013) Dressing, C. D., & Charbonneau, D. 2013, ApJ, 767, 95
- Dressing & Charbonneau (2015) —. 2015, ApJ, 807, 45
- Dressing et al. (2016) Dressing, C. D., Newton, E. R., Charbonneau, D., et al. 2016, ApJ, arXiv:in preparation
- Feiden et al. (2011) Feiden, G. A., Chaboyer, B., & Dotter, A. 2011, ApJ, 740, L25
- Foreman-Mackey et al. (2015) Foreman-Mackey, D., Montet, B. T., Hogg, D. W., et al. 2015, ApJ, 806, 215
- Gaidos (2013) Gaidos, E. 2013, ApJ, 770, 90
- Gaidos et al. (2016) Gaidos, E., Mann, A. W., Kraus, A. L., & Ireland, M. 2016, MNRAS, 457, 2877
- Gaidos et al. (2014) Gaidos, E., Anderson, D. R., Lépine, S., et al. 2014, MNRAS, 437, 3133
- Girardi et al. (2000) Girardi, L., Bressan, A., Bertelli, G., & Chiosi, C. 2000, A&AS, 141, 371
- Henry et al. (2006) Henry, T. J., Jao, W.-C., Subasavage, J. P., et al. 2006, AJ, 132, 2360
- Herter et al. (2008) Herter, T. L., Henderson, C. P., Wilson, J. C., et al. 2008, in Proc. SPIE, Vol. 7014, Ground-based and Airborne Instrumentation for Astronomy II, 70140X
- Howell et al. (2014) Howell, S. B., Sobeck, C., Haas, M., et al. 2014, PASP, 126, 398
- Huber et al. (2014) Huber, D., Silva Aguirre, V., Matthews, J. M., et al. 2014, ApJS, 211, 2
- Huber et al. (2016) Huber, D., Bryson, S. T., Haas, M. R., et al. 2016, ApJS, 224, 2
- Kordopatis et al. (2013) Kordopatis, G., Gilmore, G., Steinmetz, M., et al. 2013, AJ, 146, 134
- Luo et al. (2015) Luo, A.-L., Zhao, Y.-H., Zhao, G., et al. 2015, Research in Astronomy and Astrophysics, 15, 1095
- Mann et al. (2013a) Mann, A. W., Brewer, J. M., Gaidos, E., Lépine, S., & Hilton, E. J. 2013a, AJ, 145, 52
- Mann et al. (2014) Mann, A. W., Deacon, N. R., Gaidos, E., et al. 2014, AJ, 147, 160
- Mann et al. (2015) Mann, A. W., Feiden, G. A., Gaidos, E., Boyajian, T., & von Braun, K. 2015, ApJ, 804, 64
- Mann et al. (2013b) Mann, A. W., Gaidos, E., & Ansdell, M. 2013b, ApJ, 779, 188
- Mann et al. (2012) Mann, A. W., Gaidos, E., Lépine, S., & Hilton, E. J. 2012, ApJ, 753, 90
- Marigo & Girardi (2007) Marigo, P., & Girardi, L. 2007, A&A, 469, 239
- Marigo et al. (2008) Marigo, P., Girardi, L., Bressan, A., et al. 2008, A&A, 482, 883
- Martinez et al. (2017) Martinez, A. O., Crossfield, I. J. M., Schlieder, J. E., et al. 2017, accepted to ApJ
- Montet et al. (2015) Montet, B. T., Morton, T. D., Foreman-Mackey, D., et al. 2015, ApJ, 809, 25
- Morton & Swift (2014) Morton, T. D., & Swift, J. 2014, ApJ, 791, 10
- Muirhead et al. (2012) Muirhead, P. S., Hamren, K., Schlawin, E., et al. 2012, ApJ, 750, L37
- Muirhead et al. (2014) Muirhead, P. S., Becker, J., Feiden, G. A., et al. 2014, ApJS, 213, 5
- Newton et al. (2014) Newton, E. R., Charbonneau, D., Irwin, J., et al. 2014, AJ, 147, 20
- Newton et al. (2015) Newton, E. R., Charbonneau, D., Irwin, J., & Mann, A. W. 2015, ApJ, 800, 85
- Osborn et al. (2016) Osborn, H. P., Santerne, A., Barros, S. C. C., et al. 2016, ArXiv e-prints, arXiv:1605.04291
- Pecaut & Mamajek (2013) Pecaut, M. J., & Mamajek, E. E. 2013, ApJS, 208, 9
- Pope et al. (2016) Pope, B. J. S., Parviainen, H., & Aigrain, S. 2016, MNRAS, arXiv:1606.01264
- Rayner et al. (2009) Rayner, J. T., Cushing, M. C., & Vacca, W. D. 2009, ApJS, 185, 289
- Rayner et al. (2004) Rayner, J. T., Onaka, P. M., Cushing, M. C., & Vacca, W. D. 2004, in Proc. SPIE, Vol. 5492, Ground-based Instrumentation for Astronomy, ed. A. F. M. Moorwood & M. Iye, 1498–1509
- Rayner et al. (2003) Rayner, J. T., Toomey, D. W., Onaka, P. M., et al. 2003, PASP, 115, 362
- Roeser et al. (2010) Roeser, S., Demleitner, M., & Schilbach, E. 2010, AJ, 139, 2440
- Rojas-Ayala et al. (2012) Rojas-Ayala, B., Covey, K. R., Muirhead, P. S., & Lloyd, J. P. 2012, ApJ, 748, 93
- Sharma et al. (2011) Sharma, S., Bland-Hawthorn, J., Johnston, K. V., & Binney, J. 2011, ApJ, 730, 3
- Vacca et al. (2003) Vacca, W. D., Cushing, M. C., & Rayner, J. T. 2003, PASP, 115, 389
- Van Cleve & Caldwell (2016) Van Cleve, J. E., & Caldwell, D. A. 2016, Kepler Instrument Handbook (KSCI-19033-002)
- Van Cleve et al. (2016) Van Cleve, J. E., Howell, S. B., Smith, J. C., et al. 2016, PASP, 128, 075002
- van Leeuwen (2007) van Leeuwen, F. 2007, A&A, 474, 653
- Vanderburg et al. (2016) Vanderburg, A., Latham, D. W., Buchhave, L. A., et al. 2016, ApJS, 222, 14
- Winters et al. (2015) Winters, J. G., Henry, T. J., Lurie, J. C., et al. 2015, AJ, 149, 5
| Observation | Spectral | EPIC Classification | ||||||||
|---|---|---|---|---|---|---|---|---|---|---|
| EPIC | Date | Instru | Type11Spectral types are coarse assignments based on visual inspection of the near-infrared spectra collected in this paper. The assigned spectral types have errors of roughly subtype. (See Section 4.1 for details.) | Campaign | (K) | ep_ | em_ | logg (cgs) | ep_logg | em_logg |
| 202710713 | Aug-07-2015 | SpeX | K4III | 2 | 3817 | 92 | 92 | 0.523 | 0.168 | 0.168 |
| 203485624 | Jun-7-2016 | SpeX | F2III | 2 | 6237 | 449 | 187 | 3.848 | 0.228 | 0.020 |
| 203776696 | Mar-27-2016 | TSPEC | F8III | 2 | 6113 | 1219 | 508 | 4.143 | 0.270 | 0.315 |
| 205064326 | Jun-7-2016 | SpeX | K0III | 2 | 4734 | 75 | 75 | 2.946 | 0.144 | 0.144 |
| 206049452 | Sep-24-2015 | SpeX | M2III | 3 | 4553 | 191 | 109 | 4.671 | 0.035 | 0.042 |
| 210769880 | Sep-24-2015 | SpeX | K2III | 4 | 4018 | 118 | 802 | 4.809 | 2.400 | 0.060 |
| 210843708 | Sep-24-2015 | SpeX | K3III | 4 | 4823 | 120 | 90 | 2.456 | 0.075 | 0.450 |
| 211098117 | Sep-24-2015 | SpeX | K0III | 4 | 3858 | 186 | 186 | 4.870 | 0.070 | 0.084 |
| 211106187 | Nov-27-2015 | SpeX | G5III | 4 | 5321 | 96 | 192 | 4.561 | 0.164 | 0.020 |
| 211351816 | Nov-27-2015 | SpeX | K2III | 5 | 4742 | 96 | 76 | 2.984 | 0.483 | 0.345 |
| 212311834 | Apr-18-2016 | TSPEC | M1III | 6 | 5199 | 156 | 188 | 3.631 | 0.890 | 0.890 |
| 212443457 | Mar-8-2016 | SpeX | K0III | 6 | 4804 | 144 | 173 | 4.598 | 0.025 | 0.030 |
| 212443457 | Jun-7-2016 | SpeX | K0III | 6 | 4804 | 144 | 173 | 4.598 | 0.025 | 0.030 |
| 212473154 | Jun-7-2016 | SpeX | K0III | 6 | 4570 | 136 | 136 | 2.365 | 0.682 | 0.186 |
| 212586030 | Mar-8-2016 | SpeX | K1III | 6 | 4814 | 76 | 76 | 3.328 | 0.144 | 0.144 |
| 212644491 | Apr-18-2016 | TSPEC | K1III | 6 | 4940 | 96 | 96 | 2.505 | 0.306 | 0.663 |
| 212786391 | Mar-27-2016 | TSPEC | G5III | 6 | 4688 | 109 | 73 | 2.164 | 0.912 | 0.570 |
| 214629283 | May-5-2016 | SpeX | M3III | 7 | 3508 | 150 | 150 | 0.241 | 0.310 | 0.558 |
| 214799621 | May-5-2016 | SpeX | K4III | 7 | 4375 | 132 | 132 | 2.184 | 0.360 | 0.216 |
| 215030652 | Jun-7-2016 | SpeX | M0III | 7 | 3935 | 79 | 79 | 0.778 | 0.250 | 0.300 |
| 215090200 | May-5-2016 | SpeX | K0III | 7 | 4596 | 115 | 172 | 2.422 | 0.145 | 0.203 |
| 215174656 | May-6-2016 | SpeX | K7III | 7 | 3814 | 92 | 115 | 0.538 | 0.150 | 0.150 |
| 215346008 | Jun-7-2016 | SpeX | K4III | 7 | 4038 | 165 | 132 | 1.357 | 1.216 | 0.228 |
| 218006248 | May-5-2016 | SpeX | M2III | 7 | 3330 | 33 | 33 | 0.088 | 0.070 | 0.182 |
| Observation | Spectral | EPIC Classification | ||||||||
|---|---|---|---|---|---|---|---|---|---|---|
| EPIC | Date | Instru | Type11Spectral types are coarse assignments based on visual inspection of the near-infrared spectra collected in this paper. The assigned spectral types have errors of roughly subtype. (See Section 4.1 for details.) | Campaign | (K) | ep_ | em_ | logg (cgs) | ep_logg | em_logg |
| 201754305 | Jun-13-2015 | SpeX | K3V22In general, we list stars with spectral types of K3V or later in the cool dwarf sample rather than the hotter dwarf sample. However, these stars had an estimated temperatures K or estimated radii , which are beyond the validity range of the Newton et al. (2015) relations. | 1 | 4755 | 113 | 113 | 4.642 | 0.045 | 0.045 |
| 204890128 | Mar-27-2016 | TSPEC | K2V | 2 | 5213 | 188 | 707 | 3.848 | 0.535 | 0.535 |
| 205084841 | Mar-27-2016 | TSPEC | K0V | 2 | 4793 | 207 | 207 | 2.369 | 0.205 | 0.656 |
| 205145448 | Jun-7-2016 | SpeX | G5V | 2 | 5700 | 390 | 57 | 3.841 | 1.362 | 0.020 |
| 205145448 | May-5-2016 | SpeX | G5V | 2 | 5700 | 390 | 57 | 3.841 | 1.362 | 0.020 |
| 205686202 | May-5-2016 | SpeX | K1V | 2 | 3809 | 68 | 1432 | 4.889 | 0.399 | 0.084 |
| 206055981 | Oct-26-2016 | SpeX | K3V22In general, we list stars with spectral types of K3V or later in the cool dwarf sample rather than the hotter dwarf sample. However, these stars had an estimated temperatures K or estimated radii , which are beyond the validity range of the Newton et al. (2015) relations. | 3 | 4522 | 45 | 73 | 4.668 | 0.028 | 0.024 |
| 206055981 | Nov-26-2015 | SpeX | K3V22In general, we list stars with spectral types of K3V or later in the cool dwarf sample rather than the hotter dwarf sample. However, these stars had an estimated temperatures K or estimated radii , which are beyond the validity range of the Newton et al. (2015) relations. | 3 | 4522 | 45 | 73 | 4.668 | 0.028 | 0.024 |
| 206056433 | Oct-26-2016 | SpeX | K4V22In general, we list stars with spectral types of K3V or later in the cool dwarf sample rather than the hotter dwarf sample. However, these stars had an estimated temperatures K or estimated radii , which are beyond the validity range of the Newton et al. (2015) relations. | 3 | 4506 | 109 | 54 | 4.666 | 0.025 | 0.045 |
| 206056433 | Nov-26-2015 | SpeX | K4V22In general, we list stars with spectral types of K3V or later in the cool dwarf sample rather than the hotter dwarf sample. However, these stars had an estimated temperatures K or estimated radii , which are beyond the validity range of the Newton et al. (2015) relations. | 3 | 4506 | 109 | 54 | 4.666 | 0.025 | 0.045 |
| 206096602 | Aug-07-2015 | SpeX | K3V22In general, we list stars with spectral types of K3V or later in the cool dwarf sample rather than the hotter dwarf sample. However, these stars had an estimated temperatures K or estimated radii , which are beyond the validity range of the Newton et al. (2015) relations. | 3 | 4617 | 138 | 138 | 4.649 | 0.030 | 0.036 |
| 206096602 | Sep-24-2015 | SpeX | K3V22In general, we list stars with spectral types of K3V or later in the cool dwarf sample rather than the hotter dwarf sample. However, these stars had an estimated temperatures K or estimated radii , which are beyond the validity range of the Newton et al. (2015) relations. | 3 | 4617 | 138 | 138 | 4.649 | 0.030 | 0.036 |
| 206135267 | Sep-24-2015 | SpeX | K2V | 3 | 5165 | 123 | 215 | 3.678 | 0.286 | 0.130 |
| 206144956 | Sep-24-2015 | SpeX | K2V | 3 | 4848 | 78 | 97 | 4.611 | 0.025 | 0.025 |
| 21041495733Possible fainter nearby star identified in Gemini AO image acquired by D. Ciardi.555https://exofop.ipac.caltech.edu/k2/edit_target.php?id=210414957 | Nov-26-2015 | SpeX | G2V | 4 | 5404 | 107 | 86 | 3.779 | 0.196 | 0.020 |
| 210423938 | Nov-27-2015 | SpeX | K3V22In general, we list stars with spectral types of K3V or later in the cool dwarf sample rather than the hotter dwarf sample. However, these stars had an estimated temperatures K or estimated radii , which are beyond the validity range of the Newton et al. (2015) relations. | 4 | 4856 | 114 | 171 | 2.876 | 0.582 | 0.485 |
| 210577548 | Nov-26-2015 | SpeX | K2V | 4 | ||||||
| 210609658 | Sep-24-2015 | SpeX | K2V | 4 | 4963 | 97 | 97 | 3.268 | 0.416 | 0.260 |
| 210731500 | Nov-27-2015 | SpeX | K1V | 4 | 5406 | 168 | 168 | 4.472 | 0.476 | 0.068 |
| 210754505 | Nov-26-2015 | SpeX | G5V | 4 | 6041 | 120 | 120 | 4.224 | 0.168 | 0.140 |
| 210793570 | Nov-26-2015 | SpeX | K3V22In general, we list stars with spectral types of K3V or later in the cool dwarf sample rather than the hotter dwarf sample. However, these stars had an estimated temperatures K or estimated radii , which are beyond the validity range of the Newton et al. (2015) relations. | 4 | 4896 | 118 | 118 | 3.242 | 0.609 | 0.435 |
| 210852232 | Nov-27-2015 | SpeX | K0V | 4 | 5437 | 167 | 301 | 4.527 | 0.384 | 0.040 |
| 211058748 | Nov-27-2015 | SpeX | K2V | 4 | 5070 | 81 | 243 | 4.615 | 0.060 | 0.110 |
| 211133138 | Nov-26-2015 | SpeX | K2V | 4 | 5742 | 367 | 275 | 3.965 | 0.150 | 0.500 |
| 211418290 | Nov-27-2015 | SpeX | G5V | 5 | 5182 | 126 | 126 | 2.461 | 0.055 | 1.111 |
| 211529065 | Mar-28-2016 | TSPEC | K4V22In general, we list stars with spectral types of K3V or later in the cool dwarf sample rather than the hotter dwarf sample. However, these stars had an estimated temperatures K or estimated radii , which are beyond the validity range of the Newton et al. (2015) relations. | 5 | 4742 | 167 | 167 | 4.621 | 0.036 | 0.030 |
| 211579683 | Mar-28-2016 | TSPEC | K3V22In general, we list stars with spectral types of K3V or later in the cool dwarf sample rather than the hotter dwarf sample. However, these stars had an estimated temperatures K or estimated radii , which are beyond the validity range of the Newton et al. (2015) relations. | 5 | 4829 | 57 | 76 | 3.432 | 1.045 | 1.254 |
| 211619879 | Mar-4-2016 | SpeX | K3V22In general, we list stars with spectral types of K3V or later in the cool dwarf sample rather than the hotter dwarf sample. However, these stars had an estimated temperatures K or estimated radii , which are beyond the validity range of the Newton et al. (2015) relations. | 5 | 4403 | 303 | 216 | 4.706 | 0.045 | 0.081 |
| 211779390 | Nov-26-2015 | SpeX | K3V22In general, we list stars with spectral types of K3V or later in the cool dwarf sample rather than the hotter dwarf sample. However, these stars had an estimated temperatures K or estimated radii , which are beyond the validity range of the Newton et al. (2015) relations. | 5 | 4472 | 122 | 87 | 4.705 | 0.065 | 0.195 |
| 211783206 | Mar-28-2016 | TSPEC | K5V22In general, we list stars with spectral types of K3V or later in the cool dwarf sample rather than the hotter dwarf sample. However, these stars had an estimated temperatures K or estimated radii , which are beyond the validity range of the Newton et al. (2015) relations. | 5 | 4855 | 94 | 94 | 3.324 | 0.655 | 1.310 |
| 211796070 | Mar-4-2016 | SpeX | K3V22In general, we list stars with spectral types of K3V or later in the cool dwarf sample rather than the hotter dwarf sample. However, these stars had an estimated temperatures K or estimated radii , which are beyond the validity range of the Newton et al. (2015) relations. | 5 | 4564 | 91 | 91 | 4.665 | 0.025 | 0.035 |
| 211797637 | Mar-27-2016 | TSPEC | K5V22In general, we list stars with spectral types of K3V or later in the cool dwarf sample rather than the hotter dwarf sample. However, these stars had an estimated temperatures K or estimated radii , which are beyond the validity range of the Newton et al. (2015) relations. | 5 | 4521 | 108 | 135 | 4.696 | 0.055 | 0.121 |
| 211913977 | Nov-27-2015 | SpeX | K3V22In general, we list stars with spectral types of K3V or later in the cool dwarf sample rather than the hotter dwarf sample. However, these stars had an estimated temperatures K or estimated radii , which are beyond the validity range of the Newton et al. (2015) relations. | 5 | 4825 | 58 | 77 | 4.607 | 0.025 | 0.040 |
| 211970147 | Mar-8-2016 | SpeX | K3V22In general, we list stars with spectral types of K3V or later in the cool dwarf sample rather than the hotter dwarf sample. However, these stars had an estimated temperatures K or estimated radii , which are beyond the validity range of the Newton et al. (2015) relations. | 5 | 4576 | 54 | 72 | 4.667 | 0.035 | 0.025 |
| 212012119 | Nov-27-2015 | SpeX | K3V22In general, we list stars with spectral types of K3V or later in the cool dwarf sample rather than the hotter dwarf sample. However, these stars had an estimated temperatures K or estimated radii , which are beyond the validity range of the Newton et al. (2015) relations. | 5 | 4837 | 78 | 58 | 3.178 | 0.715 | 0.325 |
| 212132195 | Nov-27-2015 | SpeX | K3V22In general, we list stars with spectral types of K3V or later in the cool dwarf sample rather than the hotter dwarf sample. However, these stars had an estimated temperatures K or estimated radii , which are beyond the validity range of the Newton et al. (2015) relations. | 5 | 4631 | 75 | 112 | 4.656 | 0.036 | 0.020 |
| 212138198 | Nov-27-2015 | SpeX | K3V22In general, we list stars with spectral types of K3V or later in the cool dwarf sample rather than the hotter dwarf sample. However, these stars had an estimated temperatures K or estimated radii , which are beyond the validity range of the Newton et al. (2015) relations. | 5 | 4975 | 99 | 139 | 4.577 | 1.218 | 0.030 |
| 212315941 | Mar-28-2016 | TSPEC | K3V22In general, we list stars with spectral types of K3V or later in the cool dwarf sample rather than the hotter dwarf sample. However, these stars had an estimated temperatures K or estimated radii , which are beyond the validity range of the Newton et al. (2015) relations. | 6 | 4909 | 78 | 118 | 4.628 | 0.025 | 0.040 |
| 212470904 | Mar-8-2016 | SpeX | K5V22In general, we list stars with spectral types of K3V or later in the cool dwarf sample rather than the hotter dwarf sample. However, these stars had an estimated temperatures K or estimated radii , which are beyond the validity range of the Newton et al. (2015) relations. | 6 | 4761 | 97 | 97 | 4.617 | 0.042 | 0.030 |
| 21252116644Characterized by Osborn et al. (2016) as a K3 dwarf with , , K, and [Fe/H] . | Mar-10-2016 | SpeX | K2V | 6 | 4841 | 145 | 174 | 4.628 | 0.030 | 0.025 |
| 212525174 | Mar-27-2016 | TSPEC | K4V22In general, we list stars with spectral types of K3V or later in the cool dwarf sample rather than the hotter dwarf sample. However, these stars had an estimated temperatures K or estimated radii , which are beyond the validity range of the Newton et al. (2015) relations. | 6 | 4163 | 41 | 100 | 4.876 | 0.084 | 0.020 |
| 212530118 | Mar-4-2016 | SpeX | K5V22In general, we list stars with spectral types of K3V or later in the cool dwarf sample rather than the hotter dwarf sample. However, these stars had an estimated temperatures K or estimated radii , which are beyond the validity range of the Newton et al. (2015) relations. | 6 | 4175 | 41 | 49 | 4.824 | 0.045 | 0.108 |
| 212532636 | Mar-28-2016 | TSPEC | K3V22In general, we list stars with spectral types of K3V or later in the cool dwarf sample rather than the hotter dwarf sample. However, these stars had an estimated temperatures K or estimated radii , which are beyond the validity range of the Newton et al. (2015) relations. | 6 | 4519 | 109 | 73 | 4.698 | 0.030 | 0.042 |
| 212572439 | Mar-10-2016 | SpeX | K2V | 6 | 4972 | 59 | 49 | 4.593 | 0.020 | 0.039 |
| 212572439 | Mar-27-2016 | TSPEC | K2V | 6 | 4972 | 59 | 49 | 4.593 | 0.020 | 0.039 |
| 212730483 | Mar-4-2016 | SpeX | K3V22In general, we list stars with spectral types of K3V or later in the cool dwarf sample rather than the hotter dwarf sample. However, these stars had an estimated temperatures K or estimated radii , which are beyond the validity range of the Newton et al. (2015) relations. | 6 | 4612 | 55 | 55 | 4.657 | 0.040 | 0.020 |
| 212737443 | Mar-28-2016 | TSPEC | K3V22In general, we list stars with spectral types of K3V or later in the cool dwarf sample rather than the hotter dwarf sample. However, these stars had an estimated temperatures K or estimated radii , which are beyond the validity range of the Newton et al. (2015) relations. | 6 | 4542 | 298 | 149 | 4.708 | 0.040 | 0.088 |
| 212756297 | Mar-10-2016 | SpeX | K5V22In general, we list stars with spectral types of K3V or later in the cool dwarf sample rather than the hotter dwarf sample. However, these stars had an estimated temperatures K or estimated radii , which are beyond the validity range of the Newton et al. (2015) relations. | 6 | 4429 | 78 | 131 | 4.729 | 0.078 | 0.104 |
| 212757039 | Apr-18-2016 | TSPEC | K1V | 6 | 5510 | 223 | 223 | 4.574 | 0.088 | 0.066 |
| 212779596 | Jun-7-2016 | SpeX | K5V22In general, we list stars with spectral types of K3V or later in the cool dwarf sample rather than the hotter dwarf sample. However, these stars had an estimated temperatures K or estimated radii , which are beyond the validity range of the Newton et al. (2015) relations. | 6 | 4731 | 77 | 77 | 4.623 | 0.036 | 0.036 |
| 212779596 | Mar-8-2016 | SpeX | K5V22In general, we list stars with spectral types of K3V or later in the cool dwarf sample rather than the hotter dwarf sample. However, these stars had an estimated temperatures K or estimated radii , which are beyond the validity range of the Newton et al. (2015) relations. | 6 | 4731 | 77 | 77 | 4.623 | 0.036 | 0.036 |
| 214173069 | Oct-26-2016 | SpeX | K3V22In general, we list stars with spectral types of K3V or later in the cool dwarf sample rather than the hotter dwarf sample. However, these stars had an estimated temperatures K or estimated radii , which are beyond the validity range of the Newton et al. (2015) relations. | 7 | 4659 | 150 | 75 | 4.633 | 0.035 | 0.025 |
| 214173069 | May-6-2016 | SpeX | K3V22In general, we list stars with spectral types of K3V or later in the cool dwarf sample rather than the hotter dwarf sample. However, these stars had an estimated temperatures K or estimated radii , which are beyond the validity range of the Newton et al. (2015) relations. | 7 | 4659 | 150 | 75 | 4.633 | 0.035 | 0.025 |
| 216111905 | May-6-2016 | SpeX | G8V | 7 | 5221 | 126 | 84 | 4.543 | 0.760 | 0.040 |
| 217192839 | May-6-2016 | SpeX | K2V | 7 | 4563 | 89 | 107 | 4.682 | 0.042 | 0.133 |
| 219114906 | May-6-2016 | SpeX | K2V | 7 | 4523 | 108 | 90 | 4.662 | 0.030 | 0.042 |
| Observation | Spectral | H2O-K2 | RV44Reported absolute radial velocities are the median of the values estimated by cross-correlating the telluric lines in our -, -, and -band spectra with a theoretical atmospheric transmission spectrum using the tellrv framework developed by Newton et al. (2014). | ||||
|---|---|---|---|---|---|---|---|
| EPIC | Campaign | Date | Instru | Type11Spectral types are coarse assignments based on visual inspection of the near-infrared spectra collected in this paper. The assigned spectral types have errors of roughly subtype. (See Section 4.1 for details.) | Index22H2O-K2 index (Rojas-Ayala et al., 2012). Although we report H2O-K2 indices and index-based spectral types for the full cool dwarf sample, these values are meaningless for the hotter stars. | SpType33Spectral type estimated using the H2O-K2 - spectral type relation introduced by Newton et al. (2014). On this scale, a spectral type of 0 corresponds to MV0 and positive values indicate correspondingly later M dwarf spectral types (e..g, M2V). Negative values indicate K subtypes (i.e., K7V, K5V). | (km/s) |
| 201205469 | 1 | Jun-13-2015 | SpeX | K7V | 1.03 | 0.39 | -4.0 |
| 201208431 | 1 | May-05-2015 | SpeX | K7V | 1.04 | 0.17 | 16.4 |
| 201345483 | 1 | May-05-2015 | SpeX | M0V | 1.03 | 0.49 | 4.5 |
| 201549860 | 1 | Nov-26-2015 | SpeX | K4V | 1.03 | 0.49 | 54.7 |
| 201617985 | 1 | Apr-16-2015 | SpeX | M1V | 1.01 | 0.93 | 4.4 |
| 201635569 | 1 | May-05-2015 | SpeX | M0V | 1.02 | 0.67 | 6.6 |
| 201637175 | 1 | May-05-2015 | SpeX | K7V | 1.01 | 1.02 | -8.4 |
| 201717274 | 1 | May-05-2015 | SpeX | M2V | 0.89 | 3.93 | 43.1 |
| 201855371 | 1 | Apr-16-2015 | SpeX | K5V | 1.02 | 0.65 | -11.9 |
| 205924614 | 3 | Sep-24-2015 | SpeX | K7V | 1.00 | 1.24 | 0.9 |
| 205924614 | 3 | Nov-26-2015 | SpeX | K7V | 1.02 | 0.78 | 4.4 |
| 206011691 | 3 | Aug-07-2015 | SpeX | K7V | 1.04 | 0.14 | 9.5 |
| 206011691 | 3 | Sep-24-2015 | SpeX | K7V | 1.04 | 0.31 | 4.2 |
| 206119924 | 3 | Sep-24-2015 | SpeX | K7V | 1.04 | 0.20 | -16.8 |
| 206209135 | 3 | Sep-24-2015 | SpeX | M2V | 0.91 | 3.46 | -38.1 |
| 206312951 | 3 | Sep-24-2015 | SpeX | M1V | 0.98 | 1.64 | -14.0 |
| 206318379 | 3 | Sep-24-2015 | SpeX | M4V | 0.88 | 4.07 | 11.7 |
| 210448987 | 4 | Nov-27-2015 | SpeX | K3V | 1.04 | 0.13 | -15.9 |
| 210489231 | 4 | Sep-24-2015 | SpeX | M1V | 0.98 | 1.75 | -56.6 |
| 210508766 | 4 | Sep-24-2015 | SpeX | M1V | 1.02 | 0.75 | -0.4 |
| 210558622 | 4 | Oct-14-2015 | SpeX | K7V | 1.03 | 0.47 | -0.1 |
| 210558622 | 4 | Nov-26-2015 | SpeX | K7V | 1.03 | 0.36 | -2.6 |
| 210564155 | 4 | Nov-27-2015 | SpeX | M2V | 0.91 | 3.46 | 36.5 |
| 210707130 | 4 | Sep-24-2015 | SpeX | K5V | 1.03 | 0.42 | -2.4 |
| 210750726 | 4 | Sep-24-2015 | SpeX | M1V | 0.94 | 2.59 | 2.5 |
| 210838726 | 4 | Sep-24-2015 | SpeX | M1V | 0.99 | 1.39 | 18.6 |
| 210968143 | 4 | Sep-24-2015 | SpeX | K5V | 1.04 | 0.31 | 20.9 |
| 211077024 | 4 | Nov-26-2015 | SpeX | M3V | 0.92 | 3.19 | 23.2 |
| 211305568 | 5 | Nov-27-2015 | SpeX | M1V | 0.99 | 1.50 | 29.7 |
| 211331236 | 5 | Nov-26-2015 | SpeX | M1V | 0.99 | 1.48 | 2.0 |
| 211331236 | 5 | Apr-18-2016 | TSPEC | M1V | 0.96 | 2.24 | -5.3 |
| 211336288 | 5 | Mar-27-2016 | TSPEC | M0V | 1.03 | 0.55 | 19.4 |
| 211357309 | 5 | Nov-27-2015 | SpeX | M1V | 0.99 | 1.38 | 18.5 |
| 21142889755Keck AO imaging by D. Ciardi and Gemini speckle imaging by M. Everett revealed that the star is actually a visual binary with a separation of roughly .666https://exofop.ipac.caltech.edu/k2/edit_target.php?id=211428897 | 5 | Nov-26-2015 | SpeX | M2V | 0.95 | 2.52 | 25.6 |
| 211509553 | 5 | Mar-27-2016 | TSPEC | M0V | 0.97 | 1.87 | -14.7 |
| 211680698 | 5 | Mar-28-2016 | TSPEC | K3V | 1.02 | 0.60 | -29.4 |
| 211694226A | 5 | Mar-8-2016 | SpeX | M3V | 0.93 | 2.98 | 21.2 |
| 211694226B | 5 | Mar-8-2016 | SpeX | M3V | 0.93 | 2.84 | 24.0 |
| 211762841 | 5 | Mar-4-2016 | SpeX | K7V | 1.03 | 0.47 | 24.6 |
| 211770795 | 5 | Apr-18-2016 | TSPEC | K5V | 1.04 | 0.17 | -44.3 |
| 211791178 | 5 | Mar-27-2016 | TSPEC | M0V | 1.01 | 0.96 | 61.5 |
| 211799258 | 5 | Mar-8-2016 | SpeX | M3V | 0.93 | 2.78 | 44.6 |
| 211817229 | 5 | Mar-4-2016 | SpeX | M4V | 0.85 | 4.91 | 28.2 |
| 211818569 | 5 | Feb-19-2016 | TSPEC | K5V | 1.06 | -0.16 | 24.9 |
| 211822797 | 5 | Mar-27-2016 | TSPEC | K7V | 1.00 | 1.23 | 28.3 |
| 211826814 | 5 | Feb-19-2016 | TSPEC | M4V | 0.90 | 3.72 | 24.1 |
| 211831378 | 5 | Apr-18-2016 | TSPEC | M0V | 0.92 | 3.08 | 3.7 |
| 211839798 | 5 | Mar-4-2016 | SpeX | M4V | 0.86 | 4.62 | 30.5 |
| 211924657 | 5 | Mar-8-2016 | SpeX | M3V | 0.89 | 3.87 | 40.0 |
| 211965883 | 5 | Mar-27-2016 | TSPEC | M0V | 1.08 | -0.68 | 37.3 |
| 211969807 | 5 | Mar-8-2016 | SpeX | M1V | 0.98 | 1.78 | 33.5 |
| 211970234 | 5 | Apr-18-2016 | TSPEC | M4V | 0.87 | 4.35 | -8.5 |
| 211988320 | 5 | Mar-27-2016 | TSPEC | K7V | 1.09 | -0.86 | 79.1 |
| 212006344 | 5 | Nov-26-2015 | SpeX | M0V | 1.02 | 0.65 | -13.3 |
| 212006344 | 5 | Feb-19-2016 | TSPEC | M0V | 1.01 | 0.97 | -15.5 |
| 212069861 | 5 | Nov-26-2015 | SpeX | M0V | 1.02 | 0.76 | 25.3 |
| 212154564 | 5 | Mar-27-2016 | TSPEC | M3V | 0.95 | 2.46 | 20.9 |
| 212354731 | 6 | Mar-28-2016 | TSPEC | M3V | 0.88 | 4.12 | -24.4 |
| 212398486 | 6 | Mar-4-2016 | SpeX | M2V | 0.93 | 2.89 | -19.0 |
| 212443973 | 6 | Mar-27-2016 | TSPEC | M3V | 0.96 | 2.05 | 0.7 |
| 212460519 | 6 | Mar-8-2016 | SpeX | K7V | 1.05 | 0.09 | -1.6 |
| 212554013 | 6 | Apr-18-2016 | TSPEC | K3V | 1.10 | -1.12 | -60.0 |
| 212565386 | 6 | Mar-10-2016 | SpeX | M1V | 0.97 | 1.98 | -38.7 |
| 212572452 | 6 | Mar-10-2016 | SpeX | K7V | 1.06 | -0.17 | 5.7 |
| 212572452 | 6 | Mar-27-2016 | TSPEC | K7V | 1.05 | -0.03 | 6.0 |
| 212628098 | 6 | Apr-18-2016 | TSPEC | K7V | 0.96 | 2.05 | -2.2 |
| 212634172 | 6 | Mar-4-2016 | SpeX | M3V | 0.93 | 2.95 | 23.2 |
| 212679181 | 6 | Mar-4-2016 | SpeX | M3V | 0.95 | 2.45 | 13.3 |
| 212679798 | 6 | Apr-18-2016 | TSPEC | M0V | 0.96 | 2.06 | 4.0 |
| 212686205 | 6 | Mar-8-2016 | SpeX | K4V | 1.04 | 0.14 | -9.6 |
| 212690867 | 6 | Mar-8-2016 | SpeX | M2V | 0.95 | 2.30 | 6.5 |
| 212773272 | 6 | Apr-18-2016 | TSPEC | M3V | 0.95 | 2.51 | -7.2 |
| 212773309 | 6 | Mar-28-2016 | TSPEC | M0V | 1.01 | 0.94 | -13.6 |
| 212773309B | 6 | Mar-28-2016 | TSPEC | M3V | 0.92 | 3.03 | -4.1 |
| 213951550 | 7 | May-6-2016 | SpeX | M3V | 0.93 | 2.81 | -77.2 |
| 214254518 | 7 | May-5-2016 | SpeX | K7V | 1.05 | 0.09 | 17.6 |
| 214254518 | 7 | Oct-26-2016 | SpeX | K7V | 1.04 | 0.22 | 17.3 |
| 214522613 | 7 | May-5-2016 | SpeX | M1V | 0.96 | 2.20 | 35.9 |
| 214787262 | 7 | May-5-2016 | SpeX | M3V | 0.91 | 3.27 | -24.1 |
| 216892056 | 7 | May-5-2016 | SpeX | M2V | 0.94 | 2.69 | -82.8 |
| 217941732 | 7 | May-5-2016 | SpeX | K5V | 1.03 | 0.41 | -49.8 |
| 217941732 | 7 | Oct-26-2016 | SpeX | K5V | 1.03 | 0.40 | -50.9 |
| Teff (K) | Radius () | Mass () | Luminosity () | |||||||||||
|---|---|---|---|---|---|---|---|---|---|---|---|---|---|---|
| EPIC | Date | SpType | Val | -Err | +Err | Val | -Err | +Err | Val | -Err | +Err | Val | -Err | +Err |
| 201205469 | Jun-13-2015 | K7V | 3890 | 121 | 113 | 0.587 | 0.039 | 0.039 | 0.599 | 0.043 | 0.035 | -1.178 | 0.188 | 0.175 |
| 201208431 | May-05-2015 | K7V | 4015 | 173 | 155 | 0.569 | 0.047 | 0.049 | 0.635 | 0.046 | 0.035 | -1.023 | 0.219 | 0.202 |
| 201345483 | May-05-2015 | M0V | 4262 | 201 | 173 | 0.686 | 0.045 | 0.057 | 0.682 | 0.030 | 0.028 | -0.630 | 0.218 | 0.198 |
| 201549860 | Nov-26-2015 | K4V | 4403 | 96 | 93 | 0.620 | 0.028 | 0.029 | 0.702 | 0.013 | 0.013 | -0.688 | 0.073 | 0.071 |
| 201617985 | Apr-16-2015 | M1V | 3742 | 116 | 105 | 0.496 | 0.032 | 0.032 | 0.540 | 0.055 | 0.048 | -1.480 | 0.141 | 0.134 |
| 201635569 | May-05-2015 | M0V | 3970 | 118 | 112 | 0.623 | 0.032 | 0.032 | 0.623 | 0.035 | 0.028 | -1.580 | 0.378 | 0.321 |
| 201637175 | May-05-2015 | K7V | 3879 | 95 | 87 | 0.582 | 0.031 | 0.030 | 0.595 | 0.033 | 0.029 | -1.258 | 0.135 | 0.124 |
| 201717274 | May-05-2015 | M2V | 3286 | 134 | 130 | 0.314 | 0.057 | 0.054 | 0.194 | 0.159 | 0.133 | -1.986 | 0.106 | 0.106 |
| 201855371 | Apr-16-2015 | K5V | 4118 | 133 | 119 | 0.626 | 0.036 | 0.041 | 0.658 | 0.027 | 0.023 | -0.845 | 0.142 | 0.133 |
| 205924614 | Sep-24-2015 | K7V | 4423 | 149 | 130 | 0.700 | 0.045 | 0.056 | 0.705 | 0.018 | 0.022 | -0.701 | 0.125 | 0.116 |
| 20592461422Star observed twice to check the repeatability of our analysis. These are the higher precision estimates. | Nov-26-2015 | K7V | 4300 | 107 | 100 | 0.715 | 0.040 | 0.043 | 0.688 | 0.015 | 0.015 | -0.769 | 0.079 | 0.081 |
| 206011691 | Aug-07-2015 | K7V | 4304 | 90 | 86 | 0.649 | 0.029 | 0.029 | 0.688 | 0.013 | 0.012 | -1.111 | 0.072 | 0.071 |
| 20601169122Star observed twice to check the repeatability of our analysis. These are the higher precision estimates. | Sep-24-2015 | K7V | 4222 | 88 | 84 | 0.647 | 0.028 | 0.029 | 0.676 | 0.015 | 0.013 | -1.235 | 0.082 | 0.083 |
| 206119924 | Sep-24-2015 | K7V | 4348 | 86 | 88 | 0.669 | 0.030 | 0.030 | 0.695 | 0.013 | 0.012 | -0.736 | 0.063 | 0.063 |
| 206209135 | Sep-24-2015 | M2V | 3360 | 87 | 86 | 0.331 | 0.030 | 0.030 | 0.271 | 0.091 | 0.079 | -1.872 | 0.059 | 0.058 |
| 206312951 | Sep-24-2015 | M1V | 3707 | 80 | 81 | 0.478 | 0.028 | 0.028 | 0.523 | 0.045 | 0.037 | -1.277 | 0.066 | 0.064 |
| 206318379 | Sep-24-2015 | M4V | 3293 | 89 | 87 | 0.280 | 0.031 | 0.031 | 0.201 | 0.102 | 0.090 | -1.929 | 0.059 | 0.061 |
| 210448987 | Nov-27-2015 | K3V | 4674 | 141 | 131 | 0.635 | 0.032 | 0.035 | 0.745 | 0.023 | 0.034 | -0.656 | 0.062 | 0.059 |
| 210489231 | Sep-24-2015 | M1V | 4056 | 113 | 104 | 0.557 | 0.034 | 0.037 | 0.645 | 0.027 | 0.022 | -0.937 | 0.067 | 0.063 |
| 210508766 | Sep-24-2015 | M1V | 3876 | 81 | 80 | 0.547 | 0.028 | 0.028 | 0.594 | 0.031 | 0.025 | -1.393 | 0.071 | 0.066 |
| 21055862222Star observed twice to check the repeatability of our analysis. These are the higher precision estimates. | Oct-14-2015 | K7V | 4268 | 105 | 98 | 0.678 | 0.036 | 0.040 | 0.683 | 0.016 | 0.015 | -0.685 | 0.076 | 0.070 |
| 210558622 | Nov-26-2015 | K7V | 4350 | 112 | 106 | 0.770 | 0.050 | 0.057 | 0.695 | 0.015 | 0.016 | -0.590 | 0.076 | 0.070 |
| 210564155 | Nov-27-2015 | M2V | 3344 | 90 | 87 | 0.286 | 0.031 | 0.030 | 0.255 | 0.093 | 0.084 | -2.008 | 0.062 | 0.061 |
| 210707130 | Sep-24-2015 | K5V | 4376 | 95 | 90 | 0.676 | 0.031 | 0.031 | 0.698 | 0.013 | 0.013 | -0.711 | 0.063 | 0.062 |
| 210750726 | Sep-24-2015 | M1V | 3624 | 88 | 87 | 0.460 | 0.030 | 0.032 | 0.477 | 0.057 | 0.048 | -1.530 | 0.055 | 0.054 |
| 210838726 | Sep-24-2015 | M1V | 3792 | 78 | 78 | 0.503 | 0.028 | 0.028 | 0.562 | 0.036 | 0.030 | -1.371 | 0.058 | 0.057 |
| 210968143 | Sep-24-2015 | K5V | 4422 | 93 | 91 | 0.635 | 0.029 | 0.029 | 0.705 | 0.013 | 0.013 | -0.994 | 0.064 | 0.066 |
| 211077024 | Nov-26-2015 | M3V | 3489 | 81 | 80 | 0.321 | 0.029 | 0.029 | 0.384 | 0.067 | 0.058 | -1.742 | 0.054 | 0.054 |
| 211305568 | Nov-27-2015 | M1V | 3612 | 85 | 84 | 0.446 | 0.030 | 0.031 | 0.470 | 0.056 | 0.048 | -1.462 | 0.057 | 0.056 |
| 211331236 | Nov-26-2015 | M1V | 3755 | 85 | 83 | 0.457 | 0.028 | 0.028 | 0.546 | 0.042 | 0.035 | -1.358 | 0.061 | 0.059 |
| 21133123622Star observed twice to check the repeatability of our analysis. These are the higher precision estimates. | Apr-18-2016 | M1V | 3842 | 82 | 82 | 0.492 | 0.028 | 0.028 | 0.582 | 0.034 | 0.028 | -1.262 | 0.060 | 0.060 |
| 211336288 | Mar-27-2016 | M0V | 3997 | 80 | 79 | 0.586 | 0.027 | 0.027 | 0.630 | 0.022 | 0.019 | -1.365 | 0.062 | 0.061 |
| 211357309 | Nov-27-2015 | M1V | 3731 | 86 | 85 | 0.460 | 0.028 | 0.028 | 0.535 | 0.045 | 0.038 | -1.402 | 0.060 | 0.059 |
| 211428897 | Nov-26-2015 | M2V | 3595 | 95 | 91 | 0.290 | 0.030 | 0.030 | 0.459 | 0.064 | 0.055 | -1.685 | 0.056 | 0.058 |
| 211509553 | Mar-27-2016 | M0V | 3756 | 81 | 80 | 0.547 | 0.029 | 0.029 | 0.546 | 0.040 | 0.034 | -1.592 | 0.087 | 0.081 |
| 211680698 | Mar-28-2016 | K3V | 4726 | 143 | 127 | 0.735 | 0.043 | 0.047 | 0.756 | 0.025 | 0.039 | -0.593 | 0.063 | 0.061 |
| 211694226a | Mar-8-2016 | M3V | 3454 | 83 | 82 | 0.445 | 0.031 | 0.031 | 0.356 | 0.074 | 0.064 | -1.459 | 0.076 | 0.073 |
| 211694226b | Mar-8-2016 | M3V | 3448 | 93 | 92 | 0.440 | 0.035 | 0.037 | 0.351 | 0.084 | 0.072 | -1.647 | 0.086 | 0.084 |
| 211762841 | Mar-4-2016 | K7V | 4136 | 87 | 86 | 0.626 | 0.029 | 0.030 | 0.661 | 0.018 | 0.015 | -1.080 | 0.078 | 0.075 |
| 211770795 | Apr-18-2016 | K5V | 4753 | 155 | 129 | 0.679 | 0.036 | 0.038 | 0.763 | 0.027 | 0.046 | -0.572 | 0.076 | 0.070 |
| 211791178 | Mar-27-2016 | M0V | 4350 | 102 | 96 | 0.667 | 0.034 | 0.038 | 0.695 | 0.014 | 0.014 | -0.669 | 0.068 | 0.068 |
| 21179925833The Al-a EW for these stars are below the calibration range for the Newton et al. (2015) relations. Adopted parameters are based on the Mann et al. (2013a, b, 2015) relations. | Mar-8-2016 | M3V | 3317 | 73 | 73 | 0.328 | 0.062 | 0.069 | 0.227 | 0.077 | 0.077 | -2.117 | 0.373 | 0.373 |
| 21181722933The Al-a EW for these stars are below the calibration range for the Newton et al. (2015) relations. Adopted parameters are based on the Mann et al. (2013a, b, 2015) relations. | Mar-4-2016 | M4V | 3276 | 73 | 73 | 0.237 | 0.041 | 0.046 | 0.183 | 0.082 | 0.082 | -2.279 | 0.676 | 0.676 |
| 211818569 | Feb-19-2016 | K5V | 4471 | 112 | 104 | 0.768 | 0.042 | 0.042 | 0.712 | 0.014 | 0.017 | -0.611 | 0.058 | 0.057 |
| 211822797 | Mar-27-2016 | K7V | 4148 | 82 | 80 | 0.572 | 0.027 | 0.027 | 0.663 | 0.016 | 0.014 | -1.218 | 0.061 | 0.061 |
| 21182681433The Al-a EW for these stars are below the calibration range for the Newton et al. (2015) relations. Adopted parameters are based on the Mann et al. (2013a, b, 2015) relations. | Feb-19-2016 | M4V | 3288 | 73 | 73 | 0.262 | 0.049 | 0.055 | 0.196 | 0.080 | 0.080 | -2.226 | 0.539 | 0.539 |
| 211831378 | Apr-18-2016 | M0V | 3748 | 115 | 101 | 0.548 | 0.031 | 0.031 | 0.543 | 0.052 | 0.047 | -1.480 | 0.148 | 0.154 |
| 211839798 | Mar-4-2016 | M4V | 3522 | 175 | 133 | 0.265 | 0.039 | 0.049 | 0.409 | 0.110 | 0.109 | -2.134 | 0.067 | 0.065 |
| 211924657 | Mar-8-2016 | M3V | 3421 | 106 | 98 | 0.322 | 0.036 | 0.041 | 0.327 | 0.095 | 0.085 | -1.902 | 0.064 | 0.063 |
| 211965883 | Mar-27-2016 | M0V | 4211 | 80 | 79 | 0.600 | 0.027 | 0.027 | 0.674 | 0.014 | 0.012 | -1.110 | 0.061 | 0.060 |
| 211969807 | Mar-8-2016 | M1V | 3546 | 99 | 95 | 0.492 | 0.032 | 0.032 | 0.427 | 0.072 | 0.063 | -1.476 | 0.109 | 0.100 |
| 211970234 | Apr-18-2016 | M4V | 3292 | 159 | 150 | 0.190 | 0.039 | 0.036 | 0.200 | 0.185 | 0.153 | -2.371 | 0.111 | 0.101 |
| 211988320 | Mar-27-2016 | K7V | 4284 | 84 | 84 | 0.641 | 0.028 | 0.029 | 0.685 | 0.013 | 0.012 | -1.174 | 0.059 | 0.058 |
| 21200634422Star observed twice to check the repeatability of our analysis. These are the higher precision estimates. | Nov-26-2015 | M0V | 3993 | 78 | 76 | 0.591 | 0.027 | 0.027 | 0.630 | 0.022 | 0.018 | -1.186 | 0.065 | 0.066 |
| 212006344 | Feb-19-2016 | M0V | 3963 | 77 | 76 | 0.625 | 0.028 | 0.028 | 0.621 | 0.024 | 0.020 | -1.150 | 0.066 | 0.069 |
| 212069861 | Nov-26-2015 | M0V | 4076 | 83 | 81 | 0.571 | 0.028 | 0.028 | 0.649 | 0.019 | 0.016 | -1.091 | 0.068 | 0.063 |
| 212154564 | Mar-27-2016 | M3V | 3561 | 87 | 84 | 0.344 | 0.030 | 0.030 | 0.436 | 0.062 | 0.054 | -1.643 | 0.058 | 0.058 |
| 212354731 | Mar-28-2016 | M3V | 3591 | 119 | 106 | 0.418 | 0.032 | 0.033 | 0.457 | 0.075 | 0.068 | -1.531 | 0.096 | 0.091 |
| 212398486 | Mar-4-2016 | M2V | 3654 | 100 | 92 | 0.402 | 0.031 | 0.031 | 0.495 | 0.057 | 0.051 | -1.540 | 0.067 | 0.064 |
| 212443973 | Mar-27-2016 | M3V | 3423 | 84 | 84 | 0.343 | 0.028 | 0.028 | 0.330 | 0.079 | 0.069 | -1.888 | 0.054 | 0.054 |
| 212460519 | Mar-8-2016 | K7V | 4368 | 128 | 115 | 0.621 | 0.034 | 0.036 | 0.697 | 0.016 | 0.018 | -0.816 | 0.080 | 0.075 |
| 212554013 | Apr-18-2016 | K3V | 4388 | 142 | 137 | 0.677 | 0.045 | 0.052 | 0.700 | 0.019 | 0.020 | -0.757 | 0.080 | 0.078 |
| 212565386 | Mar-10-2016 | M1V | 4342 | 159 | 137 | 0.581 | 0.036 | 0.041 | 0.694 | 0.020 | 0.022 | -1.058 | 0.075 | 0.074 |
| 212572452 | Mar-27-2016 | K7V | 4390 | 193 | 160 | 0.662 | 0.043 | 0.053 | 0.700 | 0.023 | 0.028 | -0.807 | 0.165 | 0.155 |
| 21257245222Star observed twice to check the repeatability of our analysis. These are the higher precision estimates. | Mar-10-2016 | K7V | 4332 | 135 | 121 | 0.678 | 0.037 | 0.044 | 0.692 | 0.018 | 0.019 | -0.854 | 0.128 | 0.120 |
| 212628098 | Apr-18-2016 | K7V | 3942 | 84 | 82 | 0.566 | 0.028 | 0.028 | 0.615 | 0.027 | 0.022 | -0.796 | 0.067 | 0.065 |
| 212634172 | Mar-4-2016 | M3V | 3412 | 98 | 94 | 0.348 | 0.033 | 0.034 | 0.320 | 0.092 | 0.081 | -1.866 | 0.064 | 0.062 |
| 212679181 | Mar-4-2016 | M3V | 3616 | 89 | 87 | 0.434 | 0.029 | 0.029 | 0.472 | 0.058 | 0.050 | -1.544 | 0.056 | 0.058 |
| 212679798 | Apr-18-2016 | M0V | 3823 | 92 | 89 | 0.562 | 0.029 | 0.029 | 0.575 | 0.039 | 0.032 | -1.009 | 0.081 | 0.084 |
| 212686205 | Mar-8-2016 | K4V | 4470 | 172 | 145 | 0.778 | 0.061 | 0.076 | 0.711 | 0.020 | 0.028 | -0.673 | 0.066 | 0.065 |
| 212690867 | Mar-8-2016 | M2V | 3614 | 118 | 107 | 0.415 | 0.032 | 0.033 | 0.471 | 0.073 | 0.064 | -1.603 | 0.078 | 0.077 |
| 212773272 | Apr-18-2016 | M3V | 3367 | 82 | 81 | 0.428 | 0.030 | 0.030 | 0.277 | 0.084 | 0.074 | -1.753 | 0.067 | 0.069 |
| 212773309 | Mar-28-2016 | M0V | 4178 | 90 | 87 | 0.588 | 0.029 | 0.029 | 0.669 | 0.016 | 0.014 | -0.797 | 0.056 | 0.057 |
| 212773309B | Mar-28-2016 | M3V | 3459 | 103 | 100 | 0.396 | 0.034 | 0.034 | 0.360 | 0.090 | 0.078 | -1.632 | 0.097 | 0.104 |
| 213951550 | May-6-2016 | M3V | 3574 | 88 | 85 | 0.471 | 0.030 | 0.030 | 0.445 | 0.061 | 0.054 | -1.367 | 0.075 | 0.076 |
| 21425451822Star observed twice to check the repeatability of our analysis. These are the higher precision estimates. | May-5-2016 | K7V | 4335 | 102 | 94 | 0.668 | 0.033 | 0.037 | 0.693 | 0.014 | 0.014 | -0.836 | 0.066 | 0.066 |
| 214254518 | Oct-26-2016 | K7V | 4574 | 130 | 110 | 0.710 | 0.036 | 0.038 | 0.727 | 0.017 | 0.024 | -0.758 | 0.065 | 0.067 |
| 214522613 | May-5-2016 | M1V | 3602 | 99 | 94 | 0.448 | 0.032 | 0.032 | 0.463 | 0.065 | 0.056 | -1.412 | 0.084 | 0.080 |
| 214787262 | May-5-2016 | M3V | 3459 | 89 | 84 | 0.360 | 0.030 | 0.031 | 0.360 | 0.074 | 0.068 | -1.841 | 0.056 | 0.055 |
| 216892056 | May-5-2016 | M2V | 3467 | 84 | 82 | 0.398 | 0.029 | 0.029 | 0.367 | 0.071 | 0.063 | -1.707 | 0.057 | 0.056 |
| 217941732 | May-5-2016 | K5V | 4470 | 211 | 202 | 0.731 | 0.072 | 0.111 | 0.711 | 0.028 | 0.035 | -0.844 | 0.153 | 0.116 |
| 21794173222Star observed twice to check the repeatability of our analysis. These are the higher precision estimates. | Oct-26-2016 | K5V | 4356 | 197 | 172 | 0.744 | 0.078 | 0.111 | 0.696 | 0.026 | 0.028 | -0.858 | 0.132 | 0.126 |
| EW of Mg Features (A) | EW of Al Features (A) | Metallicity11Spectral types are coarse assignments based on visual inspection of the near-infrared spectra collected in this paper. The assigned spectral types have errors of roughly subtype. (See Section 4.1 for details.) | |||||||||||||
|---|---|---|---|---|---|---|---|---|---|---|---|---|---|---|---|
| (1.50 m) | (1.57 m) | (1.71 m) | a (1.67 m) | b (1.67 m) | [Fe/H] | [M/H] | |||||||||
| EPIC | Date | Val | Err | Val | Err | Val | Err | Val | Err | Val | Err | Val | Err | Val | Err |
| 201205469 | Jun-13-2015 | 5.84 | 0.37 | 3.82 | 0.30 | 3.59 | 0.33 | 2.43 | 0.21 | 3.01 | 0.23 | 0.433 | 0.166 | 0.307 | 0.146 |
| 201208431 | May-05-2015 | 7.76 | 0.33 | 2.87 | 0.59 | 3.52 | 0.32 | 1.43 | 0.27 | 2.74 | 0.35 | 0.066 | 0.191 | -0.024 | 0.170 |
| 201345483 | May-05-2015 | 8.23 | 0.41 | 6.14 | 0.51 | 3.79 | 0.39 | 1.94 | 0.23 | 2.36 | 0.31 | 0.316 | 0.202 | 0.130 | 0.164 |
| 201549860 | Nov-26-2015 | 8.13 | 0.10 | 5.08 | 0.10 | 3.86 | 0.09 | 1.72 | 0.07 | 2.15 | 0.09 | ||||
| 201617985 | Apr-16-2015 | 5.26 | 0.26 | 3.35 | 0.22 | 4.29 | 0.20 | 1.56 | 0.15 | 2.60 | 0.20 | -0.010 | 0.143 | -0.022 | 0.116 |
| 201635569 | May-05-2015 | 7.44 | 0.39 | 5.13 | 0.30 | 5.02 | 0.36 | 2.08 | 0.20 | 2.92 | 0.25 | 0.196 | 0.180 | 0.138 | 0.147 |
| 201637175 | May-05-2015 | 7.00 | 0.21 | 4.53 | 0.22 | 4.32 | 0.18 | 2.14 | 0.13 | 3.03 | 0.19 | 0.032 | 0.125 | 0.007 | 0.108 |
| 201717274 | May-05-2015 | 2.28 | 0.32 | 1.06 | 0.32 | 1.42 | 0.32 | 1.52 | 0.23 | 2.10 | 0.26 | -0.257 | 0.154 | -0.188 | 0.132 |
| 201855371 | Apr-16-2015 | 8.15 | 0.25 | 5.33 | 0.26 | 4.00 | 0.21 | 1.42 | 0.15 | 2.41 | 0.19 | ||||
| 205924614 | Sep-24-2015 | 8.30 | 0.22 | 5.81 | 0.20 | 4.17 | 0.17 | 1.39 | 0.13 | 2.17 | 0.16 | 0.246 | 0.125 | 0.170 | 0.108 |
| 205924614 | Nov-26-2015 | 7.94 | 0.12 | 5.50 | 0.12 | 3.80 | 0.10 | 1.36 | 0.08 | 2.21 | 0.11 | 0.376 | 0.095 | 0.168 | 0.089 |
| 206011691 | Aug-07-2015 | 8.13 | 0.08 | 5.60 | 0.08 | 4.42 | 0.07 | 1.66 | 0.06 | 2.33 | 0.09 | -0.121 | 0.088 | -0.122 | 0.085 |
| 206011691 | Sep-24-2015 | 7.85 | 0.08 | 5.78 | 0.10 | 4.47 | 0.08 | 1.73 | 0.06 | 2.25 | 0.09 | -0.034 | 0.090 | -0.057 | 0.086 |
| 206119924 | Sep-24-2015 | 8.34 | 0.07 | 5.68 | 0.08 | 3.88 | 0.06 | 1.52 | 0.06 | 2.25 | 0.08 | 0.337 | 0.086 | 0.204 | 0.084 |
| 206209135 | Sep-24-2015 | 2.54 | 0.12 | 1.65 | 0.11 | 2.30 | 0.10 | 1.36 | 0.07 | 1.54 | 0.10 | -0.271 | 0.093 | -0.278 | 0.089 |
| 206312951 | Sep-24-2015 | 4.95 | 0.11 | 3.28 | 0.11 | 3.10 | 0.09 | 1.64 | 0.07 | 2.39 | 0.08 | 0.097 | 0.092 | 0.066 | 0.087 |
| 206318379 | Sep-24-2015 | 2.33 | 0.13 | 1.41 | 0.12 | 1.96 | 0.11 | 1.26 | 0.08 | 1.64 | 0.10 | 0.332 | 0.096 | 0.208 | 0.090 |
| 210448987 | Nov-27-2015 | 7.41 | 0.10 | 4.88 | 0.10 | 3.14 | 0.09 | 1.39 | 0.07 | 1.59 | 0.10 | ||||
| 210489231 | Sep-24-2015 | 6.32 | 0.12 | 3.63 | 0.12 | 3.16 | 0.11 | 1.24 | 0.09 | 1.99 | 0.13 | 0.524 | 0.098 | 0.349 | 0.091 |
| 210508766 | Sep-24-2015 | 5.82 | 0.08 | 4.28 | 0.09 | 3.95 | 0.08 | 1.72 | 0.07 | 2.21 | 0.09 | -0.107 | 0.089 | -0.060 | 0.085 |
| 210558622 | Oct-14-2015 | 8.16 | 0.10 | 5.45 | 0.12 | 3.81 | 0.10 | 1.42 | 0.09 | 2.37 | 0.11 | 0.025 | 0.096 | 0.012 | 0.089 |
| 210558622 | Nov-26-2015 | 8.21 | 0.11 | 5.58 | 0.11 | 3.76 | 0.10 | 1.22 | 0.08 | 2.14 | 0.11 | 0.094 | 0.094 | 0.050 | 0.090 |
| 210564155 | Nov-27-2015 | 2.00 | 0.11 | 1.39 | 0.11 | 1.53 | 0.10 | 1.20 | 0.08 | 1.44 | 0.10 | -0.149 | 0.092 | -0.124 | 0.088 |
| 210707130 | Sep-24-2015 | 8.48 | 0.07 | 5.71 | 0.07 | 3.84 | 0.06 | 1.57 | 0.06 | 2.22 | 0.09 | ||||
| 210750726 | Sep-24-2015 | 3.67 | 0.08 | 2.87 | 0.08 | 2.64 | 0.07 | 1.32 | 0.07 | 1.80 | 0.10 | 0.100 | 0.088 | 0.034 | 0.085 |
| 210838726 | Sep-24-2015 | 5.28 | 0.06 | 3.55 | 0.08 | 3.51 | 0.07 | 1.63 | 0.05 | 2.21 | 0.07 | 0.180 | 0.085 | 0.111 | 0.083 |
| 210968143 | Sep-24-2015 | 7.93 | 0.07 | 5.39 | 0.08 | 4.03 | 0.06 | 1.59 | 0.06 | 2.02 | 0.08 | ||||
| 211077024 | Nov-26-2015 | 2.96 | 0.08 | 1.73 | 0.08 | 1.79 | 0.08 | 1.22 | 0.05 | 1.62 | 0.07 | 0.170 | 0.087 | 0.062 | 0.085 |
| 211305568 | Nov-27-2015 | 3.99 | 0.09 | 2.89 | 0.09 | 2.79 | 0.08 | 1.23 | 0.07 | 1.96 | 0.10 | -0.175 | 0.090 | -0.105 | 0.087 |
| 211331236 | Nov-26-2015 | 4.68 | 0.10 | 2.97 | 0.10 | 3.05 | 0.09 | 1.59 | 0.07 | 2.02 | 0.10 | 0.037 | 0.091 | 0.083 | 0.088 |
| 211331236 | Apr-18-2016 | 5.02 | 0.11 | 3.23 | 0.09 | 3.19 | 0.07 | 1.93 | 0.07 | 2.28 | 0.10 | 0.106 | 0.088 | -0.001 | 0.085 |
| 211336288 | Mar-27-2016 | 6.42 | 0.08 | 4.76 | 0.06 | 4.05 | 0.05 | 1.81 | 0.05 | 2.33 | 0.08 | -0.075 | 0.084 | -0.123 | 0.084 |
| 211357309 | Nov-27-2015 | 4.49 | 0.10 | 3.23 | 0.10 | 2.88 | 0.09 | 1.65 | 0.08 | 2.03 | 0.11 | -0.175 | 0.092 | -0.085 | 0.088 |
| 211428897 | Nov-26-2015 | 3.19 | 0.10 | 1.59 | 0.10 | 1.87 | 0.09 | 1.13 | 0.07 | 1.46 | 0.09 | -0.131 | 0.087 | -0.154 | 0.085 |
| 211509553 | Mar-27-2016 | 5.77 | 0.17 | 3.64 | 0.11 | 4.03 | 0.09 | 2.17 | 0.07 | 2.83 | 0.11 | 0.044 | 0.096 | -0.177 | 0.092 |
| 211680698 | Mar-28-2016 | 7.44 | 0.14 | 4.87 | 0.09 | 2.77 | 0.07 | 1.15 | 0.07 | 1.56 | 0.09 | ||||
| 211694226a | Mar-8-2016 | 4.13 | 0.18 | 2.98 | 0.17 | 2.83 | 0.17 | 1.67 | 0.12 | 2.74 | 0.13 | 0.043 | 0.108 | 0.053 | 0.101 |
| 211694226b | Mar-8-2016 | 3.54 | 0.24 | 2.75 | 0.22 | 2.39 | 0.24 | 1.71 | 0.15 | 2.42 | 0.16 | 0.261 | 0.131 | 0.117 | 0.110 |
| 211762841 | Mar-4-2016 | 7.63 | 0.09 | 5.21 | 0.09 | 4.06 | 0.09 | 1.62 | 0.07 | 2.36 | 0.10 | 0.218 | 0.089 | 0.241 | 0.086 |
| 211770795 | Apr-18-2016 | 7.38 | 0.17 | 5.35 | 0.12 | 3.27 | 0.09 | 1.33 | 0.07 | 1.54 | 0.10 | ||||
| 211791178 | Mar-27-2016 | 7.30 | 0.15 | 4.79 | 0.11 | 3.24 | 0.09 | 1.26 | 0.06 | 1.79 | 0.07 | -0.399 | 0.096 | -0.095 | 0.092 |
| 211799258 | Mar-8-2016 | 3.58 | 0.39 | 2.18 | 0.32 | 1.15 | 0.35 | 0.73 | 0.23 | 1.07 | 0.25 | 0.120 | 0.167 | 0.181 | 0.145 |
| 211817229 | Mar-4-2016 | 1.23 | 0.12 | 0.90 | 0.11 | 0.95 | 0.11 | 0.63 | 0.08 | 0.62 | 0.11 | -0.401 | 0.090 | -0.327 | 0.088 |
| 211818569 | Feb-19-2016 | 7.66 | 0.10 | 5.30 | 0.08 | 3.22 | 0.06 | 1.12 | 0.06 | 1.73 | 0.09 | ||||
| 211822797 | Mar-27-2016 | 6.41 | 0.08 | 4.64 | 0.07 | 3.94 | 0.06 | 1.90 | 0.05 | 2.08 | 0.07 | 0.322 | 0.084 | 0.179 | 0.083 |
| 211826814 | Feb-19-2016 | 2.60 | 0.35 | 0.97 | 0.27 | 1.33 | 0.21 | 0.63 | 0.15 | 1.06 | 0.19 | -0.254 | 0.130 | -0.317 | 0.123 |
| 211831378 | Apr-18-2016 | 5.47 | 0.40 | 3.91 | 0.23 | 3.76 | 0.19 | 1.88 | 0.13 | 2.60 | 0.16 | 0.257 | 0.138 | 0.111 | 0.128 |
| 211839798 | Mar-4-2016 | 1.69 | 0.12 | 1.18 | 0.12 | 1.48 | 0.12 | 0.92 | 0.08 | 0.98 | 0.11 | -0.078 | 0.095 | -0.010 | 0.089 |
| 211924657 | Mar-8-2016 | 2.42 | 0.13 | 1.69 | 0.13 | 1.72 | 0.13 | 1.01 | 0.09 | 1.32 | 0.11 | -0.004 | 0.096 | -0.006 | 0.091 |
| 211965883 | Mar-27-2016 | 7.40 | 0.08 | 5.10 | 0.07 | 4.16 | 0.05 | 1.86 | 0.04 | 2.33 | 0.06 | -0.196 | 0.084 | 0.024 | 0.083 |
| 211969807 | Mar-8-2016 | 3.87 | 0.25 | 3.47 | 0.21 | 3.26 | 0.23 | 1.73 | 0.15 | 2.67 | 0.18 | 0.179 | 0.125 | 0.200 | 0.116 |
| 211970234 | Apr-18-2016 | 1.46 | 0.28 | 1.08 | 0.16 | 1.22 | 0.13 | 1.05 | 0.09 | 0.83 | 0.12 | -0.177 | 0.109 | -0.087 | 0.102 |
| 211988320 | Mar-27-2016 | 7.20 | 0.08 | 5.13 | 0.06 | 4.20 | 0.04 | 1.50 | 0.04 | 1.97 | 0.06 | -0.369 | 0.084 | -0.157 | 0.083 |
| 212006344 | Nov-26-2015 | 7.30 | 0.07 | 4.95 | 0.07 | 4.35 | 0.06 | 1.99 | 0.06 | 2.86 | 0.08 | 0.444 | 0.085 | 0.341 | 0.083 |
| 212006344 | Feb-19-2016 | 7.25 | 0.10 | 5.38 | 0.09 | 4.12 | 0.06 | 2.37 | 0.06 | 3.15 | 0.08 | 0.521 | 0.086 | 0.309 | 0.085 |
| 212069861 | Nov-26-2015 | 7.08 | 0.08 | 4.64 | 0.08 | 3.90 | 0.07 | 1.75 | 0.06 | 2.38 | 0.09 | 0.324 | 0.088 | 0.195 | 0.085 |
| 212154564 | Mar-27-2016 | 3.35 | 0.11 | 2.00 | 0.10 | 2.63 | 0.07 | 1.14 | 0.05 | 1.64 | 0.07 | -0.093 | 0.088 | -0.238 | 0.086 |
| 212354731 | Mar-28-2016 | 3.36 | 0.30 | 2.61 | 0.17 | 2.13 | 0.15 | 1.39 | 0.11 | 1.79 | 0.11 | -0.009 | 0.124 | 0.018 | 0.107 |
| 212398486 | Mar-4-2016 | 4.09 | 0.16 | 2.58 | 0.15 | 2.50 | 0.17 | 1.58 | 0.10 | 1.61 | 0.12 | -0.278 | 0.103 | -0.197 | 0.096 |
| 212443973 | Mar-27-2016 | 2.31 | 0.08 | 1.99 | 0.06 | 2.44 | 0.05 | 1.12 | 0.05 | 1.32 | 0.08 | 0.201 | 0.084 | -0.054 | 0.083 |
| 212460519 | Mar-8-2016 | 7.57 | 0.11 | 4.77 | 0.12 | 3.68 | 0.11 | 1.42 | 0.10 | 1.71 | 0.13 | -0.116 | 0.095 | -0.140 | 0.091 |
| 212554013 | Apr-18-2016 | 6.85 | 0.22 | 4.79 | 0.15 | 2.86 | 0.12 | 1.36 | 0.09 | 1.84 | 0.11 | ||||
| 212565386 | Mar-10-2016 | 6.09 | 0.14 | 4.23 | 0.14 | 2.97 | 0.14 | 1.30 | 0.10 | 1.88 | 0.13 | 0.020 | 0.103 | -0.002 | 0.095 |
| 212572452 | Mar-10-2016 | 8.64 | 0.18 | 6.09 | 0.17 | 4.44 | 0.16 | 1.55 | 0.13 | 2.37 | 0.18 | 0.206 | 0.112 | 0.184 | 0.102 |
| 212572452 | Mar-27-2016 | 8.77 | 0.31 | 5.78 | 0.38 | 4.16 | 0.22 | 1.52 | 0.19 | 1.77 | 0.24 | 0.249 | 0.131 | 0.222 | 0.124 |
| 212628098 | Apr-18-2016 | 6.89 | 0.15 | 4.63 | 0.12 | 3.13 | 0.08 | 1.83 | 0.07 | 2.75 | 0.10 | -0.008 | 0.093 | 0.015 | 0.088 |
| 212634172 | Mar-4-2016 | 2.47 | 0.13 | 1.79 | 0.13 | 1.67 | 0.12 | 1.07 | 0.09 | 1.24 | 0.11 | 0.405 | 0.096 | 0.299 | 0.092 |
| 212679181 | Mar-4-2016 | 3.72 | 0.11 | 2.89 | 0.12 | 2.70 | 0.10 | 1.29 | 0.08 | 1.70 | 0.11 | 0.084 | 0.092 | 0.027 | 0.089 |
| 212679798 | Apr-18-2016 | 6.08 | 0.22 | 4.44 | 0.16 | 3.08 | 0.12 | 1.82 | 0.10 | 2.77 | 0.15 | 0.402 | 0.104 | 0.296 | 0.097 |
| 212686205 | Mar-8-2016 | 7.51 | 0.10 | 4.97 | 0.11 | 3.22 | 0.10 | 0.95 | 0.10 | 1.54 | 0.15 | ||||
| 212690867 | Mar-8-2016 | 3.56 | 0.18 | 2.62 | 0.18 | 3.07 | 0.18 | 1.59 | 0.15 | 2.11 | 0.20 | -0.188 | 0.114 | -0.187 | 0.104 |
| 212773272 | Apr-18-2016 | 2.79 | 0.18 | 2.32 | 0.12 | 2.08 | 0.11 | 1.68 | 0.07 | 2.36 | 0.10 | 0.329 | 0.098 | 0.250 | 0.092 |
| 212773309 | Mar-28-2016 | 6.87 | 0.09 | 4.72 | 0.08 | 3.28 | 0.05 | 1.53 | 0.05 | 2.10 | 0.08 | 0.288 | 0.085 | 0.123 | 0.084 |
| 212773309B | Mar-28-2016 | 3.37 | 0.33 | 2.07 | 0.20 | 2.62 | 0.17 | 1.61 | 0.11 | 2.20 | 0.14 | 0.595 | 0.144 | 0.251 | 0.115 |
| 213951550 | May-6-2016 | 4.84 | 0.17 | 3.23 | 0.15 | 3.15 | 0.15 | 1.58 | 0.11 | 2.66 | 0.13 | 0.153 | 0.110 | 0.099 | 0.097 |
| 214254518 | May-5-2016 | 7.57 | 0.08 | 5.09 | 0.09 | 3.75 | 0.08 | 1.38 | 0.07 | 1.95 | 0.09 | -0.074 | 0.090 | -0.055 | 0.086 |
| 214254518 | Oct-26-2016 | 8.00 | 0.08 | 5.53 | 0.09 | 3.73 | 0.07 | 1.30 | 0.07 | 1.73 | 0.10 | -0.130 | 0.089 | -0.058 | 0.086 |
| 214522613 | May-5-2016 | 4.35 | 0.21 | 2.90 | 0.20 | 2.93 | 0.19 | 1.73 | 0.13 | 2.45 | 0.17 | 0.407 | 0.118 | 0.125 | 0.106 |
| 214787262 | May-5-2016 | 2.70 | 0.09 | 1.96 | 0.09 | 1.89 | 0.08 | 0.99 | 0.06 | 1.32 | 0.08 | 0.006 | 0.089 | 0.023 | 0.086 |
| 216892056 | May-5-2016 | 2.94 | 0.10 | 2.31 | 0.11 | 2.50 | 0.10 | 1.52 | 0.08 | 1.85 | 0.11 | -0.111 | 0.093 | -0.116 | 0.089 |
| 217941732 | May-5-2016 | 7.26 | 0.24 | 5.05 | 0.22 | 3.86 | 0.23 | 1.08 | 0.17 | 1.69 | 0.20 | ||||
| 217941732 | Oct-26-2016 | 7.03 | 0.23 | 5.08 | 0.23 | 4.21 | 0.21 | 1.37 | 0.16 | 1.95 | 0.20 | ||||
Appendix A Reduced Stellar Spectra
As mentioned in Section 4.1, all of our reduced spectra are posted on the ExoFOP website. We also display the spectra in Figures 15-20 for cool dwarfs, Figures 21-23 for hotter dwarfs, and Figures 24-25 for giants.