Collective force generation by groups of migrating bacteria
Abstract
From biofilm and colony formation in bacteria to wound healing and embryonic development in multicellular organisms, groups of living cells must often move collectively. While considerable study has probed the biophysical mechanisms of how eukaryotic cells generate forces during migration, little such study has been devoted to bacteria, in particular with regard to the question of how bacteria generate and coordinate forces during collective motion. This question is addressed here for the first time using traction force microscopy. We study two distinct motility mechanisms of Myxococcus xanthus, namely twitching and gliding. For twitching, powered by type-IV pilus retraction, we find that individual cells exert local traction in small hotspots with forces on the order of 50 pN. Twitching of bacterial groups also produces traction hotspots, however with amplified forces around 100 pN. Although twitching groups migrate slowly as a whole, traction fluctuates rapidly on timescales ¡1.5 min. Gliding, the second motility mechanism, is driven by lateral transport of substrate adhesions. When cells are isolated, gliding produces low average traction on the order of 1 Pa. However, traction is amplified in groups by a factor of 5. Since advancing protrusions of gliding cells push on average in the direction of motion, we infer a long-range compressive load sharing among sub-leading cells. Together, these results show that the forces generated during twitching and gliding have complementary characters and both forces are collectively amplified in groups.
I Introduction
Many bacteria possess the ability to migrate over surfaces in large groups to facilitate such diverse phenomena as predation, aggregation, and biofilm formation. Research into the motility of microbes over the past few decades has made considerable progress towards an understanding of how single cells move, particularly the proteins involved, their regulation, and their ability to generate mechanical forces. However, the properties of the generated surface traction and the coordination of forces by multiple cells to produce coherent group motion remain unclear.
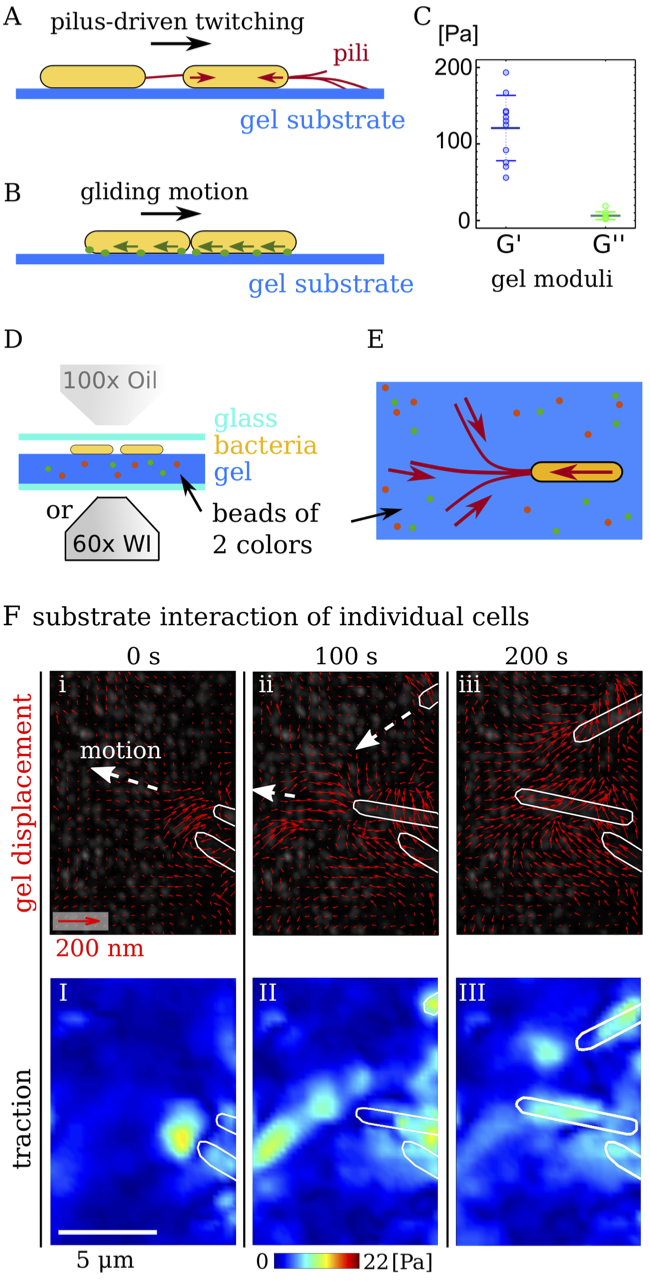
Myxococcus xanthus exhibits complex collective behaviors including vegetative swarming, predation, and fruiting body formation Keane and Berleman (2016). This organism is well-characterized and uniquely suited for motility studies. It employs two migration machineries Hodgkin and Kaiser (1979); Zhang et al. (2012) to move in an intermittent forward-backward motion Welch and Kaiser (2001); Mignot et al. (2005) (Fig. 1A,B). First, twitching, sometimes called social (S), motility Mattick (2002); Harshey (2003); Pelicic (2008); Maier and Wong (2015) is powered by the extension and retraction of type-IV pili, whereby extruded filaments adhere to the surface and filament retraction produces motility Wu and Kaiser (1995); Wall and Kaiser (1999); Merz et al. (2000); Skerker and Berg (2001); Marathe et al. (2014); Chang et al. (2016) (Fig. 1A). Pili also mediate cell-cell adhesion and retraction has been shown to be triggered by polysaccharides on neighboring cells Li et al. (2003); Black et al. (2006). A second, genetically distinct, motility system Hodgkin and Kaiser (1979); Youderian et al. (2003); Nett and König (2007) is termed gliding, or adventurous (A), motility. Here, a gliding transducer complex Luciano et al. (2011) that spans the membranes and periplasm converts the transmembrane proton gradient into force Nan et al. (2011); Sun et al. (2011). Motion occurs through translation of substrate-adhesion sites along the cell body Mignot et al. (2007); Balagam et al. (2014); Nan and Zusman (2016) (Fig. 1B).
Although many of the molecular details of these two systems are known, it is unclear if individual cells produce any measurable force during migration, or if and how groups of cells coordinate these forces. Inertia and hydrodynamic forces for these cells are negligible. For example, the drag force on a cell moving at a typical Myxococcus migration speed of is on the order of . Large traction forces will only occur if cells need to overcome friction with the surface or if the translation machinery itself has internal friction, similar to the situation for eukaryotic cells Oliver et al. (1995); Schwarz and Safran (2013). Collective migration of bacteria within a contiguous group is even less well understood. Could forces arise from a balance between cell-substrate and cell-cell interactions? Would this balance be local, or span larger distances within the group? Might one have “leader” cells at the advancing front of the group that exert forces locally to pull along those cells in the ranks behind? Or do all cells move forward from the back and push the advancing group forward? Finally, what are the timescales of force reorganization in groups? These mechanical aspects of bacterial migration have to date remained largely inaccessible to direct experimental measurement.
In this study, we report the first spatially resolved measurement of bacterial cell-substrate stress using Traction Force Microscopy (TFM) Dembo and Wang (1999); Butler et al. (2002); Sabass et al. (2008); Trepat et al. (2009). We show that the forces produced by the two distinct migration machineries of M. xanthus have characteristic features. For individual bacteria, we find that pili produce measurable traction that is localized several micrometers ahead of the cell body. Thus, bacterial pili produce a dipolar traction pattern. During the collective motion of twitching groups, traction occurs in local hotspots that fluctuate on a timescale that is much shorter than the timescale of group migration. Gliding cells, on the other hand, show very low forces during gliding. However, once organized into dense groups where the bacteria are aligned, gliding produces measurable traction oriented preferentially in the direction of group motion and is distributed over large areas, indicating compressive load sharing among cells.
II Results
For traction measurements, we employ soft elastic substrates made from chitosan-coated polyacrylamide (PAA) with shear modulus . The substrates contain fluorescent marker beads of two colors, which increases the spatial resolution of TFM to about . As shown in Fig. 1C,E, cells in suspension are placed on the gel and imaged from above or below. Lateral cell-substrate forces during cell migration produce deformation of the gel. Time-lapse imaging of the fluorescent beads allows measurement of a spatio-temporally varying deformation field relative to the first frame of a sequence. This deformation field is then used to calculate the relative traction that bacteria exert on to the substrate by making use of a regularized Fourier transform-based inversion technique Sabass et al. (2008). The traction calculated in this way is measured relative to the possibly pre-stressed first frame of an imaging sequence. To test if M. xanthus produces any measurable substrate forces during migration, we investigated wild type cells with the ability to both twitch and glide. Figure 1F shows representative results for the displacement field and traction maps that clearly demonstrate the presence of substrate forces below and ahead of migrating bacteria.
II.1 Individual twitching cells produce small hotspots of traction
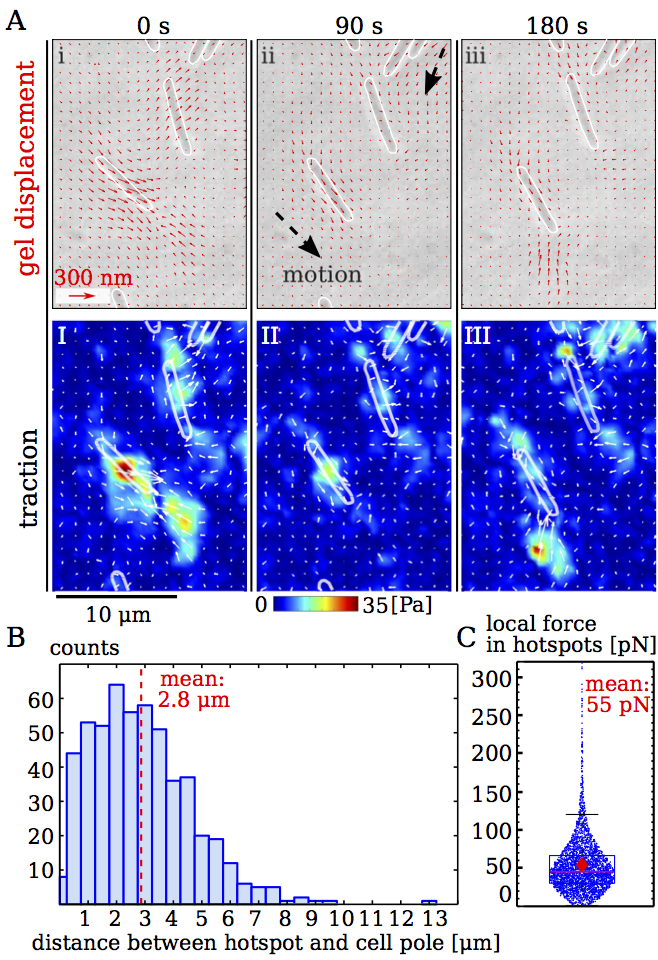
To isolate the different motility systems, we first probed twitching cells that lack the ability to glide due to a deletion of the aglQ gene. We observe localized areas of substrate deformation immediately in front of twitching cells, yielding bead displacements on the order of , see Fig. 2A(i-iii) and SI movie M1. The corresponding calculated traction is concentrated in hotspots, which have an apparent size on the order of due to resolution limitations. Time-lapse images in Fig. 2A (I-III) demonstrate that the traction field is dynamic and changes on a timescale on the order of a minute. Among moving cells, not all show measurable traction at all times. If hotspots are present, we observe on average 2-3 of them, with as little as 1 and as many as 6. Hotspots in front of cells mostly do not stretch all the way to the cell bodies, which demonstrates that pili likely only engage the substrate at their tips. The distance between hotspots and the closest cell pole is on average , but can be up to , which is consistent with reported pilus lengths determined by electron microscopy Kaiser (1979) (Fig. 2B).
Note that the long range of pili allows bacteria to connect to each other even when they are seemingly far apart. These invisible mechanical links among cells, together with resolution limitations, renders a detailed assessment of a force balance on the level of individual bacteria difficult. Also, the force applied at individual hotspots can not be estimated from local integration of the traction field since undersampling suppresses those high frequency spatial variations that affect the force magnitude strongest. Nevertheless, the clear localization of traction in hotspots makes it possible to estimate the overall force magnitude corresponding to each hotspot by assuming that forces are applied only at infinitesimal points at their center. For localized traction, this approach yields an improved estimate of force magnitude Sabass et al. (2008). Details of the method are described in the SI. For individual twitching bacteria, we find that the hotspots correspond on average to around , where almost all forces are smaller than (Fig. 2C). These numbers may be compared with pilus retraction forces measured using optical tweezers Clausen et al. (2009). There, retraction of individual type IV-pili at M. xanthus stalled at maximum forces of . For pilus retraction at speeds , which roughly corresponds to the gliding speed of bacteria, of force were measured. Thus, our first in-situ measurements of bacterial cell-substrate forces are consistent with results from other methods.
II.2 Individual gliding cells exert very little traction
To next investigate the motion of individual cells that do not employ pili but move by the complementary gliding mechanism, we performed experiments using the twitching-deficient mutant pilA. Fig. 3 shows typical results for bacteria that move individually without contacting each other. Here, substrate deformation is below and very little overall traction is observed. Since displacements are close to the measurement precision, random noise is prominent. However, approximate co-localization of traction with bacteria implies that gliding bacteria do deform the substrate to some degree. Traction is not localized in front of the cells but beneath them. Estimated traction from individual gliding cells is on the order of times smaller than for twitching cells. Consequently, we conclude that gliding of individual cells is a low-friction process that hardly affects the environment mechanically.

II.3 Groups of twitching cells exert local, fluctuating traction
To investigate how groups of twitching cells distribute force while performing collective motility, we examined groups of twitching aglQ cells Sun et al. (2011). Gliding deficient mutants form slightly disorganized groups, where individual cells are not strongly aligned with each other. When deposited on a substrate, initial clumps of bacteria tend to spread out only slightly during the observation time. TFM analysis (Fig. 4A,B) shows highly localized substrate forces in spots at the periphery of the group. The traction from the outermost spots points towards the cell group, as is expected from a pulling action of the pili. The snapshots of traction magnitude shown in Figure 4C demonstrate that the localization and magnitude of forces is quite dynamic. To assess the traction dynamics quantitatively, we employ a correlation measure based on the definition
| (1) |
Here, is the mean-subtracted -component of traction at position in the movie frame . denotes the time between each frame. The lag time of the correlation is in the range . The traction correlations are measured in the vicinity of the cells. As a reference, we also record correlations of traction far away from cells. Then, correlations of real traction and noise are both normalized by the zero-lag correlation of real traction as .
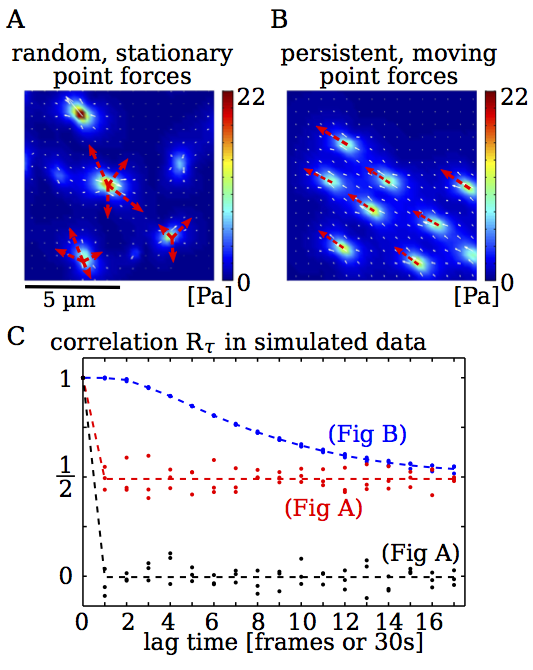
For long times, approaches a non-zero constant , which results from measuring traction with respect to a prestressed state (see SI). In Fig. 4D, correlation data from four different experiments is shown where we distinguish between traction beneath cell groups and traction noise occurring away from cells. The noise correlation is clearly much smaller than the real signal. The correlations of traction decays very rapidly on timescales , which demonstrates the presence of rapidly fluctuating traction. These fluctuations can also be observed in the raw data images, where rapid, local displacements of marker beads occur (SI movie M2a,b). The movie also demonstrates that individual cells move rapidly in a seemingly random fashion, while the group edge expands, but only marginally.
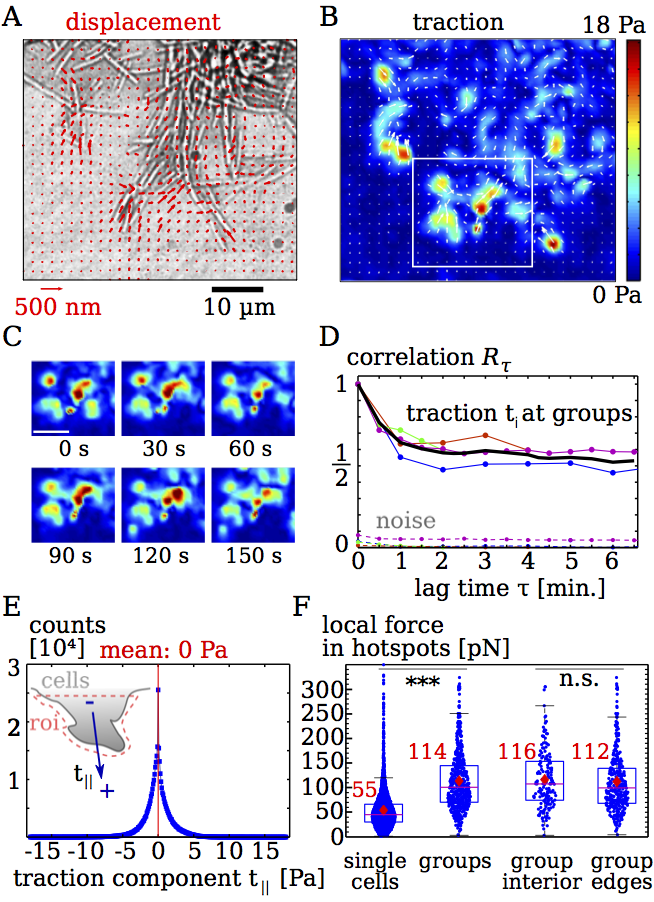
We next assess the orientational ordering of forces in the protruding edge of groups to see if the leading cells are either pulling the group forward or being pushed by the group. As shown in the inset of Fig. 4E, we manually select regions of interest around groups of protruding cells and record the traction components that are aligned with the protrusion direction. Positive values of correspond to forces that push in the direction of the protrusion. The measured distribution of is symmetric with a center and mean value of . On average, no pushing or pulling force occurs in protrusions. but rather forces balance locally. Thus, we conclude that forces are balanced in a local tug-of-war among twitching bacteria in protruding groups, with edge cells providing the traction that powers expansion.
Typical numbers of pili per M. xanthus bacterium have been reported to be around 4–10 Kaiser (1979), where in some cells up to pili were observed. Given the large number of potentially active pili in groups, it is not obvious that forces should be concentrated in the observed hotspots. However, if concentrated, the large number of available pili could produce strong forces on the order of nN, which would be comparable to those produced by much larger eukaryotes Balaban et al. (2001); Tan et al. (2003). Moreover, engaging the substrate with many pili simultaneously could potentially lead to very slow dynamics since motion would require detachment of many pili. To clarify this issue, we compare the absolute force magnitude of traction hotspots at groups with the magnitude of hotspots at individual cells (Figure 4F). While hotspots at individual cells have a magnitude , we find for hotspots at groups a mean force of with an uncertainty approximately as large as the mean. Thus, forces are amplified in groups by about a factor of two. Since these are smaller than the maximum stall force of Clausen et al. (2009), our result are still compatible with the notion that each traction hotspot in groups is caused only by one or a few pili. Furthermore, if many pili would cooperate to produce one traction hotspot, weaker forces would be expected for the edge of groups where fewer pili are present. However, a comparison of force magnitude shows no significant differences for hotspots at group edges or below the group interior. Together, we find that while groups of M. xanthus likely only use relatively few pili to simultaneously produce substrate forces, forces are nevertheless considerably amplified in groups when compared to single cells.

II.4 Gliding groups can exert persistent, coordinated force
To next assess the collective mechanics of bacterial gliding, we probed groups of gliding pilA cells. When placed on the imaging substrate, clumps of bacteria present at the start of the experiment spread in a fingering fashion, where the fingers consist of closely packed bacteria that move parallel to each other. We find that although gliding of individual cells does not produce much traction, gliding motion in groups leads to measurable forces (Figs. 5A,B). Here, traction is distributed in diffuse patches underneath the moving group and the traction magnitude is lower than in the presence of pili. Furthermore, the cell-substrate traction in the shown protrusion appears rather coordinated since the traction points in the direction of the advancing cells.
The snapshots of traction magnitude shown in Fig. 5C illustrate that traction is dynamic, but changes appear less abrupt than for twitching cells. To assess the traction dynamics quantitatively, we calculate the correlation measure for the twitching-deficient mutants (Fig. 5C). Again, the correlation measure is normalized by the zero-lag autocorrelation below the cell groups in each movie . The contribution of measurement noise is here evidently stronger than in the case of twitching motion due to the lower force magnitude. We find that the traction correlation does not show a rapid decay on short timescales as in Fig. 4D; instead, it decays over many minutes (at least as long as the duration of our experiment). Thus, gliding of groups causes traction variations that are slower than those resulting from pili.
Since the traction images of gliding groups in Fig. 5B suggest a “pushing” nature of the forces under advancing fingers, we quantitatively assess the directionality of forces in Fig. 5E. We manually select regions of interest around protruding fingers and record the traction components that are aligned with the protrusion direction. In contrast to the results from twitching cells, the distribution of is here asymmetric and heavy on the positive side, as quantified by a positive skew of . The pushing nature of cell-substrate traction below advancing fingers is corroborated by a positive distribution median of , where the hypothesis of a vanishing median is rejected with confidence by a sign test. These pushing forces necessarily require long-range load balance, where compression of cells at the rear end of the protruding finger balances pushing forces at the tip (see also SI).
Finally, we compare the forces produced by gliding groups with forces from individuals cells that are not touching each other. Since traction from gliding is distributed below the bacteria, we can not use the assumption of discrete point forces to calculate absolute force values. Instead, we record the distribution of traction magnitude at every position either directly beneath individual cells or beneath densely packed groups. To obtain an estimate of the noise magnitude, traction magnitudes in areas without cells are also recorded. We find that individual gliding cells exert traction that is significantly above the noise threshold, but nevertheless quite weak with a median below . Unexpectedly, we found that groups of gliding cells cells produce much higher traction than individual cells. The median of traction measured below gliding groups is more than 5 times higher than the median traction below individual cells, as shown in Figure 5F.
III Discussion
In this study, we perform the first spatially resolved analysis of traction exerted by bacteria. We present definitive evidence for two very distinct patterns of force organization during the migration of Myxoccocus xanthus.
In particular, pilus-driven twitching of individual cells can lead to a tug-of-war like motion where bacteria exert counteracting forces on the substrate. Here, we find cell-substrate traction that is concentrated in hotspots with a force magnitude on the order of . When the bacteria form a group, the number of available pili per substrate area is increased. Therefore, one might expect that twitching groups do not produce traction hotspots, but instead a rather continuous traction pattern with coordinated directionality. However, we observe that groups exhibit similar hotspots of traction as individual cells, albeit with a significantly amplified force magnitude around . Possible explanations for the collective force amplification include biochemical regulation Nudleman et al. (2005); Konovalova and Søgaard-Andersen (2011), cellular jamming leading to higher resistance and thereby higher force generation in the retraction motors Clausen et al. (2009), and the collective action of pili. Traction hotspots are rather short-lived and decay typically within the minute timescale. Moreover, pilus forces in groups are not coordinated, such that the groups as a whole hardly move over the timecourse of min. Overall, we conclude that the force from pili is not employed efficiently for the purpose of migration. However, pili clearly provide mechanical anchoring to the substrate and one might speculate about a potential sensory role that pilus retraction plays in allowing cells to probe their mechanical surroundings Persat et al. (2015a).
For gliding cells, we find almost the opposite results. Gliding is currently thought to be powered by elastically connected adhesion sites that are stationary with respect to the substrate Balagam et al. (2014). Once these adhesion sites reach the rear pole, the machinery is disassembled Treuner-Lange et al. (2015). If this adhesion disassembly can not keep up with the migration speed, one would expect traction at the lagging pole. Such traction was indeed found for an unrelated gliding of apicomplexans Münter et al. (2009). However, we did not find pronounced traction at the rear end for , suggesting that gliding is not a slip-stick motion limited by mechanical adhesion detachment in the studied conditions. In spite of the low forces measured for individual gliding cells, groups of gliding bacteria exert measurable substrate traction that can push in the direction of motion. To balance this traction, cells must experience long-ranged compressive force. While contact-dependent biochemical mechanisms can affect gliding Jakobczak et al. (2015), traction under gliding groups may also originate from a mechanical cell-cell interaction since random motion reversal of individual cells leads to stalling forces on other cells Zhang et al. (2011). In this picture, velocity variation produces an innately integrative mechanism for maintaining directional load while allowing group rearrangement.
On a technical level, our study is limited by the minuscule size of bacteria and pili. The spatial resolution of TFM results is limited by the density of measurements of the substrate deformation. Using fluorescent beads of two colors, substrate deformation can be measured approximately every , which is comparable to the bacterial thickness. Therefore, we expect that the real traction exerted by bacteria varies on a lengthscale comparable to, or shorter than our measurement scale. We are then dealing with a spatially undersampled traction field, which is a problem that is routinely encountered in the context of TFM at eukaryotic adhesion sites. A consequence of undersampling of the displacement field is that the absolute traction magnitude is usually underestimated Sabass et al. (2008); Stricker et al. (2010).
While we approach the current spatio-temporal limits of TFM in this study, we are still able to compare relative load values and to assess the spatiotemporal organization of traction. A number of challenging refinements of the methodology are desirable. First, accurate three-dimensional tracking of beads in the substrate would possibly allow the assessment of vertical forces and allow for precise determination of the vertical distance between the beads and the bacteria. Such analysis was precluded in our studies by bacterial photodamage from the fluorescence excitation light. Second, the gel displacements are measured with respect to a prestressed state since it proved difficult to recover the fully relaxed state after removal of bacteria. Although not essential for this study, it is generally desirable to obtain the relaxed state of the substrate. Third, comparison of TFM results with standard bacterial migration assays would be facilitated by the use of agar-based TFM substrates. Preliminary tests indicated that M. xanthus does not deform agar appreciably, which is likely a result of the larger rigidity as compared to PAA.
Many facets of bacterial cell-surface interactions are yet poorly understood Taktikos et al. (2013); Persat et al. (2015b). For example, it remains to be explained why twitching M. xanthus moves faster on soft agar than on stiff agar Shi and Zusman (1993). Controlled, biochemical responses to force occur, inter alia, during surface-dependent virulence of P. aeruginosa Siryaporn et al. (2014); Persat et al. (2015a) or inside epithelial host cells in contact with N. gonorrhoeae Higashi et al. (2007). We have shown that the combination of traction measurement with genetic or biochemical perturbations provides a viable and fruitful approach to improve our understanding of bacterial mechanics and address these fundamental questions.
IV Acknowledgments
We acknowledge invaluable advice and help with experimental protocols from S. Thutupalli and G. Liu. We also acknowledge help from G. Laevsky at the Confocal Microscopy Facility of Princeton University. A. Perazzo is thanked for advice concerning rheometry. Tâm Mignot is thanked for providing bacterial strains. This work was supported by NSF award PHY-1401506, and B.S. was supported by the NSF award MCB-1330288 (to H.A.S. and Z. Gitai) and by a fellowship from the German Academic Exchange Service (DAAD).
V Methods
V.1 Cell culture
M. xanthus strains employed in this study are a wild-type DZ2 strain, the gliding-deficient strain TM 146 DZ2 aglQ Sun et al. (2011), and a pilus-deficient strain DZ2 AglZ-YFP pilA. Bacteria are grown overnight at in CYE medium at consisting of (w/v) Casitone, yeast extract, 10 mM 3-(N-morpholino) propanesulfonic acid (MOPS), and 4 mM Bustamante et al. (2004). To remove nutrients from the medium prior to experiments, cells are washed once in TPM (10 mM Tris-HCl, pH 7.6, 1 mM , 8 mM ). The suspension of bacteria in TPM is briefly vortexed to ensure homogeneity before depositing it on the gel for imaging.
V.2 Preparation and characterization of elastic substrates for TFM
Polyacrylamide gels were prepared as described in Sabass et al. (2008) for use with fluorescent beads of two colors. We prepare gel with final concentrations of polyacrylamide and bisacrylamide. The gel consists of water, polyacrylamide solution (), bisacrylamide solution (), each of orange and dark red fluorescent beads (FluoSpheres, diameter , carboxylate-modified, (565/580) nm and (660/680) nm), and of freshly prepared ammonium persulfate solution ( in water). Polymerization is initiated with of N,N,N’,N’-tetramethylethylenediamine (TEMED). of the forming gel is spotted on a plasma-treated microscope slide or a glass-bottom petri dish and covered with a hydrophobic cover slip. After waiting for one hour to let the gel polymerize, the top coverslip is carefully removed and the gels are washed with water. If washing of gels is insufficient, bacteria can not survive on the gel, which we attribute to unpolymerized gel constituents.
Elastic properties of the PAA gel are measured by a stress-controlled rheometer (Anton Paar, Physica MCR 301). All of the rheometry measurements are carried out at . To avoid slippage between the gel and rheometer, we employ a parallel-plate geometry with sand-blasted plates of roughness (PP50/S). The gap thickness is chosen to be . Using a cone-plate geometry to obtain a homogeneous velocity gradient throughout the sample (Measuring cone CP50-1/TG) yielded similar results. After preparing the gel and adding the polymerization initiator, the liquid is placed on the rheometer and the measurement plate is moved into measurement position. After letting the gel polymerize between the plates for , the rim of the plates is covered with a small film of water to avoid evaporation. Polymerization is allowed to proceed for before data recording to ensure that the elastic properties reached stationary values. Gelation of the substrate produces significant normal forces on the rheometer plate, which can affect the measurement of shear moduli. Therefore, the normal forces are set to zero by slight adjustment of the gap size before before commencing the measurement. For the employed PAA gel ( PAA, BIS), we obtain a shear modulus of ( gels measured) (see Ref. Flanagan et al. (2002) for literature values). Assuming a Poisson ratio close to Boudou et al. (2009), the Young modulus is estimated as . At typical oscillation frequencies of , the loss modulus is found to be small, .
V.3 Coating of substrates with chitosan
Chitosan, a deacetylated form of chitin, is a polysaccharide that has broad biocompatibility. We found that PAA gels coated with chitosan can be used as motility assays where, depending on the concentration of chitosan, myxobacteria can move individually and in groups Ducret et al. (2012). To coat the gels, we dissolve chitosan in of acidic acid by gentle pipetting. The solution is then diluted with DI-water. After gently removing excess water from the gel surface, of the chitosan solution is placed on the gels and left there for at least one hour. Prior to imaging, gels are washed three times with a tris buffer solution. To prepare the sample for imaging, about of cell suspension in TPM are spotted on the gel and excess liquid is removed with a tissue. Finally, a cover slip is gently placed on top of the sample.
V.4 Imaging
Imaging is done on a Nikon Ti-E confocal microscope with Perfect Focus System, where a Yokogawa spinning disc (CSU-21) is mounted with a quad dichroic accommodating lasers with wavelengths of , , , and . Images are taken with a Hamamatsu ImageM back thinned EMCCD or an ORCA Flash digital CMOS camera. Individual bacteria are imaged through the glass coverslip above the cells using a oil immersion objective with magnification. To avoid applying vertical pressure on bacterial groups that are occasionally thicker than the slit between sample and gel, we image groups from below by using a glass-bottom dish as support for the gel. Focusing through the whole gel then requires matching the refractive index by use of a water immersion objective with magnification.
V.5 Traction reconstruction
To avoid evaporation and allow bacterial migration, it was necessary to cover the sample with a glass slip, where a thin spacer maintained a micron-scale distance between the glass slip and gel. If one wishes to image only the gel without bacteria to obtain a stress-free reference image of the beads, the delicate setup would have to be disassembled under the microscope. This task proved unfeasible. Therefore, a stress-free reference image for tracking of the fluorescent marker beads is not available. Thus, we employed the first frame of a time-lapse series as reference frame. Consequently, the displacements and calculated tractions are those that occur relative to the first frame of a movie. Computational analysis of gel deformation and traction force estimation is done as described previously Sabass et al. (2008); Plotnikov et al. (2014). Briefly, we employ a correlation-based tracking procedure that allows to extract deformation information simultaneously from both image channels. At the position , the displacement field is related to a traction field through convolution with a Green’s function as where the integral extends over the whole gel surface plane Landau and Lifshitz (1986). We estimate the traction field that produces the measured displacement field by inverting the convolution equation in Fourier space while regularizing the traction magnitude. A constant regularization parameter value was employed for the whole data analysis. Edge-effects resulting from solving the system in Fourier space are avoided by zero-patterning the edges of the displacement field. For inferring the force magnitude at hotspots by assuming point forces, we employ the established procedure of matrix inversion using a singular value decomposition and Tikhonov regularization Schwarz et al. (2002); Sabass et al. (2008). As an important improvement, we assume here that the beads are located a finite distance beneath the surface of the gel (see SI). Histograms in figures were prepared by choosing a bin width that is close to the value given by the heuristic rule , where is the standard deviation of the data and is the number of data points Scott (1979). Boxplots in the presented figures show the range of the distributions around the indicated medians. The significance of having two different distributions is quantified with a rank sum test.
VI Appendix
VI.1 Estimation of point force magnitude
For inferring the force magnitude at hotspots, we modify established methods Schwarz et al. (2002); Sabass et al. (2008). We assume Cartesian coordinates , where an elastic material is bounded by the plane and occupies the upper half space . The elastic Young modulus is denoted by and Poisson’s ratio is denoted by . Forces acting in the plane are denoted by . Vertical forces are assumed to be zero. The displacements in a plane parallel to the material surface are denoted by , where we assume that is a constant. In a linear framework, we first consider a point force applied at the origin. Then, material displacements are related to the force through with a Green’s function Landau and Lifshitz (1986)
| (2) | ||||
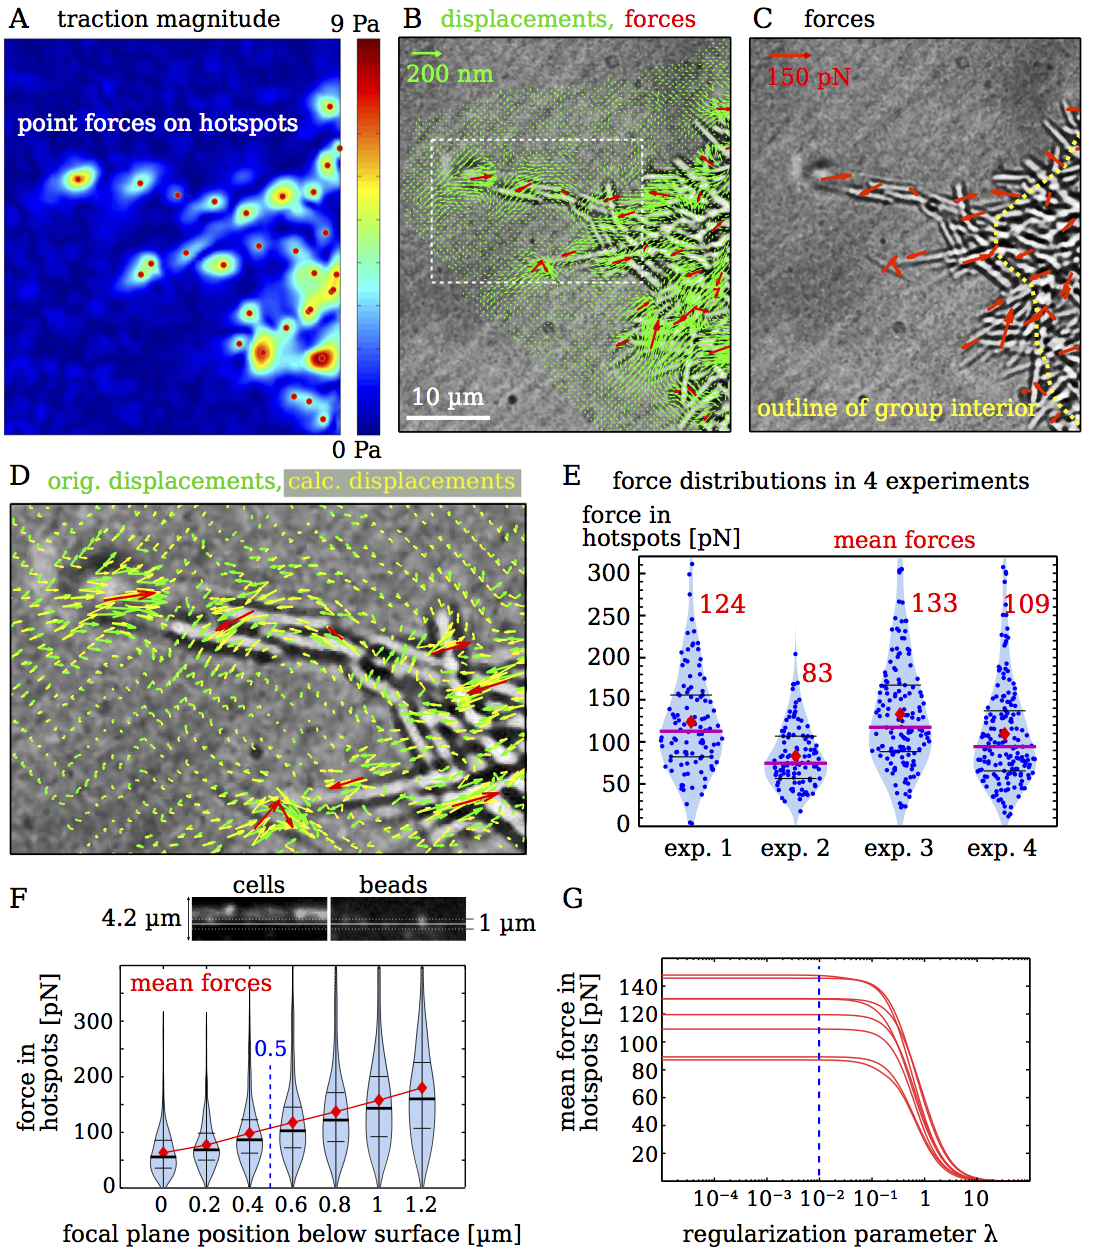
The measured displacements can be treated as resulting from the superposition of point forces at various locations. Thus, we can write a linear system relating displacements with index to point forces with index as . We employ an established procedure to solve the inverse problem by using a singular value decomposition of and Tikhonov regularization where the expression is minimized. Here, is a regularization parameter. Figures 8A,B,C illustrate the process of force estimation. First, we employ the results from standard traction force microscopy to localize hotspots of traction. Then, we manually place a point force into the center of every hotspot. Using the such defined point force locations together with the measured substrate displacements, we calculate the forces . In Fig. 8D we plot the originally measured displacements together with the displacements resulting from the calculated forces. Differences between measurements and calculation illustrate the approximative nature of the technique. In Fig. 8E we compare the results from four independent experiments. Average values of forces differ slightly, but are on the order of . In Fig. 8E we investigate the influence of the vertical distance between imaging plane and gel surface. Side-view of a vertical scan through the sample illustrates our choice for the imaging plane. As a result of the finite point spread function and the difficulty to determine the exact location of the gel surface, the value of is uncertain. However, we determined to lie in the range of and therefore assume a constant value of for all experiments. From Fig. 8E, it can be seen that the force magnitude varies depending on the choice of . Therefore, incorporating the position of the focal plane into the calculation results in a significantly improved force estimate. Fig. 8F shows our choice of the regularization parameter. The magnitude of forces decreases rather sharply at . To maintain consistency among the samples, we employ for all experiments . This value is for all samples below the transition to the regularization-dominated regime where force magnitude is strongly suppressed.

References
- Keane and Berleman (2016) R. Keane and J. Berleman, Microbiology 162, 1 (2016).
- Hodgkin and Kaiser (1979) J. Hodgkin and D. Kaiser, Mol. Gen. Genet. 171, 177 (1979).
- Zhang et al. (2012) Y. Zhang, A. Ducret, J. Shaevitz, and T. Mignot, FEMS Microbiol. Rev. 36, 149 (2012).
- Welch and Kaiser (2001) R. Welch and D. Kaiser, Proceedings of the National Academy of Sciences 98, 14907 (2001).
- Mignot et al. (2005) T. Mignot, J. P. Merlie, and D. R. Zusman, Science 310, 855 (2005).
- Mattick (2002) J. S. Mattick, Annu. Rev. Microbiol. 56, 289 (2002).
- Harshey (2003) R. M. Harshey, Annu. Rev. Microbiol. 57, 249 (2003).
- Pelicic (2008) V. Pelicic, Mol. Microbiol. 68, 827 (2008).
- Maier and Wong (2015) B. Maier and G. C. Wong, Trends. Microbiol. 23, 775 (2015).
- Wu and Kaiser (1995) S. S. Wu and D. Kaiser, Mol. Microbiol. 18, 547 (1995).
- Wall and Kaiser (1999) D. Wall and D. Kaiser, Mol. Microbiol. 32, 01 (1999).
- Merz et al. (2000) A. J. Merz, M. So, and M. P. Sheetz, Nature 407, 98 (2000).
- Skerker and Berg (2001) J. M. Skerker and H. C. Berg, Proc. Nat. Acad. Sci. 98, 6901 (2001).
- Marathe et al. (2014) R. Marathe, C. Meel, N. C. Schmidt, L. Dewenter, R. Kurre, L. Greune, M. A. Schmidt, M. J. Müller, R. Lipowsky, B. Maier, et al., Nat. Commun. 5 (2014).
- Chang et al. (2016) Y.-W. Chang, L. A. Rettberg, A. Treuner-Lange, J. Iwasa, L. Søgaard-Andersen, and G. J. Jensen, Science 351, aad2001 (2016).
- Li et al. (2003) Y. Li, H. Sun, X. Ma, A. Lu, R. Lux, D. Zusman, and W. Shi, Proc. Nat. Acad. Sci. 100, 5443 (2003).
- Black et al. (2006) W. P. Black, Q. Xu, and Z. Yang, Mol. Microbiol. 61, 447 (2006).
- Youderian et al. (2003) P. Youderian, N. Burke, D. J. White, and P. L. Hartzell, Mol. Microbiol. 49, 555 (2003).
- Nett and König (2007) M. Nett and G. M. König, Nat. Prod. Rep. 24, 1245 (2007).
- Luciano et al. (2011) J. Luciano, R. Agrebi, A. V. Le Gall, M. Wartel, F. Fiegna, A. Ducret, C. Brochier-Armanet, and T. Mignot, PLoS Genet 7, e1002268 (2011).
- Nan et al. (2011) B. Nan, J. Chen, J. C. Neu, R. M. Berry, G. Oster, and D. R. Zusman, Proc. Nat. Acad. Sci. 108, 2498 (2011).
- Sun et al. (2011) M. Sun, M. Wartel, E. Cascales, J. W. Shaevitz, and T. Mignot, Proc. Nat. Acad. Sci. 108, 7559 (2011).
- Mignot et al. (2007) T. Mignot, J. W. Shaevitz, P. L. Hartzell, and D. R. Zusman, Science 315, 853 (2007).
- Balagam et al. (2014) R. Balagam, D. B. Litwin, F. Czerwinski, M. Sun, H. B. Kaplan, J. W. Shaevitz, and O. A. Igoshin, PLoS Comput. Biol. 10, e1003619 (2014).
- Nan and Zusman (2016) B. Nan and D. R. Zusman, Mol. Microbiol. (2016).
- Oliver et al. (1995) T. Oliver, K. Jacobson, and M. Dembo, Cell. Motil. Cytoskeleton 31, 225 (1995).
- Schwarz and Safran (2013) U. S. Schwarz and S. A. Safran, Rev. Mod. Phys. 85, 1327 (2013).
- Dembo and Wang (1999) M. Dembo and Y.-L. Wang, Biophys. J. 76, 2307 (1999).
- Butler et al. (2002) J. P. Butler, I. M. Tolic-Norrelykke, B. Fabry, and J. J. Fredberg, Am. J. Physiol. Cell Physiol. 282, C595 (2002).
- Sabass et al. (2008) B. Sabass, M. L. Gardel, C. M. Waterman, and U. S. Schwarz, Biophys. J. 94, 207 (2008).
- Trepat et al. (2009) X. Trepat, M. R. Wasserman, T. E. Angelini, E. Millet, D. A. Weitz, J. P. Butler, and J. J. Fredberg, Nature Phys. 5, 426 (2009).
- Kaiser (1979) D. Kaiser, Proc. Nat. Acad. Sci. 76, 5952 (1979).
- Clausen et al. (2009) M. Clausen, V. Jakovljevic, L. Søgaard-Andersen, and B. Maier, J. Bacteriol 191, 4633 (2009).
- Balaban et al. (2001) N. Q. Balaban, U. S. Schwarz, D. Riveline, P. Goichberg, G. Tzur, I. Sabanay, D. Mahalu, S. Safran, A. Bershadsky, L. Addadi, et al., Nature cell biology 3, 466 (2001).
- Tan et al. (2003) J. L. Tan, J. Tien, D. M. Pirone, D. S. Gray, K. Bhadriraju, and C. S. Chen, Proc. Nat. Acad. Sci. 100, 1484 (2003).
- Nudleman et al. (2005) E. Nudleman, D. Wall, and D. Kaiser, Science 309, 125 (2005).
- Konovalova and Søgaard-Andersen (2011) A. Konovalova and L. Søgaard-Andersen, Molecular microbiology 81, 297 (2011).
- Persat et al. (2015a) A. Persat, Y. F. Inclan, J. N. Engel, H. A. Stone, and Z. Gitai, Proc. Nat. Acad. Sci. 112, 7563 (2015a).
- Treuner-Lange et al. (2015) A. Treuner-Lange, E. Macia, M. Guzzo, E. Hot, L. M. Faure, B. Jakobczak, L. Espinosa, D. Alcor, A. Ducret, D. Keilberg, et al., J. Cell Biol. 210, 243 (2015).
- Münter et al. (2009) S. Münter, B. Sabass, C. Selhuber-Unkel, M. Kudryashev, S. Hegge, U. Engel, J. P. Spatz, K. Matuschewski, U. S. Schwarz, and F. Frischknecht, Cell Host Microbe 6, 551 (2009).
- Jakobczak et al. (2015) B. Jakobczak, D. Keilberg, K. Wuichet, and L. Søgaard-Andersen, PLoS Genet 11, e1005341 (2015).
- Zhang et al. (2011) H. Zhang, S. Angus, M. Tran, C. Xie, O. A. Igoshin, and R. D. Welch, Journal of bacteriology 193, 5164 (2011).
- Stricker et al. (2010) J. Stricker, B. Sabass, U. S. Schwarz, and M. L. Gardel, J. Phys.: Condensed Matter 22, 194104 (2010).
- Taktikos et al. (2013) J. Taktikos, H. Stark, and V. Zaburdaev, PloS one 8, e81936 (2013).
- Persat et al. (2015b) A. Persat, C. D. Nadell, M. K. Kim, F. Ingremeau, A. Siryaporn, K. Drescher, N. S. Wingreen, B. L. Bassler, Z. Gitai, and H. A. Stone, Cell 161, 988 (2015b).
- Shi and Zusman (1993) W. Shi and D. R. Zusman, Proc. Nat. Acad. Sci. 90, 3378 (1993).
- Siryaporn et al. (2014) A. Siryaporn, S. L. Kuchma, G. A. O’Toole, and Z. Gitai, Proc. Nat. Acad. Sci. 111, 16860 (2014).
- Higashi et al. (2007) D. L. Higashi, S. W. Lee, A. Snyder, N. J. Weyand, A. Bakke, and M. So, Infect. Immun. 75, 4743 (2007).
- Bustamante et al. (2004) V. H. Bustamante, I. Martínez-Flores, H. C. Vlamakis, and D. R. Zusman, Mol. Microbiol. 53, 1501 (2004).
- Flanagan et al. (2002) L. A. Flanagan, Y.-E. Ju, B. Marg, M. Osterfield, and P. A. Janmey, Neurorept. 13, 2411 (2002).
- Boudou et al. (2009) T. Boudou, J. Ohayon, C. Picart, R. I. Pettigrew, and P. Tracqui, Biorheology 46, 191 (2009).
- Ducret et al. (2012) A. Ducret, M.-P. Valignat, F. Mouhamar, T. Mignot, and O. Theodoly, Proc. Nat. Acad. Sci. 109, 10036 (2012).
- Plotnikov et al. (2014) S. V. Plotnikov, B. Sabass, U. S. Schwarz, and C. M. Waterman, Methods Cell Biol. 123, 367 (2014).
- Landau and Lifshitz (1986) L. D. Landau and E. M. Lifshitz, Course of theoretical physics, Theory of elasticity (Pergamon Press Oxford, 1986).
- Schwarz et al. (2002) U. S. Schwarz, N. Q. Balaban, D. Riveline, A. Bershadsky, B. Geiger, and S. Safran, Biophys. J. 83, 1380 (2002).
- Scott (1979) D. W. Scott, Biometrika 66, 605 (1979).