11email: guido.consolandi@mib.infn.it
22institutetext: Aix Marseille Université, CNRS, LAM (Laboratoire d’Astrophysique de Marseille), Marseille, France
Bars as seen by Herschel & Sloan
We present an observational study of the effect of bars on the gas component and on the star formation properties of their host galaxies in a statistically significant sample of resolved objects, the Reference Sample. The analysis of optical and far–infrared images allows us to identify a clear spatial correlation between stellar bars and the cold-gas distribution mapped by the warm dust emission. We find that the infrared counterparts of optically identified bars are either bar–like structures or dead central regions in which star formation is strongly suppressed. Similar morphologies are found in the distribution of star formation directly traced by H maps. The sizes of such optical and infrared structures correlate remarkably well, hinting at a causal connection. In the light of previous observations and of theoretical investigations in the literature, we interpret our findings as further evidence of the scenario in which bars drive strong inflows toward their host nuclei: young bars are still in the process of perturbing the gas and star formation clearly delineates the shape of the bars; old bars on the contrary already removed any gas within their extents, carving a dead region of negligible star formation.
Key Words.:
Galaxies: structure – Galaxies: star formation – Galaxies: evolution1 Introduction
Stellar bars are common features in disc galaxies on a broad range of stellar masses and local environments (e.g. Jogee et al., 2004; Sheth et al., 2008; Barazza et al., 2008; Nair & Abraham, 2010; Masters et al., 2012; Skibba et al., 2012; Méndez-Abreu et al., 2012; Gavazzi et al., 2015). Because of their elongated shape, bars can exert a significant gravitational torque onto the host galaxy stellar and gaseous components, making these features one of the main drivers of galactic evolution (see e.g. Kormendy & Kennicutt, 2004; Kormendy, 2013; Sellwood, 2014, for recent reviews). In particular, the interaction between the bar and the ISM within the bar extent results in fast inflows of gas toward the galactic center (Sanders & Huntley, 1976; Roberts et al., 1979; Athanassoula, 1992; Sakamoto et al., 1999). Such inflows can trigger nuclear bursts of star formation (SF, as observationally confirmed by Ho et al., 1997; Martinet & Friedli, 1997; Hunt & Malkan, 1999; Jogee et al., 2005; Laurikainen et al., 2010), and, if the gas infall proceeds unimpeded, accretion episodes onto the central massive black hole (if present, e.g. Shlosman et al., 1989; Berentzen et al., 1998).
Only recently Verley et al. (2007), Cheung et al. (2013), Gavazzi et al. (2015) and Fanali et al. (2015) suggested that the prompt gas removal, if converted into stars on the short dynamical time-scale of the galaxy nucleus, quenches any SF in the central few kpc region of the galaxy. This scenario has strong implications for the evolution of the SF rate (SFR) observed in field disc galaxies as a function of their stellar mass, with the decline of the specific SFR (sSFR) observed in massive galaxies possibly linked to the formation of a stellar bar (Gavazzi et al., 2015; Consolandi et al., 2016). On the other hand, even if bars do not remove all the gas within their extent, they are expected to perturb the gas kinematics by pumping turbulence in the ISM, preventing the gas from fragmenting and decreasing the central SFR (e.g. Reynaud & Downes, 1998; Haywood et al., 2016).
In order to test the two above-mentioned scenarios, in this study we aim at mapping the distribution of gas in barred and unbarred galaxies. The most direct probe would require the direct imaging of molecular and neutral atomic gas. Unfortunately, such information is available only for a very limited sample of galaxies, and is often affected by either a too low angular resolution or a very limited field of view. However these problems can be overcome because the molecular gas distribution correlates strongly with the distribution of the cold dust component (Boselli et al., 2002). We take full advantage of such leverage by using the far–infrared (FIR) images from the Herschel Reference Survey (HRS, Boselli et al., 2010). We compare the Herschel data with the optical images from the Sloan Digital Sky Survey (SDSS, York et al., 2000). We study the correlation between the occurrence of bars in optical images and of either bar-like structures or central zones of no emission in the HRS. We further measure the extent of such optical and infrared structures and check whether they are correlated. For galaxies showing both an optical bar and an infrared bar-related structure we link their morphology to the star formation distribution as traced by H images (Kennicutt, 1998). Finally a qualitative comparison to the few available HI-maps tracing the atomic gas distribution is accomplished owing to the high resolution maps from the VIVA survey (Chung et al., 2009).
2 The Herschel Reference Sample
The galaxies analyzed in this work have been extracted from the Herschel Reference Survey, a volume-limited (15 25 Mpc), -band-selected sample of nearby galaxies spanning a wide range of morphological types, from ellipticals to dwarf irregulars, and stellar masses (108 M 1011 M⊙) that has been observed in guaranteed time with Herschel (Boselli et al., 2010).
Since the present work aims at performing a visual comparison of the ISM and of the stellar morphology in the HRS galaxies, we need a sufficient spatial resolution in both the IR and the optical images as well as a good sensitivity and little dust obscuration in the optical band. For this purpose we characterize the morphological properties of the stellar component and of the ISM using the SDSS images in the -band (Cortese et al. 2012) and the 160 m maps obtained with the PACS instrument (Cortese et al. 2014), respectively. At 160 m the resolution is FWHM = 11.4 arcsec, while the pixel size of the reduced maps is 2.85 arcsec pixel-1 (Cortese et al. 2014). This photometric band has been chosen among those available for the whole sample galaxies (22m from WISE, Ciesla et al. 2014; 100-500 m, Ciesla et al. 2012; Cortese et al. 2014) as the best compromise in terms of sensitivity, angular resolution and dust temperature. At this frequency the FIR emission gives the distribution of the cold dust component, which is a direct tracer of the molecular gas phase of the ISM (e.g. Boselli et al. 2002) from galactic to sub-kpc scales (Corbelli et al., 2012; Smith et al., 2012; Bolatto et al., 2013; Sandstrom et al., 2013). On the optical side, the -band is only little affected by dust and is the best SDSS tracer of the stellar mass of a galaxy, and is preferred to the -band for its higher sensitivity, while the H data are taken from Boselli et al. (2015). The SDSS, PACS and H images are available on the HeDaM database (http://hedam.lam.fr/).
Further on, we limited the analysis to the 261 late-type galaxies of the sample in order to avoid contamination from slow rotators (namely ellipticals, which do not develop bars, Sellwood, 2014) and from early-type disks (including S0s) that have too little cold gas to test the bar-related quenching process (Boselli et al., 2014). Finally we exclude galaxies with an axis ratio lower than to avoid a major inclination bias in our morphology classification and measures, leaving a final subsample of 165 late-type face-on galaxies.
3 Results
For each galaxy we visually inspect the -band SDSS images and look for the presence of an evident stellar bar.
Separately we also visually inspect the PACS images looking for a central carved region with little to no emission that, if present, is distributed
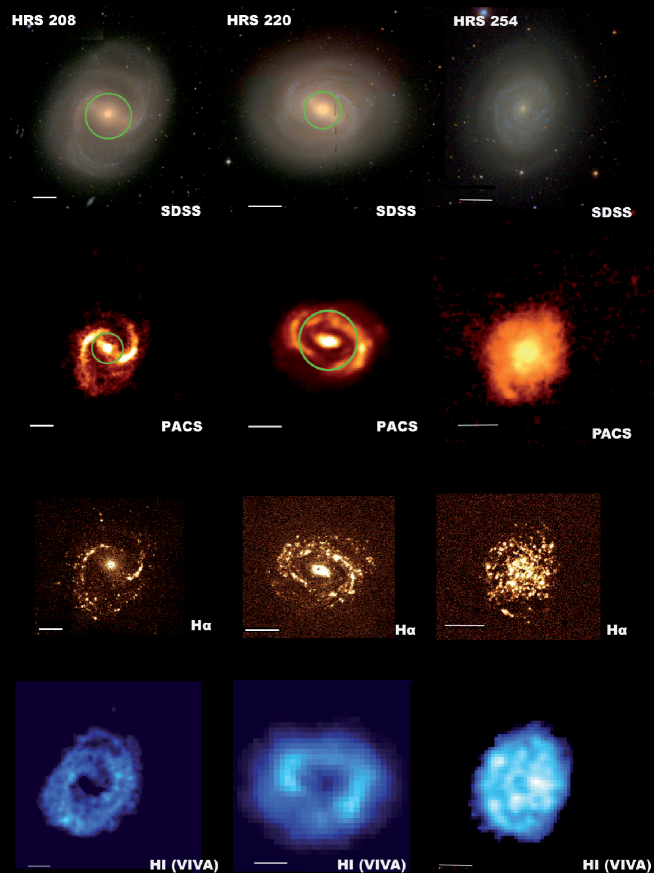
along a bar-like component (see Fig.1, HRS208) or in a small nuclear region surrounded by a ring-like structure (see Fig.1, HRS220).
In Fig. 1, from left to right, we show three illustrative cases representing the infrared morphologies
possibly associated with optical bars (column one and two, HRS 208 and 220) and a normal spiral galaxy (last column, HRS 254).
For each galaxy we give from top to bottom the
SDSS RGB, the 160 , the continuum subtracted H images and the HI map from the VIVA survey (Chung et al., 2009) that unfortunately
overlaps our sample only with few galaxies.
We find 51 barred galaxies ( of the sample) in the -band, out of which
show in the corresponding 160 images an elliptical/circular area where the only emission is distributed on
a bar- or ring-like structure.
On the other hand, we find 63 galaxies ( of the sample) hosting the described morphologies in the 160 images out of which 38 () galaxies are found barred in the
corresponding optical image.
The frequency of galaxies hosting an infrared feature that also show a corresponding optical bar, and the occurrence of optical bars showing
an infrared feature are and , respectively.
These percentages rise to and if we include 16 galaxies classified as barred by other literature classifications found in the
NASA Extragalactic Database (NED). These
are mostly weak bars that are difficult to recognize visually and whose extent is difficult to quantify. For this reason we exclude these objects from our further analysis.
In order to quantitatively relate the region of star formation avoidance to the presence of an optical bar, we measure the size of these structures visually in the optical and
in the 160 and then do the same using ellipse fits to isophotes. The two approaches are useful because the eye can effectively recognize features and their extent even if somewhat
subjective, while ellipse fits are objective measures that nevertheless can be strongly affected by other structures in the galaxies.
Four of the authors (GC, MD, FG, GG) manually evaluated the extent of optical bars by measuring the radius of
the circular region circumscribing the bar, avoiding possible HII regions at the end of it.
On the other hand, in the 160 images, when an infrared bar is present we measure the radius of
the circle circumscribing the bar while, when no clear bar is discernible, we measure the inner semi-major axis of the ring-like
structure surrounding the depleted region (as depicted in Fig. 1).
For the optical bars showing the region of avoidance in the 160 images we also visually inspect the continuum subtracted H images
finding similar morphologies and repeat the same measure.
Using IRAF111IRAF (Image Reduction and Analysis Facility) is a software for the reduction and analysis of astronomical data. task , ellipticity () and position angle (P.A.) radial profiles of the isophotes of each sample galaxy
in each considered band.
In optical broad-bands, it is well tested that the radius at which there is a peak in the ellipticity profile
and a related plateau in the P.A. profile is a good proxy for the extension of the bar (Jogee et al., 2004; Laurikainen et al., 2010; Consolandi, 2016).
Following this procedure we extract a radius of the bar in the -band for each galaxy and,
we deduce the bars strength following (Laurikainen et al., 2007) from the peak of the profile in the -band. We find that of galaxies that we classified as barred
harbor strong bars ().
Although this quantitative method has not been applied to far-IR data previously, ellipse fits can nevertheless be derived for the 160 images and the and P.A. profiles
examined for a bar signature. Since we are trying to measure a region of decreased emission possibly surrounded by a ring-like
emitting structure, we also extract a radial surface brightness profile from concentric elliptical apertures centered on the galaxy and ellipticity fixed to the outer infrared isophotes.
The derived surface brightness profile therefore has a relative maximum in correspondence of the ring-like structure.
In the cases where no infrared bar is discernible, the radius at which this occurs is a good proxy of the extension of the non emitting region.
In the 160 images, this method succeeds at extracting the radius of the non emitting region or of the bar in of the barred galaxies.
Because of the irregular and clumpy distribution of light at 160 the fit of the isophotes does not converge in of the galaxies.
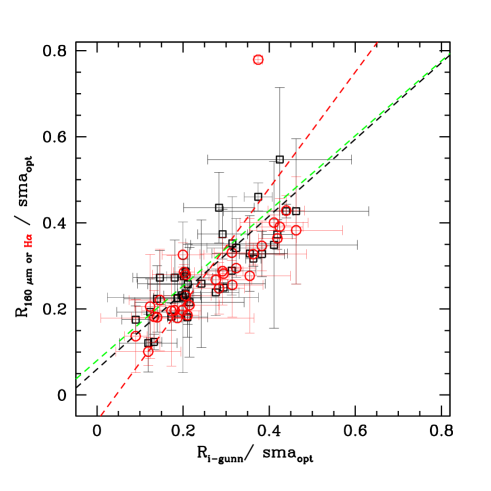
Therefore, in order to preserve the statistics of our already limited sample, we plot in Fig. 2 the radius obtained averaging the measures of the optical bars
made by the authors versus those from the 160 data (black empty dots) and those from the continuum subtracted H images (red empty dots).
All radii are normalized to the -band mag isophote radius of the galaxy, taken from Cortese et al. (2012), and errors are evaluated from the standard deviation of our measurements.
The black and red dashed lines indicate the bisector fit (Isobe et al., 1990) to the data respectively for the 160 (slope ) and the H data (slope ).
The slope of the fit relative to the optical versus H data is strongly influenced by the extremely deviant point (associated to HRS 322) visible in Fig. 2. This outlier is characterized
by a very small error, as all the authors consistently measured the same radius with very little scatter. We stress, however, that
the semi-major axis of this galaxy in the H
distribution is perpendicular to the optical bar (see the optical and H image in the online material) thus the important discrepancy is mostly due to projection effects. If we exclude this point
from the fit, the slope becomes .
Finally, in green, we plot the best linear fit of the comparison of optical versus 160 radii measured with IRAF (slope ).
All fits show a strong consistency between them even when evaluated with independent methods.
To further check a possible bias due to inclination, we derived the same fits for a subsample of galaxies with axis ratio greater than 0.7 ( of the sample),
finding fully consistent results.
4 Discussion and conclusions
The study and comparison of frequencies of occurrence of bar related features in the optical and FIR, as traced by the stellar continuum and by warm dust emission, respectively, results in a fraction of galaxies hosting an optical bar of while a zone of avoidance with or without an infrared bar is found in of the 160 images. The percentages of common occurrence suggests that FIR images are an effective way of identifying the presence of a bar in a galaxy.
For the galaxies hosting both an optical bar and a central zone of avoidance in the 160 images, we measured the angular size of both structures with independent methods, finding a good correspondence. First, we measured the extent of bars in optical images, while in the FIR images we measured the extent of the bar-like structure, if present, or of the inner semi-major axis of the ring-like structure. In the latter case, we stress that the projected angular sizes of the optical bar and the radius of non-emitting zone may differ significantly222Up to a factor of for the maximum inclination of allowed in our sample. depending on the bar orientation. In of the barred galaxies we successfully ran the IRAF task to objectively measure the extent of these structures in both the -band and 160 images, using the derived ellipticity, P.A. and surface brightness profiles. The goodness of the correlation strongly hints at a physical connection between the presence of an optical strong bar and a gas-depleted/quenched region where little SF is still possible. Only in the very center (where the bar conveys the gas originally within its reach) or along the bar is SF found. Such an effect is consistent with what we see in the continuum subtracted H images of the sample. SF is indeed distributed mainly in the nuclear region of galaxies and/or along the bar (consistent with Verley et al. (2007); see Fig. 1) and shows a morphology similar to the one observed in the FIR.
We conclude that the FIR morphologies are similar to the H morphologies (consistent with Verley et al., 2007) and that both are consistent with bar-driven inflows of gas inside the corotation radius as predicted by simulations (Sanders & Huntley, 1976; Athanassoula, 1992). Fig. 1 qualitatively show that also the HI emission, when avilable, show similar mophologies. The impact on the cold gas component, as derived from the FIR, is consistent to what has been observed in few galaxies (Sakamoto et al., 1999) and affects the star formation of barred galaxies (Verley et al., 2007; Gavazzi et al., 2015): as soon as a bar starts growing, the gas is initially perturbed and compressed along the bar, where it forms stars while gradually losing its angular momentum; as the time goes by, the gas is swept by the bar into sub-kpc scales, leaving a gas-depleted and SF quenched region of the size of the bar itself, with or without a central knot of SF depending on the consumption timescale of the originally infalling gas.
Acknowledgements.
We thank the anonymous Referee and the Editor, Francoise Combes, for their constructive criticism. This research has been partly financed by the French national program PNCG , and it has made use of the GOLDmine database (Gavazzi et al. 2003, 2014b) and SDSS Web site http://www.sdss.org/.References
- Athanassoula (1992) Athanassoula, E. 1992, MNRAS, 259, 345
- Barazza et al. (2008) Barazza, F. D., Jogee, S., & Marinova, I. 2008, ApJ, 675, 1194
- Berentzen et al. (1998) Berentzen, I., Heller, C. H., Shlosman, I. & Fricke, K. 1998, MNRAS, 300, 49
- Bolatto et al. (2013) Bolatto, A. D., Wolfire, M., & Leroy, A. K. 2013, ARA&A, 51, 207
- Boselli et al. (2002) Boselli A., Lequeux J., & Gavazzi G. 2002, A&A, 384, 33
- Boselli et al. (2010) Boselli A., Eales S., Cortese L., et al. 2010, PASP, 122, 261
- Boselli et al. (2014) Boselli, A., Cortese, L., Boquien, M., et al. 2014, A&A, 564, A66
- Boselli et al. (2015) Boselli, A., Fossati, M., Gavazzi, G., et al. 2015, A&A, 579, A102
- Cheung et al. (2013) Cheung, E., Athanassoula, E., Masters, K. L., et al. 2013, ApJ, 779, 162
- Chung et al. (2009) Chung, A., van Gorkom, J. H., Kenney, J. D. P., Crowl, H., & Vollmer, B. 2009, AJ, 138, 1741
- Ciesla et al. (2012) Ciesla L., Boselli A., Smith M. W. L., et al. 2012, A&A, 543, A161
- Ciesla et al. (2014) Ciesla L., Boquien M., Boselli A., et al. 2014, A&A, 565, A128
- Consolandi et al. (2016) Consolandi, G., Gavazzi, G., Fumagalli, M., Dotti, M., & Fossati, M., 2016, A&A, 591, A38
- Consolandi (2016) Consolandi, G. 2016, arXiv:1607.05563
- Corbelli et al. (2012) Corbelli, E., Bianchi, S., Cortese, L., et al. 2012, A&A, 542, A32
- Cortese et al. (2012) Cortese L., Boissier S.,Boselli A., et al. 2012, A&A, 544, A101
- Cortese et al. (2014) Cortese L., Fritz J., Bianchi S., et al. 2014, MNRAS, 440, 942
- Fanali et al. (2015) Fanali R., Dotti M., Fiacconi D., & Haardt F. 2015, MNRAS, 454, 3641
- Gavazzi et al. (2003) Gavazzi, G., Boselli, A., Donati, A., Franzetti, P., & Scodeggio, M. 2003, A&A, 400, 451
- Gavazzi et al. (2014) Gavazzi, G., Franzetti, P., & Boselli, A. 2014, arXiv:1401.8123
- Gavazzi et al. (2015) Gavazzi, G., Consolandi, G., Dotti, M., et al. 2015, A&A, 580, A116
- Haywood et al. (2016) Haywood M., Lehnert M.D., Di Matteo P., et al. 2016, A&A, 589, A66
- Ho et al. (1997) Ho L. C., Filippenko A. V., Sargent W. L. W., 1997, ApJ, 487, 591
- Hunt & Malkan (1999) Hunt L. K., Malkan M. A., 1999, ApJ, 516, 660
- Isobe et al. (1990) Isobe, T., Feigelson, E. D., Akritas, M. G., & Babu, G. J. 1990, ApJ, 364, 104
- Jogee et al. (2004) Jogee, S., Barazza, F. D., Rix, H.-W., et al. 2004, ApJ, 615, L105
- Jogee et al. (2005) Jogee, S., Scoville, N., & Kenney, J. D. P. 2005, ApJ, 630, 837
- Kennicutt (1998) Kennicutt, R. C., Jr. 1998, ARA&A, 36, 189
- Kormendy & Kennicutt (2004) Kormendy, J., & Kennicutt, R. C., Jr. 2004, ARA&A, 42, 603
- Kormendy (2013) Kormendy, J. 2013, Secular Evolution of Galaxies, 1
- Laurikainen et al. (2007) Laurikainen, E., Salo, H., Buta, R., & Knapen, J. H. 2007, MNRAS, 381, 401
- Laurikainen et al. (2010) Laurikainen, E., Salo, H., Buta, R., Knapen, J. H., & Comerón, S. 2010, MNRAS, 405, 1089
- Martinet & Friedli (1997) Martinet L., & Friedli D., 1997, A&A,323,363
- Masters et al. (2012) Masters, K. L., Nichol, R. C., Haynes, M. P., et al. 2012, MNRAS, 424, 2180
- Méndez-Abreu et al. (2012) Méndez-Abreu, J., Sánchez-Janssen, R., Aguerri, J. A. L., Corsini, E. M., & Zarattini, S. 2012, ApJ, 761, L6
- Nair & Abraham (2010) Nair, P. B., & Abraham, R. G. 2010, ApJ, 714, L260
- Reynaud & Downes (1998) Reynaud, D., & Downes, D. 1998, A&A, 337, 671
- Roberts et al. (1979) Roberts W.W., Jr., Huntley J. M., & van Albada G.D. 1979, ApJ, 233, 67
- Sanders & Huntley (1976) Sanders, R. H. & Huntley, J. M. 1976, ApJ, 209, 53
- Sandstrom et al. (2013) Sandstrom, K. M., Leroy, A. K., Walter, F., et al. 2013, ApJ, 777, 5
- Sakamoto et al. (1999) Sakamoto, K., Okumura, S. K., Ishizuki, S., & Scoville, N. Z. 1999, ApJ, 525, 691
- Sheth et al. (2008) Sheth, K., Elmegreen, D. M., Elmegreen, B. G., et al. 2008, ApJ, 675, 1141
- Sellwood (2014) Sellwood, J. A. 2014, Reviews of Modern Physics, 86, 1
- Shlosman et al. (1989) Shlosman I., Frank J., Begelman M.C., 1989, Nature, 338, 45
- Smith et al. (2012) Smith, M. W. L., Eales, S. A., Gomez, H. L., et al. 2012, ApJ, 756, 40
- Skibba et al. (2012) Skibba, R. A., Masters, K. L., Nichol, R. C., et al. 2012, MNRAS, 423, 1485
- Verley et al. (2007) Verley, S., Combes, F., Verdes-Montenegro, L., Bergond, G., & Leon, S. 2007, A&A, 474, 43
- York et al. (2000) York, D. G., Adelman, J., Anderson, J. E., Jr., et al. 2000, AJ, 120, 1579