The emergence of pseudo-stable states in network dynamics
L. Hedayatifar1, F. Hassanibesheli1, A. H. Shirazi1, S. Vasheghani Farahani 2, G. R. Jafari1,3,∗
1 Department of Physics, Shahid Beheshti University, G.C., Evin, Tehran 19839, Iran
2 Department of Physics, Tafresh University, Tafresh 39518 79611, Iran
3 The Institute for Brain and Cognitive Science (IBCS), Shahid Beheshti University,
G.C., Evin, Tehran 19839, Iran
4 Center for Network Science, Central European University, H-1051, Budapest, Hungary
E-mail: g_jafari@sbu.ac.ir
Abstract
In the context of network dynamics, the complexity of systems
increases possible evolutionary paths that often are not
deterministic. Occasionally, some map routs form over the course of
time which guide systems towards some particular states. The main
intention of this study is to discover an indicator that can help predict
these pseudo-deterministic paths in advance. Here we
investigate the dynamics of networks based on Heider balance theory
that states the tendency of systems towards decreasing tension. This
inclination leads systems to some local and global minimum tension
states called ”jammed states” and ”balanced states”, respectively.
We show that not only paths towards jammed states are not completely
random but also there exist secret pseudo deterministic paths that
bound the system to end up in these special states. Our results
display that the Inverse Participation Ratio method (IPR) can be a
suitable indicator that exhibits collective behaviors of systems.
According to this method, these specific paths are those that host
the most participation of the constituents in the system. A direct
proportionality exists between the distance and the selectable paths
towards local minimums; where by getting close to the final steps there is no other way but
the one to the jammed states.
keywords: Network dynamics, Balance theory, Jammed state, Participation
Introduction
In every society there is a common question; what happens tomorrow, or what comes next? It is not easy to answer this question unless you gain insight on the A to Z of that society. A society consists of a collection of members that are not exactly independent of each other. In fact they might very much influence each other either by gossip [1] or in a viral fashion [2]. This dependency increases the complexity and possible paths that a system can experience. As a self-organized process, societies evolve towards a lower stress status among members (the least stress principle) [3, 4, 5]. This principle deforms the topology of societies, eventually gaining stability [6]. Now how could one gain a physical insight on the structure and dynamics of such systems? One answer owes its existence to the concept of Hamiltonian. As such, a smart technique that could be implemented to deal with such issues is to relate a Hamiltonian to the system and study its evolution [7]. Although the Hamiltonian equations provide a platform for issuing statements on the tendency of societies towards lower energy states [6, 8], but due to the number of possible paths, the Hamiltonian could not give us a clear picture of the next steps. The query that we try to answer here is whether there is an indicator to uncover hidden pseudo-deterministic paths towards special states? In the present study since we will be dealing with the sociability of the members in a society, we implement the Heider balance theory [3]. The decrease of energy in these societies would eventually lead to local or global minimum energy states named as the jammed states or balanced states [5, 6].
By talking of systems in which their members influence each other, the concept of collectivity comes in to play [9, 10, 11]. The collective behavior plays effective on the evolution of such systems, in a sense that it provides foundations for the creation of communities. However, this is not in contradiction with the least energy principle, in fact it supports it [6]. To state clearer; the selected path in order to lower the energy, is the will of the collective behavior in the system. In systems which evolve regarding Heider balance theory, when the energy obtains its lowest value (the balanced states), the system would perform either a single or double community; where the former is called a paradise state and the latter is called a bipolar state. The paradise state refers to a system that all of its members are friends with each other, while the bipolar state refers to a system that consists of two main groups where the members of each group are friends with each other without being friends with any member of the other group. In these networks, there are many paths that eventually lead to balanced states. If a route other than that leading to a balanced state is taken, one would end up in a state of local minimum energy named as a jammed (pseudo stable) state, see [12]. Talking of energy, Marvel et al. [6] showed that if the energy is descending from to these jammed states only occur between zero and . However, there is a direct proportionality between the energy value of the occurrence of the jammed state and the number of communities in the network. They showed that; as the energy value of the jammed state occurrence tends to zero, the system becomes more complex due to the increase of the number of communities. In this work we show that near the local and global balanced states where communities start to perform, the participation of individuals in a collective act increases.
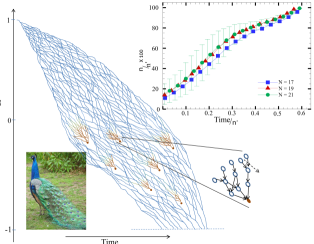
After this introduction we proceed with our aims; our intention is to emphasis the characteristics and features of jammed states. The question to be answered is that although we know that the balanced state implies a minimum stress condition and hence a minimum energy state, why do the jammed states come in to play? do jammed sates perform as a sudden event over the evolution of the system? or they are special states at the end of a desired path. In this line we need to understand the procedure in which the jammed states emerge from other events, see also Zhihao [13]. However to give a flavour of how these jammed state looks, we have sketched Fig. 1. The jammed states are shown as red points where one has been magnified for providing a closer look. These jammed states are points that one experiences while moving towards lower energy levels from left to right, and are dead ends with no further freedom to move on. To highlight this issue we change the color of lines from blue to red in order to show the formation of pseudo paths towards these jammed states. The top right panel in Fig. 1 is an indicator providing information the probability of getting a step closer to a jammed state. In the following, we use the inverse participation ratio method (IPR) [14, 15] to quantify the amount of individuals’ participation in forming a state. We take the evolution of IPR as an indicator to help recognize the jammed states in advance.
1 The evolving network
In the context of social network dynamics, everything lies on the fact that tension must be reduced. This is in a sense that every node (as a main actor) intends to reduce its tension with its surroundings. As a matter of fact, the ambition to reduce the tension justifies the root that the network selects as it evolves. In this line, a good theory has been proposed by Heider named as the balance theory [3], where he studied the relation between two persons and their attitude regarding an event. He referred positive/ negative signs for the links between every two nodes. Cartwright et al. [4] took a further step and developed this theory for social network applications. In this context the positive sign would indicate for instance; friendship [16, 17], attractiveness [18], profit [19], tolerant [20], where the negative sign would indicate their opposite. Nonetheless, it is the concept of these positive or negative links that provide basis for understanding what is going on around us [21, 22], see also refs [24, 25] for analytical and refs [26, 27, 28, 17] for numerical models. In this model, the network is considered completely connected, meaning that every node is related to all other nodes, see e.g. refs [29, 30] for a mathematical description of neighbour node effectiveness. This enables modeling the relations between students in a classroom, members of a club [10, 31], representatives of countries in the United Nations [7, 22] and epidemic spreading on evolving signed networks [23].
Now this is how it goes; the relation (link) between the members (nodes) and is represented by , where if and are equal, we would have . If the status between two nodes is friendship/enemy, we would have for the values of 1 and -1, respectively [4]. This imposes that for a three node system which shapes a triangle, a balanced triangle is formed only when the product of the values assigned for the links () between every two nodes has a positive sign. Hence, we would have two balanced and two unbalanced states. Note that the tendency is to have a balanced triangle, which implies that as the network evolves, the unbalanced triangles eventually become balanced. However, in case of a weighted network where not all the nodes are connected to each other, Estrada & Benzi provided a method for measuring how balanced the situation is [32]. Since the balanced and unbalanced states for the triangles are respectively referred to as the negative and positive energies, a Hamiltonian definition for these triangles is provided
| (1) |
where is the size of the network [7]. Note that the energy is obtained by subtracting the number of unbalanced triangles from the number of balanced triangles and normalizing to the total number of triangles. Hence, the Hamiltonian in Eq. (1) obtains values only between and . By having in hand the Hamiltonian of a system together with the trend in which the energy is reducing, a model for its dynamics could be provided.
We start by considering a completely unbalanced network where all relations are initially poor. The reason for this selection is to foresee all the possible paths appearing in the evolution of the network right from the beginning. This is how it goes; randomly select a link and switch it to its opposite sign, if only the total energy of the network is reduced (even if a local energy in one triangle is increased), this selection is accepted. If flipping the link does not change the total energy, it is accepted by probability . Otherwise the selected link is rejected and another link must be chosen [5]. If the process guides the system to its minimum global energy state or on other words a state that all triangles have become balanced (stable state); two conditions would be attained based on the initial conditions of the network. The system could either attain a state called ”paradise” or a state called ”bipolar”. Now if the system does not finally become paradise or bipolar, it has surly been trapped somewhere, it is then that the system is in a jammed or a pseudo-stable state. Note that in jammed states although unbalanced triangles still exist, but any changes in the system would lead to an increase of energy.
2 Results and discussions
A community is not just constructed by its constituents but also by the relation between its constituents. It is due to this relation that macroscopic concepts like social and cultural laws in societies and magnetization in physics emerge. This not only affects the constituents individually, but also affects their collective behaviour, which puts the dynamics and evolution of their community in order. Although it is believed that the path towards the minimum energy state is always selected by the system, whether if there are specific patterns leading to the stable states? Now if there are specific paths, at what stage or time before reaching the stable states do they perform? But are all the paths towards the minimum energy state probable? or is there some desired paths? The results presented here prove that the collective behavior of the constituents play a significant role on the path of their evolution. Near the local and global minimum energy states some patterns start to form which host collective behaviors. In a sense that local minimum tension states in the middle of the network dynamics do not happen randomly.
Before continuing any further we ought to define a new concept in this context named as participation, and state its difference with community. Community refers to nodes that have little separation lengths or are somehow consented with each other. But participation refers to a condition where all the constituents have a mutual concern. Now this mutual concern on a matter could have various aspects due to the different viewpoints of the constituents. In case of a full agreement between the constituents, the concept of community comes into play, while in case of a complete disagreement, chaos arises, leaving a chaotic situation on our hands. However these are two limiting situations where depending on the importance of the issue, the system could be in any situation in between these two limits. Now being in either of the two limiting cases means that the issue under consideration is of high importance, which requires a high participation of the constituents.
Marvel et al. [6] showed that when a system has more than two communities, the system is in a jammed state, where the number of communities is directly proportional to their energy levels. In other words, when the number of communities increases, the jammed states perform in higher energy levels. We find that if we are on a path that has a connection to a jammed state; the further away from the jammed state we are, the more chances we have to avoid ending up at the jammed state. This means that near these states the number of possible links which can be flipped and take the system in a path away from a jammed state decrease very fast. In fact, there is a characteristic length scale from a jammed state that greater than that, the chance of entering a root towards a jammed state is not provisioned, or in other words is random, see the panel inside Fig. 1. Regarding the new introduced concept, participation, we show that in the neighbourhood of these jammed states, the constituents participation start to increase, in a sense that the paths that would lead to the jammed states could be recognized in advance. This clearly indicates that since jammed states are proofs for the existence of communities, the act of participation increases as the distance to the jammed state gets smaller than the characteristic length scale. This leads us to conclude that participation is directly proportional to the formation of communities. Strictly speaking, participation is a sign of community formation.
2.1 Role of participation
We now proceed by conducting a deeper exploration inside the network by shedding light on the organizers of all this. Thus, we study the jammed and balanced states regarding the behaviour of the eigenvalues, eigenvectors together with the participation ratio. Note that although the eigenvectors are usually used for community detection [33, 34, 35, 36, 37], but here we use them as a measure for the participation. For instance, in a network consisting of two communities, it is claimed that the positive/negative components of the eigenvector corresponding to the greatest eigenvalue, is responsible for their detectance [36, 38]. But in a network consisting of several communities, one can not just rely on the information provided by the greatest eigenvalues [36, 39]. It is in such cases that looking at more eigenvalues would provide more reliable information. Note that although it is the sign of the components of the eigenvector that indicates the community that hosts a node, but it is the magnitude of the components of the eigenvector that provides information on the amount of a node’s participation. In other words; the greater the magnitude of the eigenvector components, the greater the share of participation. The question that arises here is on the value of this participation. The method implemented in the present study for estimating the amount of participation of each node is the inverse participation ration (IPR) obtained by [40, 41, 42]
| (2) |
where is the th component of the eigenvector corresponding to a specific eigenvalue. Note that the efficiency of the participation is directly proportional with the distance of from zero, no matter in what direction. This means that the state of minimum participation where all the components of the eigenvector are zero, except for one (which is equal to unity), the IPR is in its minimum state. Now if the other components of the eigenvector start to increase, the IPR would also increase until it attains its maximum value. To comply with the aims of the present work we need to understand the IPR variations of the eigenvalues that contain information.
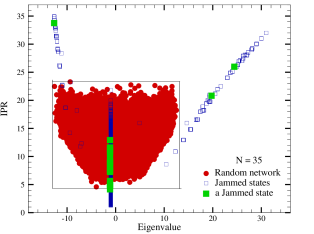
Consider a network which is fully connected and undirected, the interaction matrix of its constituents is symmetric with all diagonal components equal to zero. Note that since the matrix is diagonal its eigenvalues are real. In this stage it is important to flag out the most effective eigenvalues, therefore we compare the eigenvalue spectra of the jammed states with the eigenvalue spectra extracted from a random network with positive/negative links, see Fig. 2. Due to the nature of all random processes, a random network hardly possesses any information to rely on. Based on this statement, one could simply deduce that any deviation from a random curve would increase the reliability of the information extracted from it [43]. In other words, the reliability of the results extracted from a curve is directly proportional to the deviation from its corresponding random curve. In Fig. 2, the divergence of the eigenvalues of the jammed states from the random network (bulk) in terms of the IPR is shown for a node network. The red circles represent the eigenvalues of a random network ensemble, the blue squares represent the eigenvalues of various jammed states, and the green squares represent eigenvalues for a specific jammed state. It could readily be noticed that two of the eigenvalues indicated by green squares lie at the right of the bulk and one lies at the left of the bulk. As stated earlier, the eigenvalues located inside the bulk are not much of importance. This is due to their overlapping with other eigenvalues inside the bulk corresponding to a random network. But the important thing is the eigenvalues outside the bulk, where the green eigenvalue on the left of the bulk represents the lowest eigenvalue of the jammed state, and the two on the right represent the greatest and the second greatest eigenvalues of that jammed state.
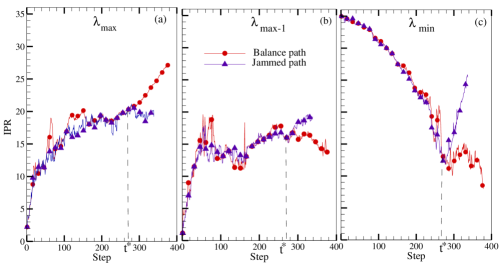
We draw attention to the informational content of the eigenvalues and study the IPR evolution of the states in our working network. Note that in this line we need only focus on three eigenvalues (on their ways to the balanced or jammed states) which lie outside the bulk of the random network, see Fig. 2. We investigate the evolution of IPR corresponding to these three eigenvalues. By having in hand the information extracted from these eigenvalues, it will be possible to understand the IPR evolution for that network. It enables estimating the participation percentage of the nodes. This enables the prediction of the pattern of the network’s dynamics that leads to jammed states. Fig. 3 illustrates the evolution of IPR for the three working eigenvalues of our node network. The IPR corresponding to the eigenvector of the greatest eigenvalue, , has an elevating trend towards the stable state no matter balanced or jammed. In such a situation the stable state is achieved by participation at its highest level. But the IPR that corresponds to the eigenvectors of the other two eigenvalues, and , take their roots according to their tendency towards either balanced or jammed states. Hence, the information of the paths leading to the jammed states are mostly possessed by and , see the two right panels of Fig. 3 which readily illustrates their divergence.
It is now time to illustrate two examples for better understanding the statements of the previous paragraphs. The first example is in application to societies, while the second deals with magnetic media. For the former example, consider a society that every person constituting it has its own intentions. When the dynamics of such a society tends towards a decreasing tension level, the people would start collaborating with each other due to the peace in mind that the low tension level has offered them. In such a system the people are likely to talk to each other more, this makes people notice their common intentions. The result would increase the participation rate of the people in the society. Due to the common intentions of the individuals in that society the process of adding up occurs, which would eventually lead the society to be in either a balanced or jammed state. Now if the adding up of common people with common interests results in the creation of one or two groups, the state is considered balanced. But if more than two groups of people are created, the society is considered to be in a jammed state. For the latter example consider a magnetic system; reduce the heat and obtain a lower energy level, the result would be the performing of various magnetic domains. All magnetic field lines in one domain point at the same direction, but each domain has its own direction. Now if there exists one or two domains with different directions, the state is balanced. But if more than two domains with different directions exist, the state is jammed.
2.2 A qualitative approach
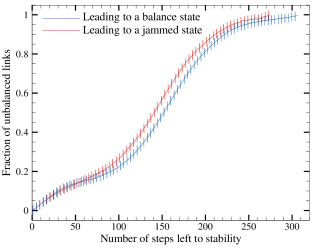
By putting all the pieces together we can now state that for a network it is not simple to predict what happens next. There seems to be a secret in the dynamics of the networks that gradually decreases the number of options available for avoiding a jammed state. To be precise, in a network there is a potential that bounds us in a path that makes it inevitable to end up in a specific jammed state. This means that the chance for taking paths that lead to lower energy states rapidly fade away. This statement could also be supported by a qualitative approach in application to dynamics of the links. Our working links are the unbalanced links defined by , where their sign flip directs the evolution process. Nonetheless, a matrix representation of the set of unbalanced links stands only if the constrain is respected. Now a flip of an unbalanced link would affect the next system of unbalanced links in two manners: in one way it changes the sign of , and in the other it changes all the entities of the th row and th column of by . Thus, the evolution process of the system could be influenced by only if their values are near zero. Otherwise, the only term that contributes to the evolution process is . Now if the entities are far from zero, the evolution process would send out one member of the unbalanced set in the course of every iteration. In Fig. 4 a validation of the assertion is provided by demonstrating the fraction of the unbalanced links for each time step for both dead ended balanced and jammed states. Note that the plot in Fig. 4 is retrospective, starting from the last time step. The linear behavior of the curves just approaching the final states is due to the fact that the absolute values of entities could possibly be much greater than zero. Therefore it supports the statement that flipping a link removes only one link from the set. Such a linear behavior implies that the system is trapped in an attractor basin a few steps left to the fixed point. This provides basis for developing a criterion to enable forecasting the system. This clearly proves the constriction possessed by the phase space in the vicinity of the final states.
3 Conclusions
In a network with a high level of complexity, the balanced theory implies the type of interactions between the constituents of the network to provide prohibition on some paths leading to the minimum energy state. Out of all the existing possible ways for the evolution of a network, sometimes there are only few alternative paths of change. However, in some cases there isn’t even another. It seems while evolving, there is a push to lead the network to special points. The secret that has been unveiled in the present work is nothing but participation. As a matter of fact it is the participation of the constituents of a society that dictates the paths towards the lower energy levels. The roots towards the minimum energy levels, rapidly decline, which would eventually lead you to a path with no return. It is in such a situation that you are almost at a local energy level or a jammed state. Hence the accumulation or adding up of constituents on jammed state is a product of participation in the network. When a system enters a path towards a jammed state, it is condemned to limbo where any effort could not change the destiny of the system. We consider the inverse participation ratio method (IPR) as a suitable indicator that can quantify the participation in forming a specific state. Here we investigated the evolution of IPR corresponding to the eigenvectors of eigenvalues containing information.
Provided that the picture illustrated in the present study is well understood; a sophisticated program based on the architecture of the community resulting in individuals best interest could be directed and managed. Also by learning the prospective paths towards glory, a lovely community could be developed.
Acknowledgment: The authors would like to thank Prof. Muhamad Sahimi for his constrictive comments and helping to edit the manuscript. The research of GRJ was supported by the Higher Education Support Program of OSF and the Central European University.
References
- 1. Traag Vncent A, Van Dooren P, De Leenhee P (2013) Evolution of the Digital Society Reveals Balance between Viral and Mass Media Influence. PLoS ONE 8(4):e60063.
- 2. Kleinberg K, and Boguñá M (2014) Evolution of the Digital Society Reveals Balance between Viral and Mass Media Influence. Phys. Rev. X 4:031046.
- 3. Heider F (1946) Attitudes and cognitive organization. J Psychol 21:107-112; Heider F (1958) The Psychology of Interpersonal Relations. Wiley, New York.
- 4. Cartwright D, Harary F (1956) Structure balance: A generalization of Heider?s theory. Psychol Rev 63:277-293.
- 5. Antal T, Krapivsky P, Redner S (2006) Social balance on networks: The dynamics of friendship and enmity. Physica D 224:130-136.
- 6. Marvel SA, Kleinberg J, Strogatz SH (2009) The energy landscape of social balance. Phys Rev Lett 103:198701.
- 7. Axelrod R, Bennett DS (1993) A landscape theory of aggregation. Brit J Polit Sci 23:211-233.
- 8. Qian-Ming Z, Linyuan L, Wen-Qiang W, Yu-Xiao Z, Tao Z (2013) Potential Theory for Directed Networks. PLos ONE 8(2):e55437.
- 9. Albert R, Barabasi A-L (2000) Topology of evolving networks: Local events and universality. Phys Rev Lett 85:5234-5237.
- 10. Rijt A (2011) The Micro-Macro Link for the Theory of Structural Balance. Journal of Mathematical Sociology, 35:94-113.
- 11. Shirazi A, Namaki A, Roohi AA and Jafari GR (2013) Transparency Effect in the Emergence of Monopolies in Social Networks, Journal of Artificial Societies and Social Simulation 16 (1) 1.
- 12. Antal T, Krapivsky PL, Redner S (2005) Dynamics of social balance on networks. Phys. Rev. E 72, 036121.
- 13. Wu Zhihao, Menichetti Giulia, Rahmede Christoph, & Bianconi Ginestra (2015) Emergent Complex Network Geometry, Scientific Reports 5, 10073.
- 14. Jamali T, Jafari GR (2015) Spectra of empirical autocorrelation matrices: A random-matrix-theory–inspired perspective. EPL (Europhysics Letters) 111 (1), 10001.
- 15. Mobarhan NSS, Saeedi A, Roodposhti FR, Jafari GR (2016) Network trending; leadership, followership and neutrality among companies: A random matrix approach. Physica A 462, 858-863.
- 16. Kunegis J, Lommatzsch A, Bauckhage C (2009) The slashdot zoo. In: Proceedings of the 18th international conference on World wide web - WWW 2009. New York, New York, USA: ACM Press, p.741.
- 17. Esmailian P, Abtahi SE, and Jalili M (2014) Mesoscopic analysis of online social networks: The role of negative ties. Phys. Rev. E 90:042817.
- 18. Doreian P (2004) Evolution of Human Signed Networks. Metodoloski zvezki 2:277-293.
- 19. Guha RV, Kumar R, Raghavan P, Tomkins A (2004) Propagation of trust and distrust, in: Proceedings of WWW 2004, ACM Press, New York.
- 20. Aguiar F, A Parravano (2013) Tolerating the Intolerant: Homophily, Intolerance, and Segregation in Social Balanced Networks, Journal of Conflict Resolution 00(0):1-22.
- 21. Zachary WW (1977) An information flow model for conflict and fission in small groups. J. Anthropol Res 33:452-473.
- 22. Moore M (1978) An international application of Heider’s balance theory. Eur J Soc Psychol 8:401-405; Moore M (1979) Structural balance and international relations. Eur. J. Social Psychology 9:323-326.
- 23. Saeedian M, Azimi-Tafreshi N, Jafari GR, Kertesz J (2016) Epidemic spreading on evolving signed networks. ArXiv:1607.06782.
- 24. Marvel SA, Kleinberg J, Kleinberg RD, Strogatz SH (2011) Continuous-time model of structural balance. Proc. Natl. Acad. Sci. U S A 108:1771-6.
- 25. Kuakowski K, Gawroski P, Gronek P (2005) The Heider balance-a continuous approach. Int J Mod Phys C 16:707-716
- 26. Leskovec J, Huttenlocher D, Kleinberg J (2010) Predicting positive and negative links in online social networks, in: Proceedings of WWW’2010, ACM Press, New York.
- 27. Szell M , Lambiotte R, Thurner S (2010) Multirelational organization of large-scale social networks in an online world, Proc. Natl. Acad. Sci. USA 107:13636.
- 28. Zheng X, Zeng D and Wang F-Y (2014) Social balance in signed networks. Information Systems Frontiers: 1-19.
- 29. Gleeson James P (2013) Binary-State Dynamics on Complex Networks: Pair Approximation and Beyond. Phys. Rev. X 3:021004.
- 30. Lee DS (2014) Evolution of regulatory networks towards adaptability and stability in a changing environment. Phys. Rev. E 90:052822.
- 31. Doreian P, Mrvar A (1996) A partitioning approach to structural balance. Social Networks 18:149-168.
- 32. Estrada E, and Benzi M (2014) Walk-based measure of balance in signed networks: Detecting lack of balance in social networks, Phys. Rev. E 90:042802.
- 33. Newman M E J (2006) Finding community structure in networks using the eigenvectors of matrices, Phys. Rev. E 74:036104.
- 34. Newman M E J (2006) Modularity and community structure in networks, Proc. Natl. Acad. Sci. USA 103:8577-8582.
- 35. Kunegis J, Schmidt S, Lommatzsch A, Lernery J, De Luca E W, and Albayrak S (2010) Spectral Analysis of Signed Graphs for Clustering, Prediction and Visualization: Siam Conference on Data Mining 2010. (Society for Industrial and Applied Mathematics, Philadelphia), pp 559-570.
- 36. Faqeeh A, Aghababaei Samani K (2012) Community detection based on the ’clumpiness’ matrix in complex networks. Physica A. 391, 7:2463-2474.
- 37. Krzakala F, Moore C, Mossel E, Neeman J, Sly A, Zdeborová L, and Zhang P (2013) Spectral redemption in clustering sparse networks. PNAS, 110, 52:20935-20940.
- 38. Capocci A, Servedio V, Caldarelli G and Colaiori F (2004) Community Detection in large networks. Lecture Notes Comput. Sci. 3243:181-187.
- 39. Donetti L and Munoz MA (2004) Detecting network communities: a new systematic and efficient algorithm. J. Stat. Mech.: Theor. Exp. p 10012.
- 40. Slanina F, Konopásek Z (2010) Eigenvector localization as a tool to study small communities in online social networks. Adv. Comp. Sys. 13:699.
- 41. Namaki A, Raei R, Jafari GR (2011) Comparing Tehran stock exchange as an emerging market with mature market by Random Matrix Approach, International Journal of Modern Physics C. 22, No. 4: 371-383.
- 42. Jafari G, Shirazi AH, Namaki A, Raei R (2011) Coupled Time Series Analysis: Methods and Applications. Computing in Science and Engineering 13 (6): 84-89.
- 43. Namaki A, Jafari GR, Raei R (2011) Comparing the structure of an emerging market with a mature one under global perturbation. Physica A 390 (17): 3020-3025.