Precision Measurement of the Proton Flux in Primary Cosmic Rays from 1 GV to 1.8 TV with the Alpha Magnetic Spectrometer on the International Space Station
Abstract
A precision measurement of the proton flux in primary cosmic rays with rigidity from 1 GV to 1.8 TV is presented based on 300 million events. The results show that the proton flux is smooth and exhibits no sharp structures with rigidity. The detailed variation with rigidity of the flux spectral index is presented. The spectral index is progressively hardening at high rigidities. Solar effects are also discussed.
Protons are the most abundant particles in cosmic rays. Knowledge of the precise behavior of the proton flux as a function of energy is important in understanding the origin, acceleration, and propagation of cosmic rays. The precise measurement of the proton flux in primary cosmic rays in the rigidity range from 1 GV to 1.8 TV performed by the Alpha Magnetic Spectrometer (AMS) during the first 30 months of operation onboard the International Space Station (ISS) is described as published in bib:proton . Moreover, the first 5 years of data collected from May 2011 to May 2016, reported in this proceeding, show structures, in the low rigidity range, related to the long and short time scale solar activity.
I AMS DETECTOR
AMS is a general purpose high energy particle physics detector in space. The layout and description of the detector are presented in bib:ams-02 . The key elements used in this measurement are the permanent magnet, the silicon tracker, four planes of time of flight (TOF) scintillation counters, and the array of anticoincidence counters (ACC). AMS also contains a transition radiation detector (TRD), a ring imaging Čerenkov detector (RICH), and an electromagnetic calorimeter (ECAL). The central field of the magnet bib:newlayout is 1.4 kG. Before flight, the field was measured in 120,000 locations to an accuracy of better than 2 G. On orbit, the magnet temperature varies from to C. The field strength is corrected with a measured temperature dependence of C.
The tracker bib:tracker has nine layers, the first (L1) at the top of the detector, the second (L2) above the magnet, six (L3 to L8) within the bore of the magnet, and the last (L9) above the ECAL. L2 to L8 constitute the inner tracker. The tracker accurately determines the trajectory of cosmic rays by multiple measurements of the coordinates with a resolution in each layer of 10m in the bending direction. Together, the tracker and the magnet measure the rigidity of charged cosmic rays. The maximum detectable rigidity (MDR) is 2 TV over the 3 m lever arm from L1 to L9. Each layer of the tracker also provides an independent measurement of the absolute value of the charge of the cosmic ray. The charge resolution of the layers of the inner tracker together is for particles. Two planes of TOF counters bib:tof are located above L2 and two planes are located below the magnet. The average time resolution of each counter for particles has been measured to be 160 ps and the overall velocity () resolution to be %. This discriminates between upward- and downward-going particles. The coincidence of signal from the four TOF planes together with the absence of signal from the ACC provides a charged particle trigger. The coincidence of 3 out of the 4 TOF layers with no ACC requirement was instead used to provide an unbiased trigger. The unbiased trigger, prescaled by 1%, was used to measure the efficiency of the charged particle trigger.
II SELECTION AND FLUX ANALYSIS
In the first 30 months ( s) AMS collected cosmic ray events. Due to the influence of the geomagnetic field, this collection time for primary cosmic rays increases with increasing rigidity becoming constant at s above 30 GV.
By selecting events to be downward going and to have a positive reconstructed track in the inner tracker with charge compatible with , events were obtained. In order to have the best resolution at the highest rigidities, further selections are made by requiring the track to pass through L1 and L9 and to satisfy additional track fitting quality criteria such as a in the bending coordinate. In addition, to select only primary cosmic rays, well above the geomagnetic cutoff, the measured rigidity is required to be greater than 1.2 times the maximum geomagnetic cutoff within the AMS field of view. The cutoff was calculated by backtracing bib:back particles from the top of AMS out to 50 Earth’s radii using the IGRF bib:IGRF geomagnetic model. These procedures resulted in a sample of primary cosmic rays with .
Since protons are the dominant component of cosmic rays, the selected sample has only small contributions of other particles, mainly deuterons which are not removed in this analysis. The deuteron contribution decreases with rigidity: at 1 GV it is less than 2% and at 20 GV it is 0.6% bib:deut-else ; bib:deut-ams . The sample also contains protons from nuclei which interact at the top of AMS (for example, in L1 or the TRD). From the measured flux bib:ams-he and Monte Carlo simulation this contribution is 0.5% at 1 GV decreasing to less than 0.1% at and above 10 GV. Contamination from and bib:ams-e7p5 , overwhelmingly , was estimated to be less than 0.1% over the entire rigidity range. The background contributions from protons which originated in the interactions of nuclei at the top of AMS and , both noticeable only below 2 GV, are subtracted from the flux and the uncertainties are accounted for in the systematic errors.
After selection, the isotropic proton flux for the rigidity bin is
| (1) |
where is the number of events corrected with the rigidity resolution function by means of the unfolding procedure described in details in bib:proton . is the effective acceptance, is the trigger efficiency, and is the collection time. The proton flux was measured in 72 bins, to 72, from 1 GV to 1.8 TV with bin widths chosen according to the rigidity resolution. The effective acceptance was calculated using Monte Carlo and then corrected for small differences found between the data and Monte Carlo event selection efficiencies. The trigger efficiency is measured from data with the unbiased trigger events. The trigger efficiency ranges from 90 to 95%. The 5 to 10% inefficiency is due to secondary -rays in the magnetic field entering the ACC. The Monte Carlo agrees with the measured trigger efficiency within 0.5%. The bin-to-bin migration of events was corrected using a rigidity resolution function obtained from Monte Carlo simulation and verified with test beam data bib:proton .
Extensive studies were made on systematic errors. The errors include uncertainties in the trigger efficiency, the acceptance, the background contamination, the geomagnetic cutoff factor, the event selection, the unfolding, the rigidity resolution function, and the absolute rigidity scale. The trigger efficiency error is dominated by the statistics available from the 1% prescaled unbiased event sample. It is negligible (less than 0.1%) below 500 GV and reaches 1.5% at 1.8 TV. The geomagnetic cutoff factor was varied from 1.0 to 1.4 and the resulting proton fluxes showed a systematic uncertainty of 2% at 1 GV and negligible above 2 GV. Using the most recent IGRF model bib:IGRF12 and the IGRF model with external non-symmetric magnetic fields bib:tsyg does not introduce observable changes in the flux values nor in the systematic errors.
The effective acceptance was corrected for small differences between the data and the Monte Carlo samples related to the event reconstruction and selection. Together, the correction was found to be 5% at 1 GV decreasing below 2% above 10 GV, while the corresponding systematic uncertainty is less than 1% above 2 GV.
The detector is mostly made of carbon and aluminum. The corresponding inelastic cross sections of and are known to within 10% at 1 GV and 4% at 300 GV bib:cross , and 7% at 1.8 TV from model estimations bib:geant . The inelastic cross sections are used in the Monte Carlo based estimation of the effective acceptance and, to estimate the systematic error due to the uncertainty in the inelastic cross sections, dedicated samples of protons were simulated with the and cross sections varied by 10%. From the analysis of these samples together with the current knowledge of the cross sections, a systematic error of 1% at 1 GV, 0.6% from 10 to 300 GV, and 0.8% at 1.8 TV was obtained.
The rigidity resolution function was verified with data from both the ISS and the test beam. For this, the residuals between the hit coordinates measured in tracker layers L1 and L9 and those obtained from the track fit using the information from only the inner tracker L2 to L8 were compared between data and simulation. In order to validate the alignment of the external layers, the difference between the rigidity measured using the information from L1 to L8 and from L2 to L9 was compared between data and simulation. The resulting uncertainty on the MDR was estimated to be 5%. The corresponding unfolding errors were obtained by varying the width of the Gaussian core of the resolution function by 5% and the amplitude of the non-Gaussian tails by 20% over the entire rigidity range and found to be 1% below 200 GV and 3% at 1.8 TV.
There are two contributions to the systematic uncertainty on the rigidity scale. The first is due to residual tracker misalignment. From the 400 GeV/c test beam data it was measured to be less then 1/300 TV-1. For the ISS data this error was estimated by comparing the ratio for electron and positron events, where is the energy measured with the ECAL and is the momentum measured with the tracker, see bib:ams-pf for details. It was found to be TV-1, limited by the current high energy positron statistics. The second systematic error on the rigidity scale arises from the magnetic field map measurement (0.25%) and its temperature corrections (0.1%). Taken in quadrature and weighted by the measured flux, this amounts to less than 0.5% systematic error on the flux for rigidities above 2 GV.
III RESULTS AND CONCLUSIONS
The measured proton flux including statistical and systematic errors is displayed Figure 1 and tabulated in bib:table as a function of rigidity at the top of the AMS detector. The contributions to the systematic errors is described in details in bib:proton . Figure 1 shows the flux as a function of rigidity with total errors where the rigidity points are placed along the abscissa at R̃ calculated for a flux bib:Lafferty .
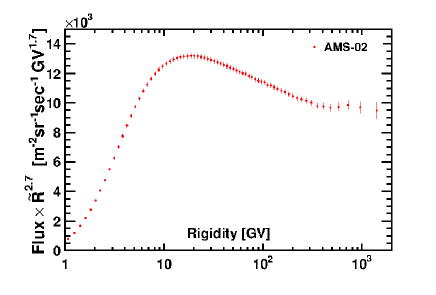
A power law with a constant spectral index , in GV and a normalization factor, does not fit the flux reported in this work and shown in Figure 1 at the 99.9% C.L. for GV. Applying solar modulation in the force field approximation bib:Gleeson also does not fit the data at the 99.9% C.L. for GV. The flux was therefore fitted with a modified spectral index bib:Beuermann
| (2) |
where quantifies the smoothness of the transition of the spectral index from for rigidities below the characteristic transition rigidity to for rigidities above . Fitting over the range 45 GV to 1.8 TV yields a and parameters values are listened in Table 1.
| Fit with Eq. 2 | value | fit-err | sys-err | sol-err |
|---|---|---|---|---|
| C [sr-1sec-1GV-1] | 0.4544 | 0.0004 | ||
| -2.849 | 0.002 | |||
| 0.133 | ||||
| 0.024 | ||||
| [GV] | 336 |
The first error quoted fit-err, takes into account the statistical and uncorrelated systematic errors from the flux reported in bib:proton . The second sys-err is the error from the remaining systematic errors, namely from the rigidity resolution function and unfolding, and from the absolute rigidity scale, with their bin-to-bin correlations accounted for using the migration matrix. The third sol-err is the uncertainty due to the variation of the solar potential to 0.62 GV bib:modulation . The fit confirms that above 45 GV the flux is incompatible with a single spectral index at the C.L. The fit is shown in Figure 2.
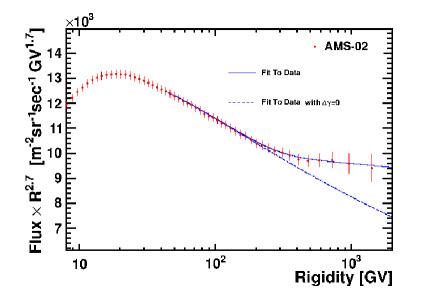
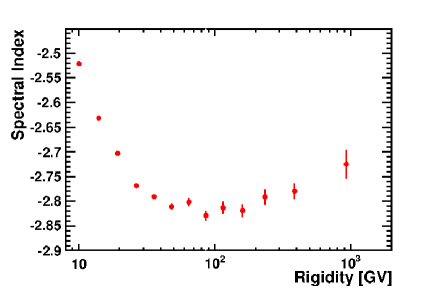
For illustration, the fit result with set to zero is also shown in Figure 2. To obtain the detailed variation of with rigidity in a model independent way, the spectral index is calculated from
| (3) |
over independent rigidity intervals above 8.48 GV, with a variable width to have sufficient sensitivity to determine . The results are presented in Figure 3. The spectral index varies with rigidity and it is progressively harder with rigidity above 100 GV.
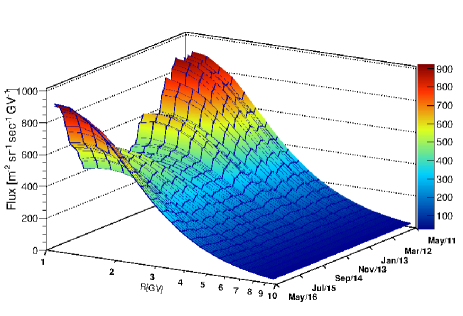
While at rigidity GV the spectra remains stable versus time, the low rigidity range exhibits variations strongly reflecting the solar activity effect. Figure 4 displays the proton flux versus time from May 2011 to May 2016 and rigidity from 1 GV to 10 GV. In the first five years of operations AMS was collecting data during the ascending phase of solar cycle 24 through its maximum and toward the minimum. The proton spectra was gradually decreasing reaching the minimum between the end of 2013 and the beginning of 2014. In 2015 the proton flux started to recover: at the end of May 2016, AMS proton flux was higher that the one measured at the beginning of the mission. In addition to the overall modulation effect, the AMS proton flux exhibits structures related to strong solar events i.e. Coronal Mass Ejections and Forbush decreases as already reported in bib:icrc2015 .
In conclusion, a precision measurement of the proton flux in primary cosmic rays with rigidity from 1 GV to 1.8 TV was presented. At high rigidities the flux deviates from a single power law and progressively hardens above 100 GV. At low rigidities, the proton flux is modulated by the solar activity which reached its maximum in 2014. In addition to the overall solar modulation effect, the low rigidity flux shows structures related to short time scale solar activity that are usually more pronounced during solar maximum. Measurement of the time dependent solar modulation of primary cosmic rays fluxes with AMS on the ISS will be the subject of future publication.
Acknowledgements.
This work has been supported by acknowledged person and institutions in bib:proton and by National Science Foundation Early Career under grant NSF AGS-1455202, Wyle Laboratories, Inc. under grant NAS 9-02078, and NASA and Earth Space Science Fellowship under grant 15-HELIO15F-0005.References
- (1) M. Aguilar et al. Phys. Rev. Lett. 114 , 171103(2015).
- (2) See Reference [8] in bib:proton .
- (3) K. Luebelsmeyer et al.Nucl. Instrum. Methods Phys. Res., Sect. A 654, 639 (2011).
- (4) B. Alpat et al. Nucl. Instrum. Methods Phys. Res., Sect. A 613, 207 (2010).
- (5) V. Bindi et al.Nucl. Instrum. Methods Phys., Sect. A 743, 22 (2014).
- (6) J. Alcaraz et al.Phys. Lett. B 484, 10 (2000); see also Ref. bib:deut-ams .
- (7) C. C. Finlay et al.Geophys. J. Int. 183/3, 1216 (2010).
- (8) P. Papini et al. Astrophys. J. 615, 259 (2004).
- (9) M. Aguilar et al.Physics Reports 366/6, 331 (2002).
- (10) M. AguilarPhys. Rev. Lett. 115, 211101 (2015).
- (11) M. Aguilar et al. Phys. Rev. Lett. 113, 121102 (2014).
- (12) C. C. Finlay et al., Geophys. J. Int. 183, 1216 (2010). Data from IGRF-12 (2015) were used, currently available at https://www.ngdc.noaa.gov/IAGA/vmod/igrf.html.
- (13) P. Bobik et al. Journal of Geophysical Research 111, A05205 (2006); N. A. Tsyganenko, M. I. Sitnov,Geophysical Res.: Space Physics 110, A3, 2156 (2005).
- (14) N. Abgrall et al.Phys. Rev. C 84, 034604 (2011); J. R. Letaw et al. Astrophys. J. Supp. 51 271 (1983); A. S. Carroll et al.Phys. Lett. B 80, 319 (1979); S. P. Denisov et al. Nucl. Phys. B 61, 62 (1973); G. Bellettini et al. Nucl. Phys. 79, 609 (1966); T. Bowen et al. Il Nuovo Cimento 9, 908 (1958).
- (15) J. Allison et al. IEEE Trans. Nucl. Sci. 53, 270 (2006); S. Agostinelli et al.Nucl. Instrum. Methods Phys. Res., Sect. A 506, 250 (2003).
- (16) L. Accardo et al. Phys. Rev. Lett. 113, 121101 (2014); M. Aguilar et al.Phys. Rev. Lett. 110, 141102 (2013).
- (17) See Supplemental Material at http://link.aps.org/ supplemental/10.1103/PhysRevLett.114.171103 for the tabulated flux.
- (18) G. D. Lafferty and T. R. Wyatt Nucl. Instrum. Methods Phys. Res., Sect. A 355, 541 (1995). Eq. (6) was used.
- (19) L. J. Gleeson and W. I. Axford,Astrophys. J. 154, 1011 (1968).
- (20) See for example Eq. (1), K. Beuermann et al., Astron. Astrophys. 352, L26 (1999) and Eq. (43), L. Hernquist Astrophys. J. 356, 359 (1990).
- (21) I. G. Usoskin et al. J. Geophys. Res. 116 A02104 (2011); K. G. McCracken, J. BeerJ. Geophys. Res. 112 A10101 (2007); I. G. Usoskin, et al. J. Geophys. Res. 110 A12108 (2005).
- (22) C. Consolandi on behalf of AMS collaboration Proc. on the 34th International Cosmic Rays Conference. ICRC 2015, 117.